PEBBLEWRITER.COM IS LIVE!


*************** PEBBLEWRITER.COM IS LIVE! TO SIGN UP, CLICK HERE ***************


Showing posts with label Bat Pattern. Show all posts

Thursday, August 4, 2016

A New Analog: Aug 3, 2016

I love analogs.  I love the way they clearly lay out a very tradeable path, slicing through all the noise and the head fakes.  Our first was a doozy, correctly forecasting the 21% Jul-Oct 2011 correction with deadly accuracy [see HERE.] 

Our most recent one, posted in Mar 2015, forecast the 12.5% correction that would occur almost five months later [see HERE.]
2016-08-03 analog 2015

Although I dislike day trading, it's become a necessary evil.  Gone are the days when a weak close practically guaranteed a weak opening the following morning. It's just as likely, if not more so, to result in a gap higher.  Strong closes are almost as treacherous.

So, it's always fun when a new one appears on the horizon and we get a chance to take some longer-term positions.

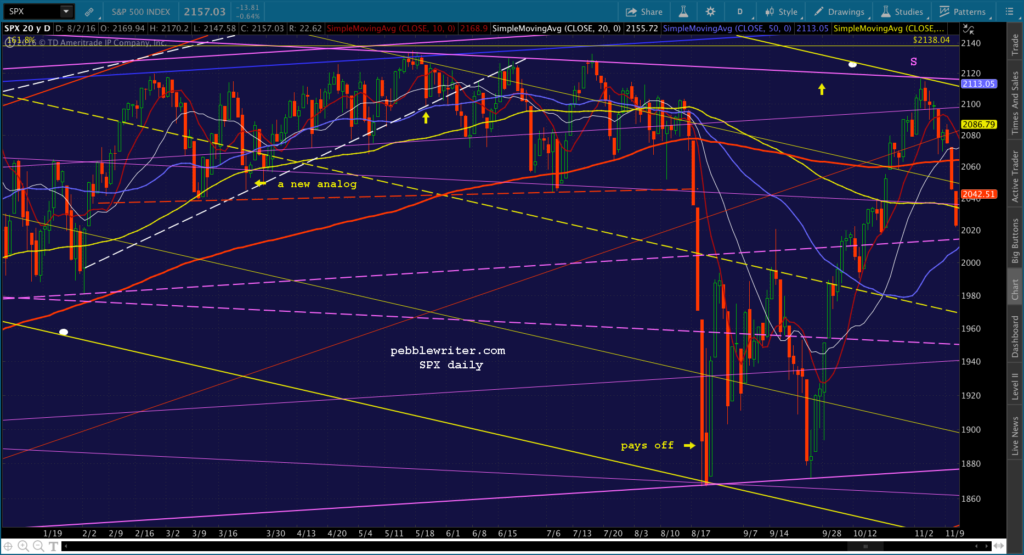
First, let’s take a look at the REALLY big picture for the last 20 years.


Notice how SPX:
  • completed a backtest of the huge white channel midline in late 2014
  • reached the top of the rising red channel (within the white channel) in late 2014
  • reached the top of the rising purple channel in Feb 2015
  • despite reaching those channel lines, SPX continued rising to the yellow 1.618 (2138, actually reached 2134) in May 2015.
After reaching 2134 and tagging the top of the rising purple channel again, SPX had all kinds of problems.  But, the downside was contained to the 1.272 extension at 1823.

In fact, 1823 has been backtested seven different times — including the time they failed to contain it on Jan 24, 2014 (it fell 85 points in 9 sessions, popped back up in 4.)  The following times — Apr 11, 2014, Oct 15, 2014, Jan 20, 2016 and Feb 11, 2016 — they held it to within 13 points.

Two things should be quite obvious from this.  First, having not cared one bit about 1823 as resistance on the way up, they wanted to make damn sure it served as solid support in the event of any declines (SPX should have reversed strongly at 1823, as it completed a huge Butterfly Pattern set up by the plunge from 1576 to 666 between 2007 and 2009.)

Second, it’s the clearest indication of market manipulation one could ever hope for.  You simply don’t get severe intraday reversal of the sort that occurred on those days without some heavy interference (Bullard hinting at QE4, USDJPY spiking, oil futures doubling in price, etc.)

2016-08-03 SPX daily 1043

But, none of that will come as a surprise to regular readers.  We’ve documented market manipulation on a regular basis for the past five years.  The reason I mention it is because it has a direct bearing on what to expect from the “market” going forward.


continued at pebblewriter.com

Tuesday, March 5, 2013

After the Funding's Gone

~reposted from pebblewriter.com

After a scary drop in equity futures overnight, the market looks to open soft...but not exactly panicked. I remain short since 1525.34 on the 28th, but will continue to play any significant bounces that come our way.

The dollar is still looking strong, reflecting both plenty of fear and euro weakness.  Note, DX reached our intermediate target range from last month (the red .618 @ 82.22 & white 1.618 at 82.28.)


The next level of resistance is the red .786 at 83.064 where it intersects with the purple 1.618 at 83.122.  The acceleration channel that's carried prices skyward since Feb 1 intersects that nexus this week.

Also intersecting there are two channel lines -- the large white midline and the much larger yellow midline -- seen here on the weekly chart.


Daily RSI still shows plenty of upside potential, though we've also seen some negative divergence start to creep into the picture.


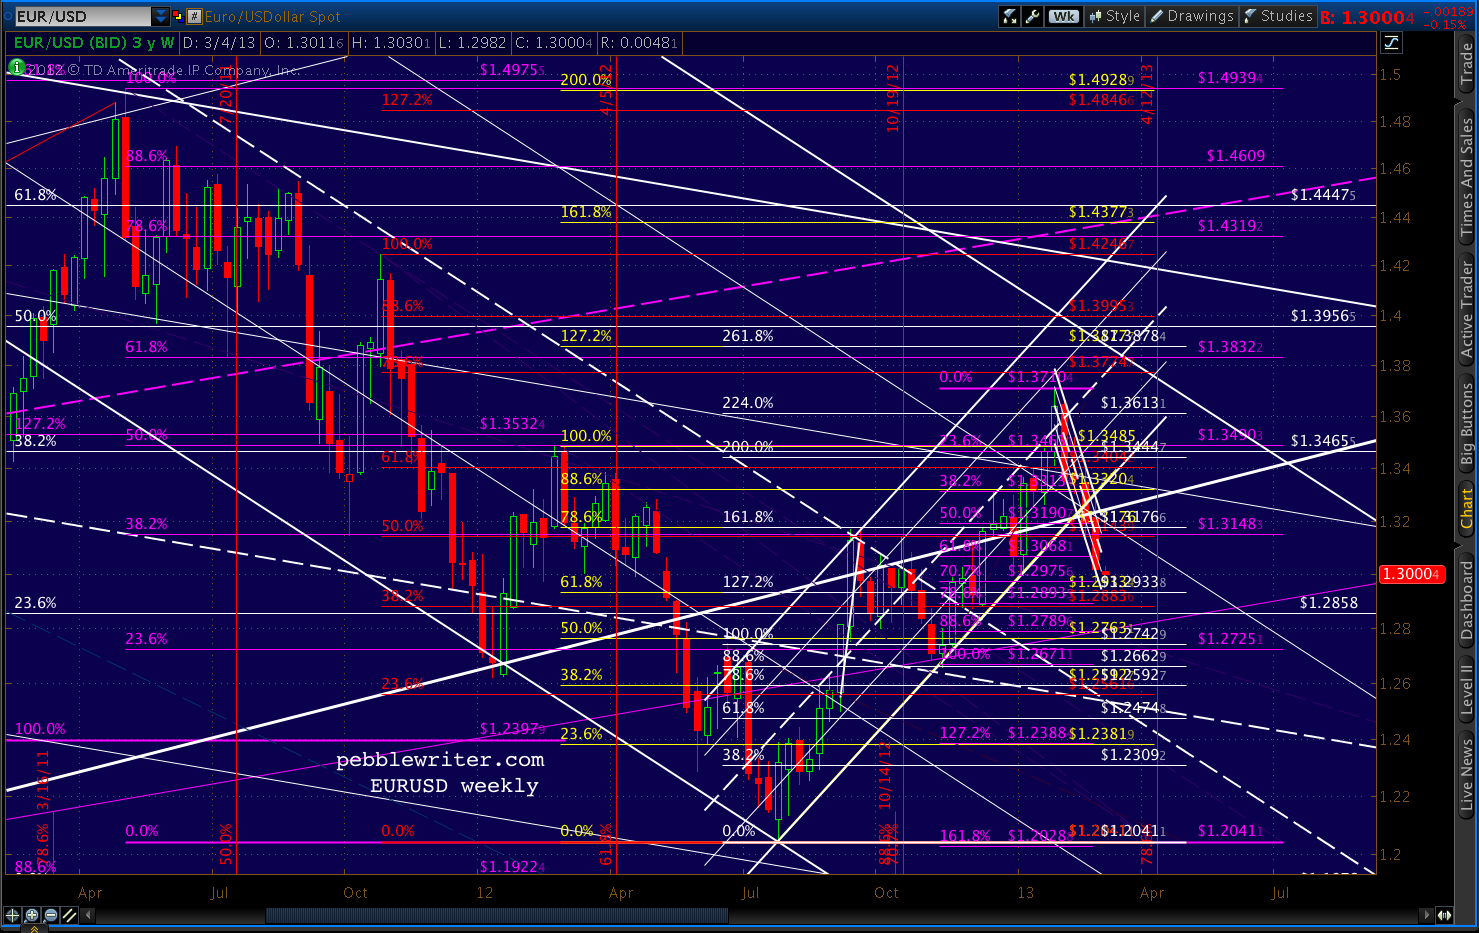
As noted back on Feb 21, the EURUSD has broken down from its rising channel (white) and has accelerated to the downside, breaking the Jan 4 1.2996 low and the psychologically important 1.30 level.


The intersection of the purple .618 and two white channels at 1.38 will have to wait (until my next visit across The Pond, no doubt.)


Losing the rising white channel hurts momentum quite a bit, but it's the drop back through the 75% line on the falling white channel that represents the bigger problem for the pair.

This channel dates all the way back to Dec 06. Reaching the top for the third time is still possible, of course, but it's that much harder now that the pair needs to retake the higher channel line and mount a fresh attack.

I've redrawn the falling white channel as red and will lower its top (for now) to reflect the brick wall it ran into.  I've also sketched in a more relaxed rising channel (light blue) that reflects potential channel support at current prices (the intersection of the falling red .75 and the rising light blue .25.)


I don't know whether the pair needs to retest the falling white midline or not.  The bottom of the new light blue channel intersects with the red .75 in mid-March.  Also there is the .25 of the very large rising purple channel, which provided a huge bounce in Jun 2010.  It's easier to see in the LT chart below.


Recall that we closed a long position and last went short at 1525.34.  From there, SPX fell nearly to our initial target (1496-1500), reaching 1501.48 Friday morning before the bounce to 1519.99.

As we discussed last week, the reversal at the red .786 could be the full extent of a corrective wave on the way lower (the B wave in an A-B-C)  that is meant to test the bottom of the white or purple channels.  But, it could also be the Point B in a Butterfly Pattern targeting 1531 or 1540.


continued on pebblewriter.com... 


Tuesday, January 29, 2013

DJIA: Any Time Now

Last week, with the DJIA at 13,866, we took a look at the potential for a double-top and a Dow Theory non-confirmation with the Transports [see: The Dow - Time to Double Down.]

Critical levels included the rising wedge upper bound, not to mention a whole slew of approaching Harmonic targets.


Don't look now, but DJIA is only a few points away from tagging the upper bound of the rising wedge, the 2.24 of a Crab Pattern (in white below), and the 1.272 of a Butterfly Pattern (red.)

The double-top up at 14,198 and some larger Harmonic patterns (14,145-14,201) are still a possibility, but this balloon looks ready to pop.


Pebblewriter.com combines Harmonic Patterns with traditional chart patterns and technical analysis.  For more on our process and results, visit pebblewriter.com.


Thursday, January 24, 2013

Bonds: The Big Picture

~reposted from pebblewriter.com

First, an important caveat:  I'm not a bond guy.  Never have been, never will be -- at least with long bonds under 8%. To me, the idea of sinking even one dollar into a security (which should be downgraded, mind you) that guarantees less than 2% for 10 years borders on insanity.

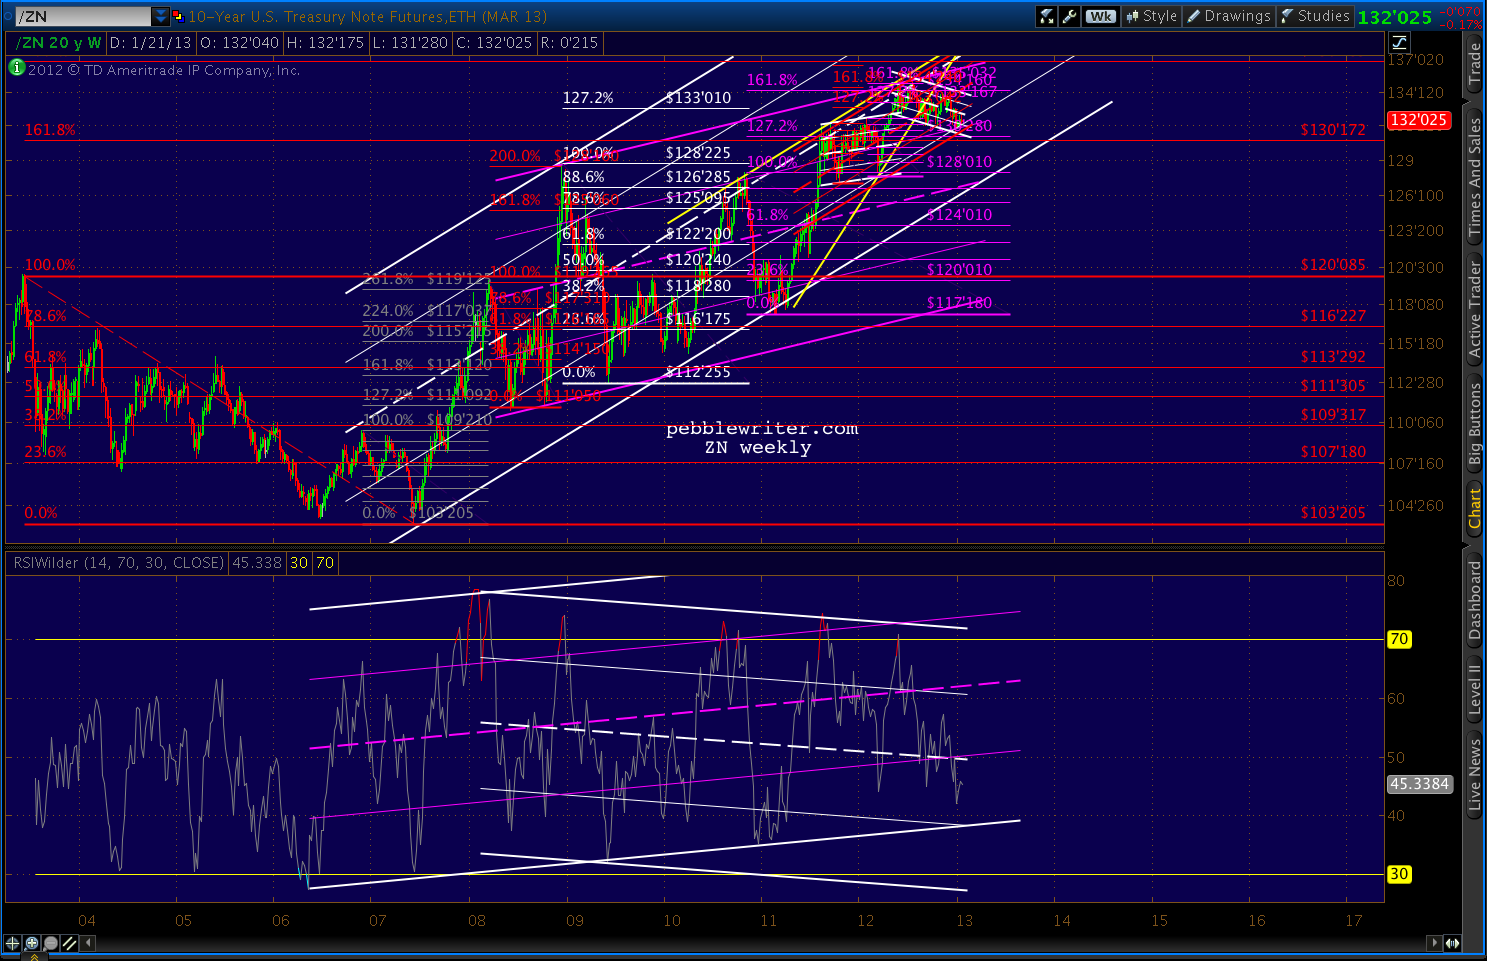
But, different strokes and all that.  Plus, bonds can be a good window on equities and currencies, so I don't mind charting them once in a while.  The 10-yr has obviously been on a tear for several years.  It's settled back from the 2008-09 spike into the bottom half of a channel that dates back to 2005 (white.)


The big question is whether the white channel is still in charge, or the less aggressively sloped purple one has taken over.  Making things interesting, there's a pretty well-formed rising wedge that broke down in August.

But, the RW is slightly suspect because the July 25 high was slightly exceeded on Nov 16 and Dec 6, meaning there are two higher highs and a higher low in place since the August break (though both highs came on negative divergence relative to the July high.)

Harmonics have performed pretty well with the 10-yr note.  The chart below shows a big Crab (grey), followed by another Crab (red), a Bat (white) and another Crab (purple.)  Each previous Crab Pattern completion has been followed by a significant retreat, so we might suspect one here with the purple pattern completion.


The only potential hitch is whether the white pattern is still in play.  Bats can and do go on to form Crabs, and the white 1.618 is way up at 138'170 -- a 4.5% increase from current levels.


There is a significant amount of negative divergence on the daily and weekly channels, so I suspect not.  But, obviously, a strong equities sell-off would turn that assumption on its head.

A return to the top of the red channel would take daily RSI to the purple midline.  On negative divergence, that could easily line up with the white 1.618.


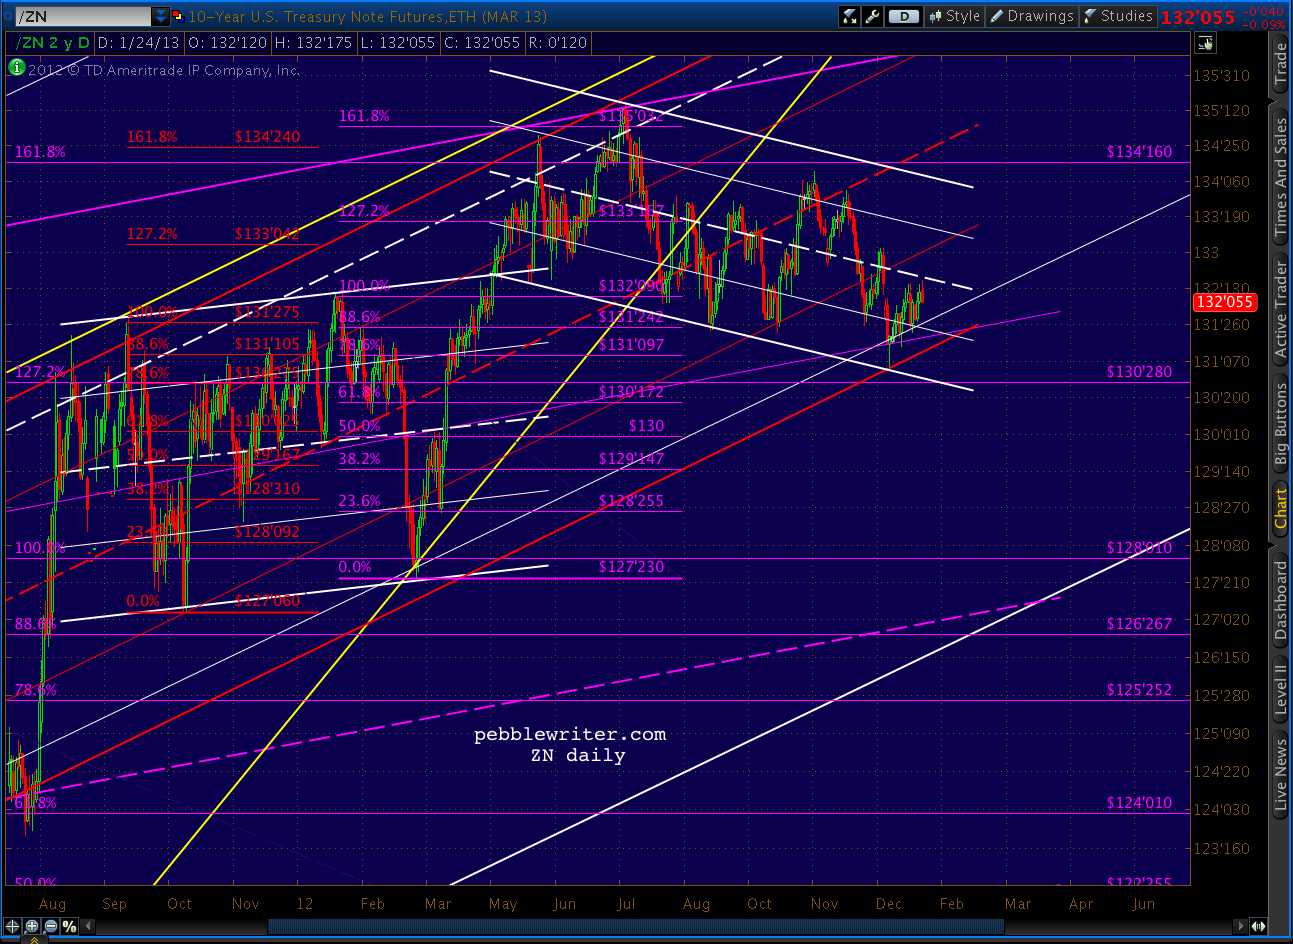
The close-up shows a potential channel since the most recent Crab Pattern reversal and the impact of the white 25% channel line.  The easiest call is for a bounce off this line as well as the small channel bottom.  If that occurs, the 138'170 level is in the cards.


Otherwise, the bottom of the white channel and the middle of the purple channel intersect at the 126-127 area (the purple .886 is 126'267 and the white .886 is 126'285) around the middle of March.

Saturday, October 27, 2012

Forcasting Made Simple(r)

reposted from pebblewriter.com...

For those not incorporating harmonics into their trading strategy, I can only imagine how utterly confusing the market's last drop must have been.  In fact, the entire past six weeks have been a market maker’s dream — constant whipsawing that would have been impossible to anticipate based on earnings, economic data or the advice of the financial media's talking heads.

Seen through the prism of harmonics patterns, the reversal at 1474 was simply a Bat Pattern completion that paid off the 1576 – 666 drop between 2007 and 2009 [see: The World According to Ben].  And, every reversal since then has followed the rules of ordinary harmonic patterns — with an occasional assist from chart patterns (mostly channels.) 


As can be seen from the chart below, the initial drop from 1474 to 1430 was a Bat Pattern retracement and channel line tag.  It, in turn, set up a Bat Pattern (in purple) that signaled a reversal at 1469.50 (came at 1470.96) and established a declining channel (in white.)


The next move down was to the bottom of the new channel and a .618 retracement of the 1396-1474 rally.  It was followed by another Bat Pattern (in green) targeting a reversal at 1465.78 (came at 1464.02.)

The final move down was initially to the white channel bottom, but pushed through to complete a Bat Pattern .886 retracement of the 1396 to 1474 move, as well as a Crab Pattern (1.618 extension) of the 1430 to 1470 move.

By reaching 1405.45, it also solidified the upside case originally discussed back on the 17th [see: Charts I'm Watching - Oct 17, 2012.]
If 1474 was a normal wave 3 or wave 5 high, we would typically be open to a corrective wave of greater than a .618 retracement.  Look what happens if we make it a .786 or .886 retracement.  Suddenly, the yellow 1.618 lines up very nicely with the other 1.618′s up there at 1515-1518.
In other words, a Crab Pattern with 1405 as its base instead of 1425 (the previous low) is consistent with the 1515 Crab Pattern target established by the 1347-1074 drop from July to October 2011, and the 1518 Crab Pattern target set up by the 1422-1266 drop from April to June 2012.


In hindsight, the harmonics and chart patterns have done an outstanding job of showing us the way — even though there were times when the direction suggested made no sense at all.  I'm almost certain that any unsuccessful trades I’ve made in the past six weeks were the result of “knowing better” than the charts and ignoring their signals.

The question now is whether reaching our 1405 target really suggests a move to 1500+, or is it merely setting the stage for a massive bull trap?

For help, I’m turning to an analog I think looks very promising.  We have done very well with these in the past [see: Why Analogs Work.]  The 2011 as 2007/8 analog knocked the cover off the ball last summer.  And, the latest took us from 1422 down to 1266 and back to 1474 in spectacular style — earning us 60%+ returns over those six months.


This new analog is important not just for its capacity to protect investors from losses, but its potential for nice gains for those who don’t mind speculating a bit.

continued at pebblewriter.com...