I love analogs. I love the way they clearly lay out a very tradeable
path, slicing through all the noise and the head fakes. Our first was a
doozy, correctly forecasting the 21% Jul-Oct 2011 correction with
deadly accuracy [see HERE.]
Our most recent one, posted in Mar 2015, forecast the 12.5% correction that would occur almost five months later [see HERE.]
Although I dislike day trading, it's become a necessary evil. Gone are the days when a weak close practically guaranteed a weak opening the following morning. It's just as likely, if not more so, to result in a gap higher. Strong closes are almost as treacherous.
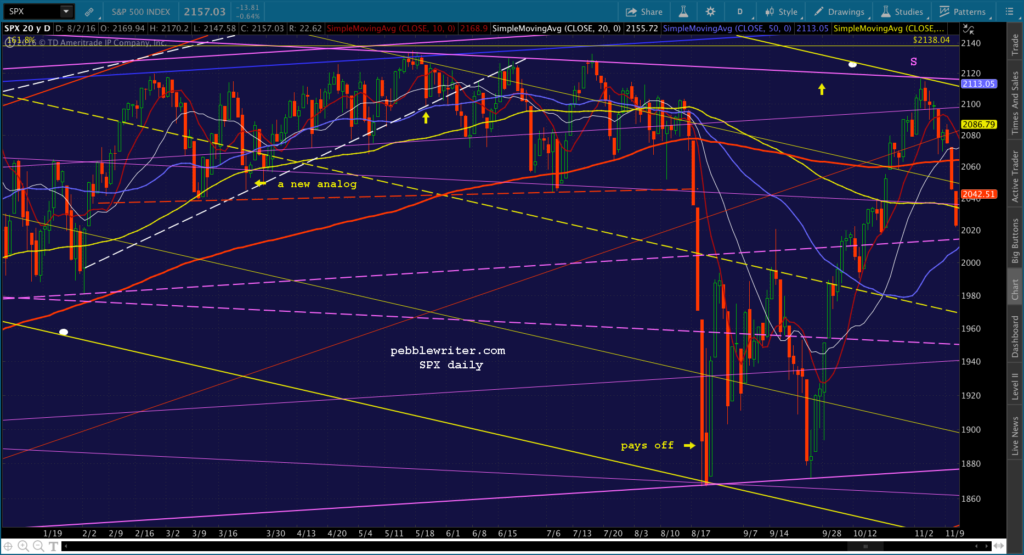
So, it's always fun when a new one appears on the horizon and we get a chance to take some longer-term positions.
First, let’s take a look at the REALLY big picture for the last 20 years.

Notice how SPX:
In fact, 1823 has been backtested seven different times — including the time they failed to contain it on Jan 24, 2014 (it fell 85 points in 9 sessions, popped back up in 4.) The following times — Apr 11, 2014, Oct 15, 2014, Jan 20, 2016 and Feb 11, 2016 — they held it to within 13 points.
Two things should be quite obvious from this. First, having not cared one bit about 1823 as resistance on the way up, they wanted to make damn sure it served as solid support in the event of any declines (SPX should have reversed strongly at 1823, as it completed a huge Butterfly Pattern set up by the plunge from 1576 to 666 between 2007 and 2009.)
Second, it’s the clearest indication of market manipulation one could ever hope for. You simply don’t get severe intraday reversal of the sort that occurred on those days without some heavy interference (Bullard hinting at QE4, USDJPY spiking, oil futures doubling in price, etc.)

But, none of that will come as a surprise to regular readers. We’ve documented market manipulation on a regular basis for the past five years. The reason I mention it is because it has a direct bearing on what to expect from the “market” going forward.
continued at pebblewriter.com…
Our most recent one, posted in Mar 2015, forecast the 12.5% correction that would occur almost five months later [see HERE.]

Although I dislike day trading, it's become a necessary evil. Gone are the days when a weak close practically guaranteed a weak opening the following morning. It's just as likely, if not more so, to result in a gap higher. Strong closes are almost as treacherous.
So, it's always fun when a new one appears on the horizon and we get a chance to take some longer-term positions.
First, let’s take a look at the REALLY big picture for the last 20 years.

Notice how SPX:
- completed a backtest of the huge white channel midline in late 2014
- reached the top of the rising red channel (within the white channel) in late 2014
- reached the top of the rising purple channel in Feb 2015
- despite reaching those channel lines, SPX continued rising to the yellow 1.618 (2138, actually reached 2134) in May 2015.
In fact, 1823 has been backtested seven different times — including the time they failed to contain it on Jan 24, 2014 (it fell 85 points in 9 sessions, popped back up in 4.) The following times — Apr 11, 2014, Oct 15, 2014, Jan 20, 2016 and Feb 11, 2016 — they held it to within 13 points.
Two things should be quite obvious from this. First, having not cared one bit about 1823 as resistance on the way up, they wanted to make damn sure it served as solid support in the event of any declines (SPX should have reversed strongly at 1823, as it completed a huge Butterfly Pattern set up by the plunge from 1576 to 666 between 2007 and 2009.)
Second, it’s the clearest indication of market manipulation one could ever hope for. You simply don’t get severe intraday reversal of the sort that occurred on those days without some heavy interference (Bullard hinting at QE4, USDJPY spiking, oil futures doubling in price, etc.)

But, none of that will come as a surprise to regular readers. We’ve documented market manipulation on a regular basis for the past five years. The reason I mention it is because it has a direct bearing on what to expect from the “market” going forward.
continued at pebblewriter.com…
No comments:
Post a Comment