PEBBLEWRITER.COM IS LIVE!


*************** PEBBLEWRITER.COM IS LIVE! TO SIGN UP, CLICK HERE ***************


Showing posts with label oil. Show all posts

Thursday, August 4, 2016

A New Analog: Aug 3, 2016

I love analogs.  I love the way they clearly lay out a very tradeable path, slicing through all the noise and the head fakes.  Our first was a doozy, correctly forecasting the 21% Jul-Oct 2011 correction with deadly accuracy [see HERE.] 

Our most recent one, posted in Mar 2015, forecast the 12.5% correction that would occur almost five months later [see HERE.]
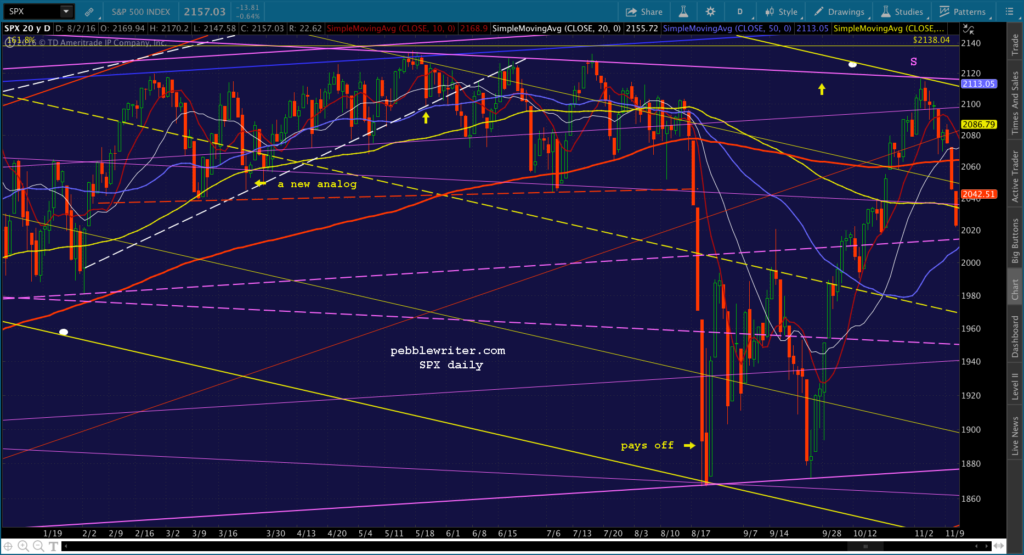
2016-08-03 analog 2015

Although I dislike day trading, it's become a necessary evil.  Gone are the days when a weak close practically guaranteed a weak opening the following morning. It's just as likely, if not more so, to result in a gap higher.  Strong closes are almost as treacherous.

So, it's always fun when a new one appears on the horizon and we get a chance to take some longer-term positions.

First, let’s take a look at the REALLY big picture for the last 20 years.


Notice how SPX:
  • completed a backtest of the huge white channel midline in late 2014
  • reached the top of the rising red channel (within the white channel) in late 2014
  • reached the top of the rising purple channel in Feb 2015
  • despite reaching those channel lines, SPX continued rising to the yellow 1.618 (2138, actually reached 2134) in May 2015.
After reaching 2134 and tagging the top of the rising purple channel again, SPX had all kinds of problems.  But, the downside was contained to the 1.272 extension at 1823.

In fact, 1823 has been backtested seven different times — including the time they failed to contain it on Jan 24, 2014 (it fell 85 points in 9 sessions, popped back up in 4.)  The following times — Apr 11, 2014, Oct 15, 2014, Jan 20, 2016 and Feb 11, 2016 — they held it to within 13 points.

Two things should be quite obvious from this.  First, having not cared one bit about 1823 as resistance on the way up, they wanted to make damn sure it served as solid support in the event of any declines (SPX should have reversed strongly at 1823, as it completed a huge Butterfly Pattern set up by the plunge from 1576 to 666 between 2007 and 2009.)

Second, it’s the clearest indication of market manipulation one could ever hope for.  You simply don’t get severe intraday reversal of the sort that occurred on those days without some heavy interference (Bullard hinting at QE4, USDJPY spiking, oil futures doubling in price, etc.)

2016-08-03 SPX daily 1043

But, none of that will come as a surprise to regular readers.  We’ve documented market manipulation on a regular basis for the past five years.  The reason I mention it is because it has a direct bearing on what to expect from the “market” going forward.


continued at pebblewriter.com

Tuesday, January 22, 2013

Ay, There's the Rube

Oil is often viewed as a proxy for economic health.  In a growing economy, energy consumption increases.  This increased demand generally pressures prices higher.  Likewise, a decline in oil prices often accompanies declining demand.

That's a greatly oversimplified view, of course.  It ignores such important issues such as Middle East tensions, weather and refinery anomalies, etc.
But, the most important of these external factors is the US dollar -- the currency by which oil is traded globally (for now.)

A weakening dollar is great for the many US companies that export overseas.  In general, it makes dollar denominated assets -- such as stocks, real estate, etc -- more attractive to overseas investors which helps the US attract and retain capital.

But, it makes foreign-sourced oil much more expensive.  This isn't an issue if you travel everywhere via America's world-class public transportation system.  But, it really sucks for the guy with a 3-ton SUV -- or anyone who consumes anything made overseas, for that matter.  Imports are about 18% of GDP.

So, what's a central banker to do?  Boost stocks and investment in US assets, and there's a pretty good chance you blow the budget of every American consumer.  (Of course, it only really affects those who eat and drive -- hey, buy a Chevy Volt already!)

Boost the dollar to make gas and food more affordable for the 50 million Americans living in poverty (1 in 5 children, 2 in 5 African American children), and you risk a true disaster -- a stock market decline.

Never fear... Bernanke and his fellow Guardians of the American Dream know whose bread to butter.

The chart below shows how crude light, the US dollar and the S&P 500 correlated over the past seven years.  In 2006 and 2007, oil and the stock market soared pretty much in sync while the dollar took it on the chin.  When SPX topped in late 2007, oil kept right on soaring -- because the dollar was still plunging.  Nationwide, gas hit $4.12/gallon in the summer of 2008.


We're all conditioned to think of dollar strength as a function of risk off.  But, as the financial crisis worsened, the dollar couldn't catch a bid.  Money fled to the euro, the swiss franc, the sterling -- anywhere but the dollar. There were several best-sellers on bookstore (remember those? shelves that advised putting every last cent into the euro.

From October 2007, when SPX peaked, until July 2008, stocks and the dollar moved pretty much in tandem.  But, as euro zone problems became more apparent, the dollar finally bottomed.  In August, as stocks began sliding again, the dollar finally took off.  Now deemed a safe haven, DX soared 27% by March of 2009, while stocks shed another 54% in value (58% in all.)

Of course, this did a number on oil -- already reeling from declining global demand.  CL plunged an astounding 78% in only six months -- from 147 to 33.  Fortunately for the stock market -- and especially the oil industry -- Ben Bernanke came to the rescue.  The first round of QE was a resounding success and both promptly reversed.

In the first three months alone, CL more than doubled to 73.  SPX added on a respectable 44%.  And the dollar took one for the team, shedding an initial 13% on its way to an 18% loss.

So, why the history lesson?  By now most of you have noticed a slight discrepancy over the past 3 1/2 years.  Oil and the dollar have formed triangles.  They've had their ups and downs, but in general the highs have been getting lower and the lows getting higher.  I use the term "coiling" because eventually prices won't be able to compress anymore.

This pent-up energy will eventually be released in the form of sharply higher or lower prices, though it won't necessarily happen tomorrow.   Both have drawn close to one side of the pattern, but there's still plenty of room for a reversal.

Oil, if it doesn't suddenly shoot higher, will probably bounce back down.  Likewise, the dollar is poised to bounce higher.


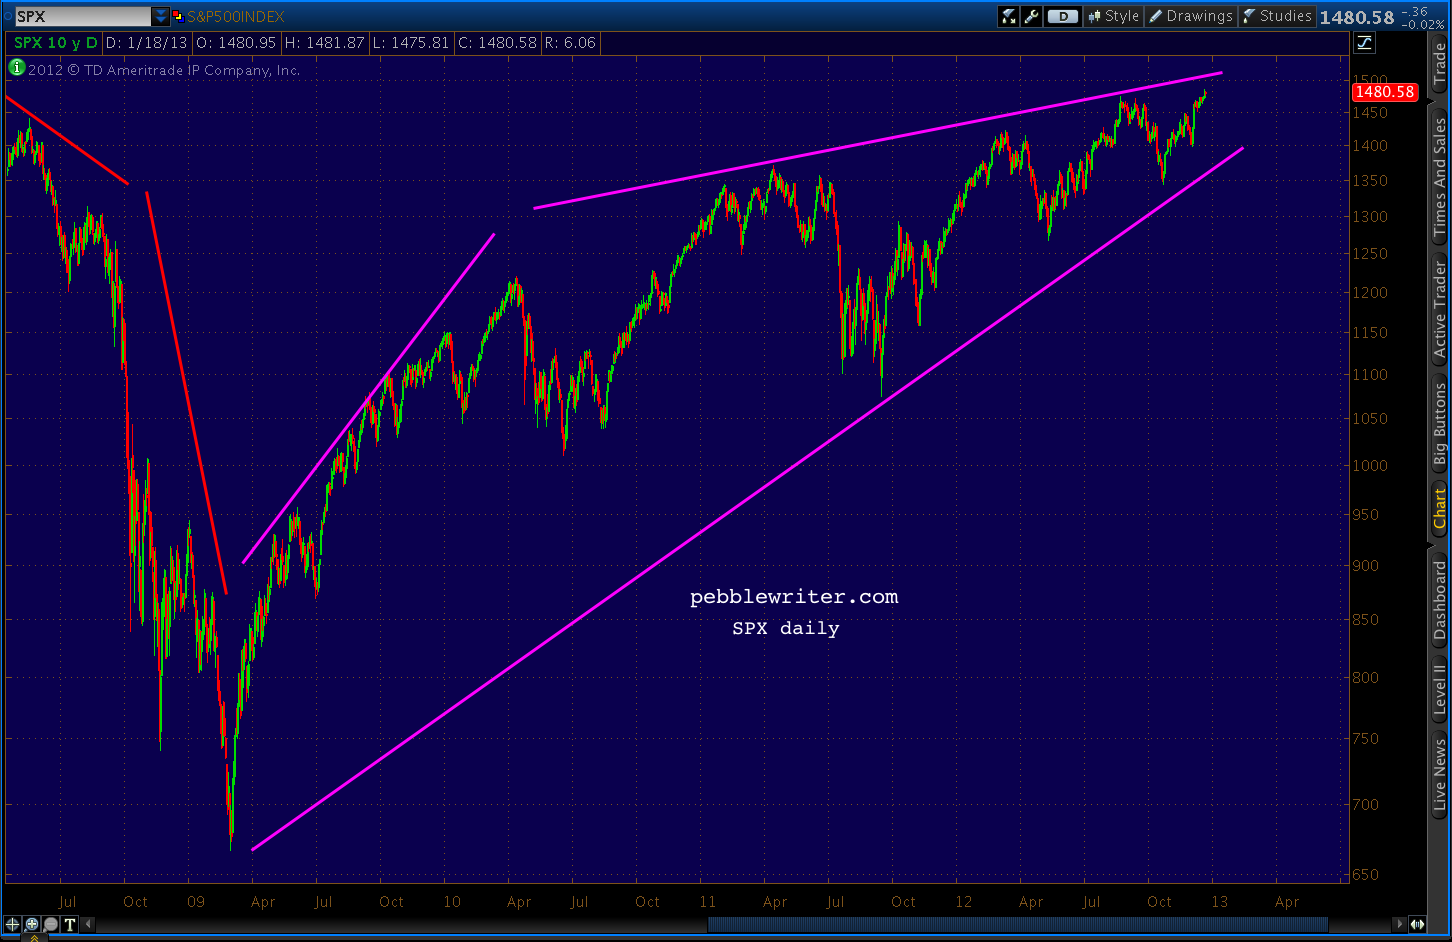
Stocks, on the other hand, have made a series of higher highs and higher lows in what's known as a rising wedge.  These patterns also can't last forever, and they almost always resolve to the downside.
Prices are much closer to the upper bound than the lower, which also suggests the next major move will be lower.  In fact, when rising wedges break down, they typically target their origin. Needless to say, a return to 2009 or even 2010 prices would be a huge blow to the rosy scenario TPTB are crafting.


Does oil offer any hints as to which way prices are likely to go?   I'm drawn to a few periods in particular.  From June 2009 to May 2010, oil gained 19% compared to SPX's 27%.  Yet, they both shed roughly 20% in the May - June 2010 correction.

We had another round of QE, which collapsed the dollar and sent stocks up 36% and oil up 70% through May 2011.  This time, SPX corrected 22% and oil 35% (through Oct 2011.)

At that point, CL sold off strongly -- dropping 23% through the end of June.  SPX, however, lagged.  It lost 8%, then promptly regained 90% of it in the next three weeks (compared to CL's 40% retracement.)  When the slide continued, however, SPX caught up -- in spades.

It lost 80% of its gains from June 2010, while CL only lost about half that.  SPX then went on to make three new highs in a row, adding 38% through today's close.

CL managed an 88% retracement of its May-October losses for a 47% gain through Feb 2012, and has made two lower highs (each a 61.8% retracement of the previous high) since then.  Total gain from Oct 2011: 27%.  And, it's been a fairly neutral currency market.

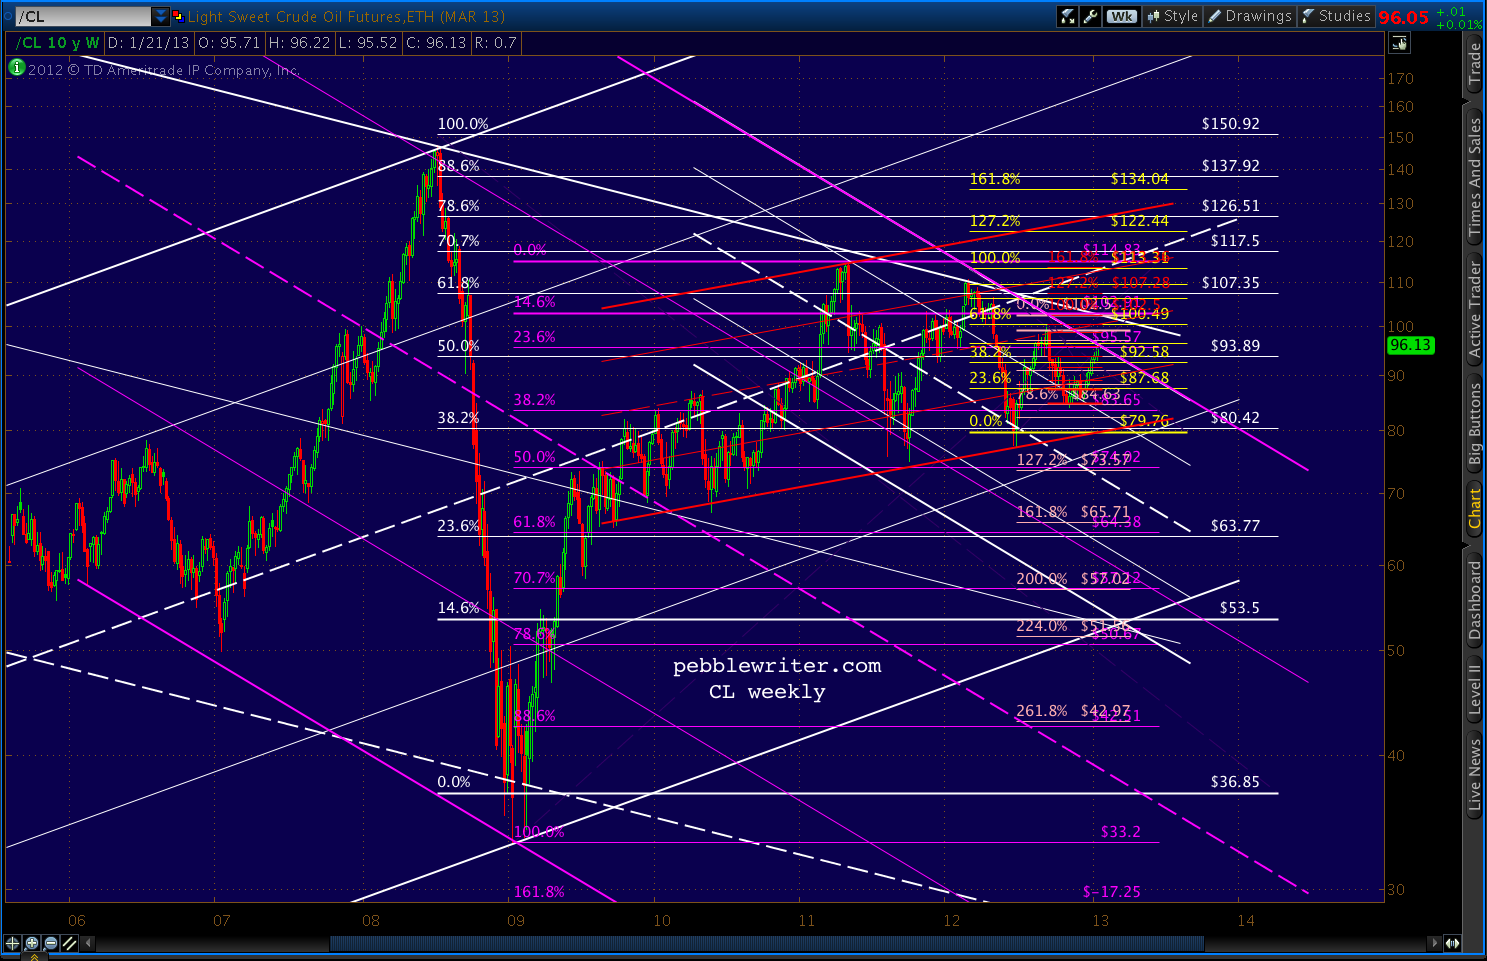
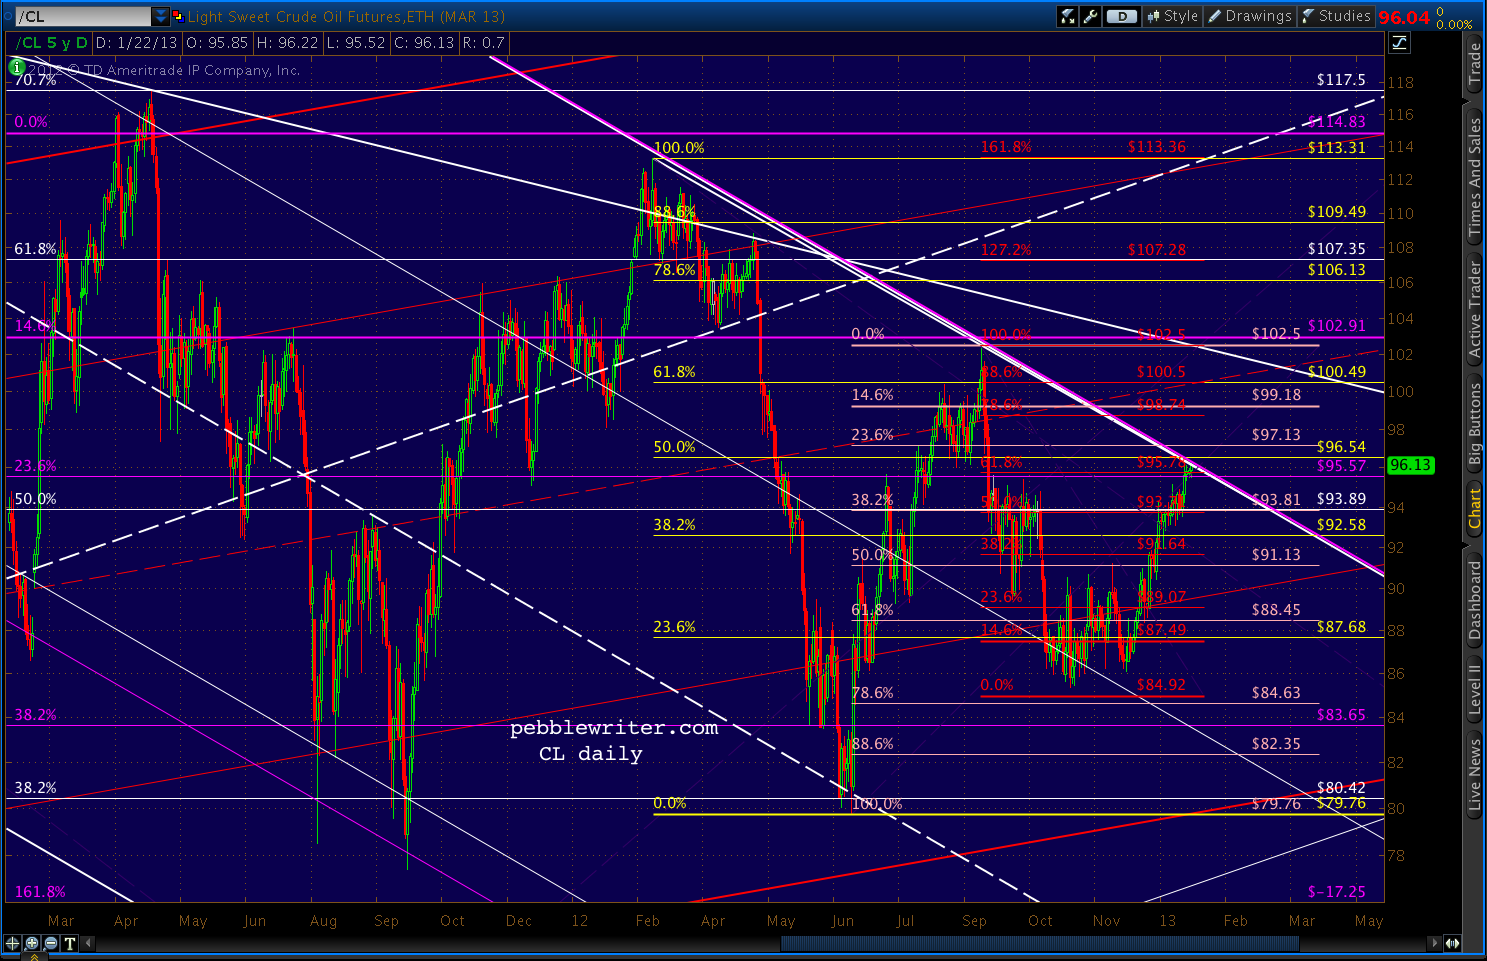
I can't help wondering what the oil and currency markets know that the stock market doesn't.  A look at the CL charts indicates more downside.  Will SPX again play catch-up?

Even ignoring what I suspect about the dollar and equity markets, CL presents a bearish picture.


Whether it breaks down or out, CL is obviously at a turning point.  We'll keep an eye on it...