PEBBLEWRITER.COM IS LIVE!


*************** PEBBLEWRITER.COM IS LIVE! TO SIGN UP, CLICK HERE ***************


Tuesday, August 28, 2012

Lemmings and Us

reposted from pebblewriter.com:

The dollar and the euro each slightly overshot our short-term targets, but are resuming the path we mapped out for them last week.

The EURUSD came very close to a key .886 Fib level, prompting many to wonder "was that it?"  I wasn't so sure, myself.  The resultant sell-off was pretty convincing, taking out the previous low.

It has reversed as we expected it would overnight, and appears to be taking a run at 1.2588.  If it can break that level, it should complete a measure move to the .886 at 1.2617.


The dollar, meanwhile, bounced hard off the channel midline as expected, and has resumed its decline to the 1.272/.5000 at 80.83 - 80.88.


Each of them is at a smaller degree Fib .786 or so, meaning they're due for a pause here.  And, if they can't seal the deal with a higher high (euro) or lower low (DX), then the party's over sooner rather than later.

But, I'm still operating under the assumption that we'll get at least one last push in this corrective wave before things come undone at Jackson Hole.  I have yet to see any serious trial balloons regarding an imminent QE announcement.  While not necessary, I would expect the very political Fed to do so, especially given the diatribe coming out of Tampa this week.

If DX and EURUSD are only in a corrective wave, can SPX break out to new highs as we wondered last week?

continued on pebblewriter.com ...

* * * * * * * *

As we shuffle along towards Jackson Hole, I can't quite get lemmings out of my mind.  Is that a field of clover we're rushing toward, or a cliff?  QE3 is all anyone's talking about this week, but I still can't imagine the Fed playing this important card until it has no other choice.

From a technical standpoint, here are clear paths in either direction.  If they announce QE3, or even hint strongly enough that it's coming, my initial targets are 1433 and 1451 (then 1464 and 1472.).  If not, the market will tumble -- with targets starting at 1380 (then 1350 and 1300).

I focus on the "initial" targets, because much of what happens afterward is also subject to manipulation.  If the news is "bad" and the market sells off, at some point BB will go on the air and explain he was just kidding.  When he does this is anyone's guess, but I would imagine they'd want to keep the rising wedge intact.

If the news is "good", how long will it take for the markets to run out of steam?  There are numerous harmonic targets that we've identified before [link here.]  And, how long until prices at the pump and the grocery store -- already sky high due to the drought and Middle East tensions among other reasons -- begin to alarm consumers?

This morning's consumer confidence report already shows a drop from 65.4 to 50 (versus expectations of 66.)  I guess higher prices is one way to increase spending -- albeit with a rather nasty boomerang effect.  And, if inflation should become apparent, how long until higher interest rates -- the kiss of death to the $16 trillion crap game?

It's perhaps appropriate that the iconic scene of lemmings throwing themselves off a cliff in a suicidal version of follow-the-leader was also manipulated. The makers of the 1958 Disney documentary White Wilderness reportedly flew thousands of lemmings from Hudson Bay to Calgary where they were thrown over the cliff for dramatic effect.

If central bankers do "save" the global economy in the coming weeks by enacting QE3, it will no doubt be heralded by the media as a brave and noble deed.  For anyone with any foresight, however, it's obvious this is just one step closer to the cliff.


* * * * * * * * 

Get the rest of the article as well as live intra-day market commentary at pebblewriter.com...

Thursday, August 23, 2012

Update on Gold

~reposted from pebblewriter.com

On Wednesday, gold reached the 1655 target from our August 15 forecast -- closing at 1656.20.  This represents a probable breach of the descending triangle upper bound as well as a tag of the Fibonacci .886 level of 1655.70 for a proper Bat Pattern completion.


I say "probable" breach, because the last time prices slightly exceeded the upper bound (in late February, by about $12/oz), the breakout stalled and prices fell rapidly.

Given that today's rise came on the heels of Fed minutes that were very suggestive of QE3, this breakout will likely go the distance.  And, the triangle is also almost 70% from inception to apex -- a little past the typical point of break out.  Since it tagged the .886, however, I'd be surprised if it didn't back test the triangle's upper bound (currently around 1640) along the way.

If it's able to maintain upward momentum, look for gold to reach the 1.618 of the current (red) pattern at 1762 to complete a Crab Pattern.  This is also the .886 of the next larger pattern (pink) -- a Bat and the .618 of the drop from the September 2011 high of 1923 and the December 2011 low of 1523.

* * * * * * * *

For outstanding real-time market analysis with intra-day email and text alerts, check out the new pebblewriter.com.

Tuesday, August 7, 2012

Gartley Patterns

The Gartley Pattern offers early warning of potentially significant reversals in price trends.  Like all Harmonic patterns, it is formed by a series of specific Fibonacci reversals of price moves.  It is thought to be successful about 70% of the time -- much better than house odds.  Combined with solid technical analysis and sound trade management technique, it can provide significant returns with limited risk.

It's a rare week that I can't find a decent looking Gartley Pattern setting up.  On November 7, 2011, I saw one forming on SPX and posted about it here.  With SPX at 1261, the Gartley indicated prices would rise to 1276.13 and reverse.  Here's the chart I posted that afternoon; the purple line shows the forecast move.


The following morning, SPX opened at 1261.12, raced up to 1277.55 and closed at 1275.92.  The next day saw a 50-point reversal.  Each $1 invested in at-the-money SPY puts on the afternoon of the 8th was worth $3 the next day on the 9th.  Pretty cool, huh?

Let's take a look at how Gartley Patterns work, using the actual prices from October 27 - November 9, 2011.  I'll use the daily chart from that period to illustrate.


A Gartley begins with a significant directional move.  The origin is labelled X, and the terminus is labelled A.  The size and timing of the original move isn't crucial; I've played some Gartley's that spanned years and others that spanned an hour.

The reversal at Point A establishes the low of the pattern and our first leg, known as XA.  Next comes a move back towards the origin price -- aka a retracement.  In a Gartley Pattern, a retracement always occurs at the Fibonacci 61.8% of the XA leg -- meaning simply that we have recovered 61.8% of the initial price drop.

Note, Point B can be off a little, but a very big miss means it's probably going to be some other kind of pattern -- or none at all.   Here, our Point B came in very, very close to the .618 level: 1263.21 versus the ideal 1263.15.  At this point, we start to wonder if we have a potential Gartley on our hands.

The ideal BC leg will typically range from 23.6 to 88.6% of the AB leg -- although this is the least critical measurement of the entire pattern.  I've seen Gartley's successfully play out with tiny little BC legs, and others that retraced almost the entire AB leg.  Here, we saw a 31.5% retracement.  It's not a Fibonacci number but, again, it's just not that important as long as it looks like a significant reversal.

The next phase of the pattern -- the CD leg -- is the most exciting.  We know, as we pass our previous Point B at the 61.8% level, that the 78.6% level waits up above.  Knowing a reversal is coming, especially when everyone else is getting more and more bullish, is both scary and exciting.

In this case, the ideal Point D was 1276.13.  Again, this represents a 78.6% retracement of the initial price drop from X to A.  We surpassed it just a little, hitting 1277.55.   A little overrun isn't unusual, especially -- as happened here after a 16-point gain -- the market has a head of steam on it.

The next phase is the fun part.  After reaching Point D, a typical Harmonic Pattern reversal is 61.8% of the AD distance.  In this case, that would have been a 39-point drop.  Instead, we had a 81.9% drop the next day for a whopping 50-points (3.9%).   At times, reversals can go beyond Point A for a 1.272, 1.618, etc. extension of the AD distance.  In fact, over the following 11 sessions, SPX fell an additional 64 points for a nearly 200% extension -- a remarkable 5:1 return for those at-the-money puts.

As mentioned earlier, Gartley's don't always work.  So, it's prudent to plan your trades carefully.  Many traders, for instance, will jump in just before a target is hit and place a stop just on the other side of their target.  I have several rules that I typically follow to limit my risk when putting on such a trade. I also look for corroboration from other chart pattern and technical analysis.

The Gartley is just one of several Harmonic patterns I watch for.  Some, such as the Butterfly and the Crab, can result in much larger reversals.  More on each in the coming weeks.

 * * * * * * * * *

On the new pebblewriter.com, I discuss a variety of harmonic patterns -- using actual examples from the past few months.  For a few dollars a day, members are alerted to patterns I see setting up on various indices; often, they are able to anticipate reversals and position themselves for profitable trades.

Today, I posted about SPX -- which just completed a Bat Pattern at 1404.64.  Several other indices are very close to completing Gartleys.   The following require only a very small move:

RUT:         0.27%
COMP:     0.61%
NYA:         0.52%
DX:           0.07%

The odds favor broad reversals across all markets in the next day or two.  For detailed charts and discussion, consider becoming a pebblewriter.com member today.


Thursday, August 2, 2012

Draghi Disappoints

~reposted from pebblewriter.com

This is not the fix the market was hoping for.  This is not a fix at all.  This is Draghi encouraging fellow central bankers to step up to the plate, and telling the world that he still hasn't managed to persuade a majority of them to do so.

"In order to create the fundamental conditions for such risk premia to disappear, policy makers in the eruo area need to push ahead with fiscal consolidation structural reform and European institution-building with great determination  As implementation takes time and financial markets often only adjust once success becomes clearly visible, governments must stand ready to activate the EFSF/ESM in the bond market when exceptional financial market circumstances and risks to financial stability exist - with strict and effective conditionality in line with the established guidelines.
 The adherence of governments to their commitments and the fulfillment by the EFSF/ESM of their role are necessary conditions.  The Governing Council, within its mandate to maintain price stability over the medium term and in observance of its independence in determining monetary policy, may undertake outright open market operations of a size adequate to reach its objective.  In this context, the concerns of private investors about seniority will be addressed.  Furthermore, the Governing Council may consider undertaking further non-standard monetary policy measure according to what is required to repair monetary policy transmission.  Over the coming weeks we will design the appropriate modalities for such policy measures."

This could get ugly.  We remain short since 1387, and very happily so at the moment.


More in a few.


UPDATE:  9:40 AM

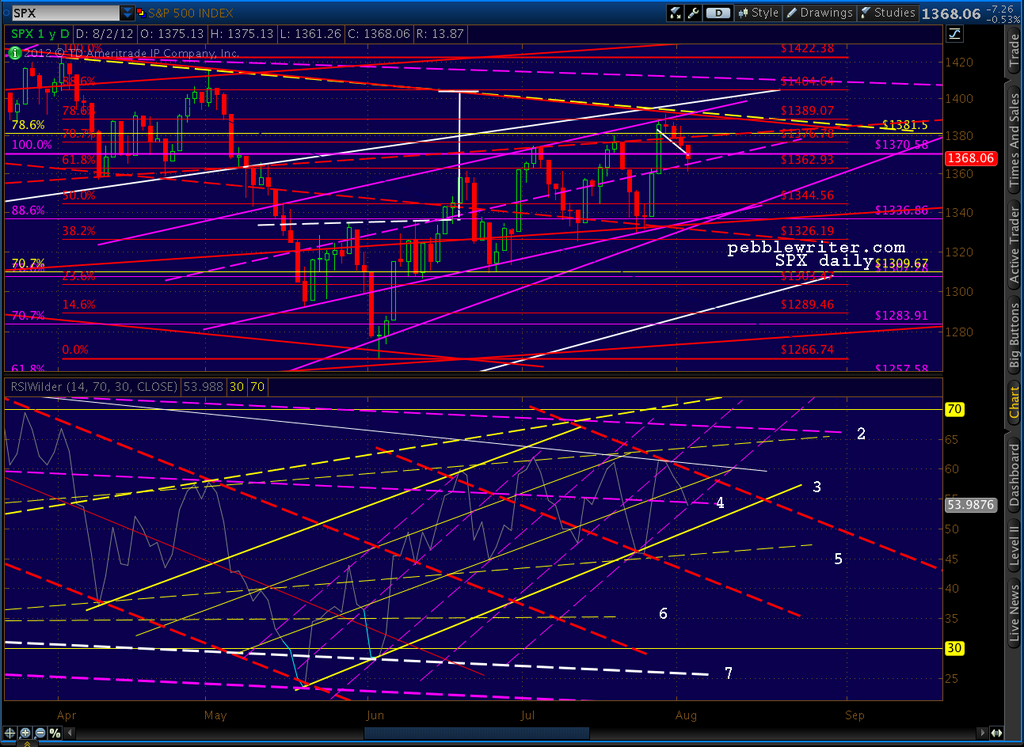
Playing the expected bounce here with some longs at the channel midline/Fib .618 @ 1362.  I suspect the trend is still down, but there should be at least a few points to scalp intra-day.


More in a few.


UPDATE:  10:00 AM

Daily RSI has reached a level of strong support.  It must decide whether it's following the purple channels up or the less steeply sloped yellow channels up.  It's also testing TL # 4.


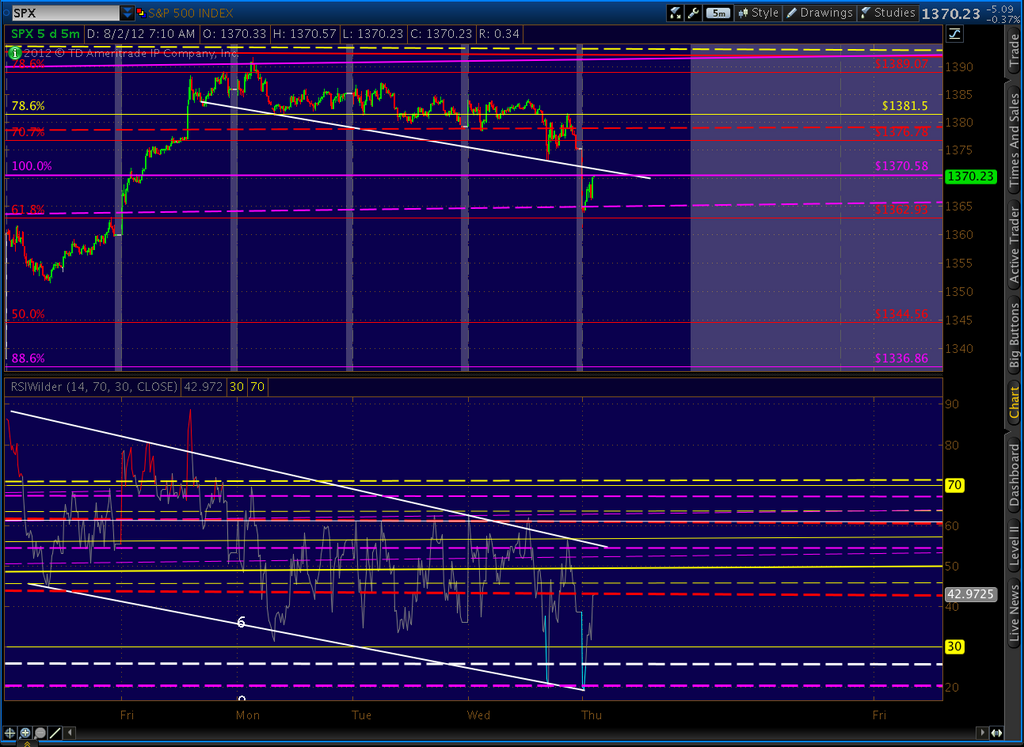
I suspect SPX is going back to test the TL it just broke down from.  The 5 and 15-min RSI look like they're also heading for a target in the 1371 range.  I'll consider going short again if we get there.


UPDATE:  10:30 AM

RSI just about quite there on 5-min chart, will wait to see if there's a reaction before closing longs.


UPDATE:  10:33 AM

That looks like the full move.  Will resume shorts here at 1373 with a stop at 1375.  There appears to be a channel setting up on the 5-min chart that coincides with the RSI channel tag on the upper bound.


Note how each of the previous RSI TL breaks has led to a drop.


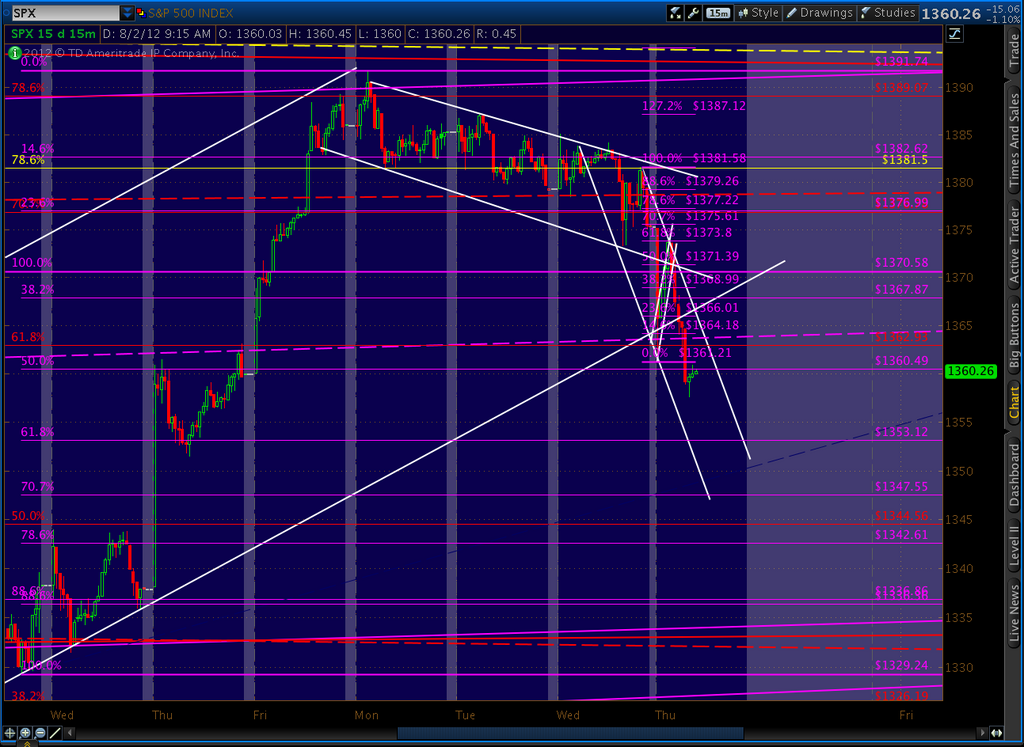
Here's a little clearer picture of what I'm watching.  BTW, the high of just a few minutes ago of 1373.80 is a .618 retracement of drop from yesterday's last significant high of 1381.58 to this morning's low of 1361.26.


UPDATE:  11:30 AM

If SPX can break 1361, it should have plenty of downside to cover.  There's a little channel of sorts on the chart below that might be providing some support here.  And, of course, the bulls are anxious to portray an arrest of this morning's plunge -- along with a higher low to boot.


UPDATE:  12:00 PM

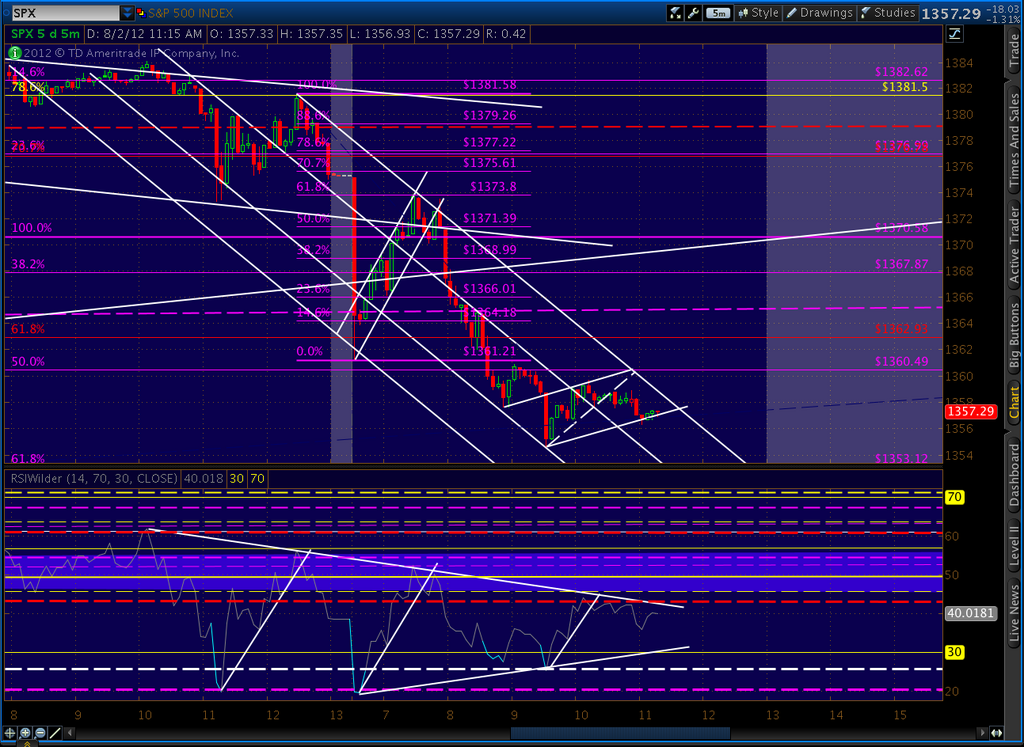
Still holding short from 1373 as sell-off continues.  There is the possibility of a little falling wedge setting up on the 5-min RSI, though it could also broaden into a continuation of the little channel to the downside.


A break out of the little RSI channel and I'll likely switch sides again intra-day for another bounce.  I'll also look to see if SPX can retake its previous low at 1361.21.


UPDATE:  12:12 PM

If we can't retake 1361.21, I'll set my sights on 1353 -- the .618 of the 1329 to 1391 run and well within the bounds of today's declining channel.


The four previous patterns have all played by the harmonic rules fairly well.  Referring to the chart below, Pattern A put in a reversal at the .382 - indicating a probably Bat.  And, in fact, we got a decent bounce at the .886.  before prices dropped another 26 points to retest the previous low.  This pattern was the hinkiest, as there were multiple Point X's that could qualify, but none which presented a better fit to a standard pattern.

Pattern B saw a reversal near the .500 - again indicating a Bat Pattern.  But, then we saw another significant bounce at the .618 -- indicating a possible Gartley too.  As it turned out, the Gartley was the correct call as the decline wrapped up right at the .786.

Pattern C was one of those funky Bats that breaks the rules but works out anyways.  The first real reversal we got was the .786, indicating a probably Butterfly Pattern.  However, the pattern wrapped up at the .886 for an unorthodox Bat.

Pattern D is the current one of course.  The .618 is getting close at 1353.12.  I'll watch for a bounce there, though as the previous patterns have shown there is no guarantee.
The current value of the lower bound I'm using is 1349.

More in a few.


UPDATE:  9:47 AM

Trying to be patient as things unfold.  We've reached another important TL (yellow #3 below) of support on the daily RSI.  This tells me we're very likely to see at least a bounce at the .618.


Weird factoid of the day?  In the face of a 160-pt DJIA decline and a 20-pt SPX delince, VIX is down .05.  Go figure.


UPDATE:  1:12 PM

The 5-min RSI is nearing a solid TL of resistance.  Should the TL hold (and 1361.21 mentioned above) we should be able to make a final push for 1353.


UPDATE:  1:30 PM

Another way of viewing things -- channels in channels.  Looks like a little rising wedge setting up at the moment.  Only another 10 minutes left before 1361 passes out of reach without breaching the channel.  That is, any sideways motion within the little wedge (or a break down) gets us to the far right/upper bound without exceeding 1361 and enable further downside.


UPDATE:  2:20 PM

I'm lowering my mental stop to 1360, the level at which we'd break out of the downward sloping channel.  I would be likely to go long again should we break out.  The current stasis can't last, as we'll hit the channel wall within the next 10 minutes at this pace.

Note that we're hanging just below the RSI trend line, and just above the price channel line (the smallest one, which was previously a rising wedge.)  The most likely outcome is a breakdown of the channel and return to the lower bound of the RSI triangle to set up additional positive divergence.


UPDATE:  3:05 PM

Just broke out of the channel, but not by much yet.  This has the feel of a back-alley job.   So, though I'm now long at 1360, I'll be watching carefully for any signs of a turn -- likely using 1360 as a stop.


UPDATE:  3:50 PM

We're coming up on a channel midline, the .382 of the rebound and the intersection of what looks like a good new channel with a TL -- all in the 1365-1368 range.  Would make a nice place for a turn.
I'll probably cash out for the day and try to figure out the next stage.  NFP is due in the morning, and that might make a difference.


UPDATE:  EOD

If I'm not mistaken, we made 54 points today.  I missed a few by not pulling the trigger at 1354 (in pursuit of a 1353 target) but I can live with that.  To me, the hardest thing about investing has always been letting profits run; but, we got all but 6 of the drop since going short Monday -- and made a bunch more through intra-day trading.

Thanks, everyone, for the nice notes during the day.  And, welcome to today's new members.   It's not always this hectic!   We often go days at a time without trading, let alone multiple position changes during the day.  I certainly hadn't planned on it; it's just what the market threw our direction.

A few of you report that the SAVE37 coupon (annual membership for $500) is still working.  There's some kind of hitch over at PayPal, so if you can get it to work, go for it.  Annual memberships will be $800 as soon as PayPal gets it together.

I'll post more tonight after I've had a chance to catch my breath. 


* * * * * * * *

pebblewriter.com membership info here