PEBBLEWRITER.COM IS LIVE!


*************** PEBBLEWRITER.COM IS LIVE! TO SIGN UP, CLICK HERE ***************


Tuesday, July 31, 2012

The Waiting Game

SPX might be tracing out either a flag or pennant pattern on the 15-min chart.  While either could portend higher prices (2/3 of the time), a flag would definitely mean lower prices first -- probably down into the mid 1370s.


At first blush, the market seems to be respecting the last high of 1380.39 on July 19.  I suppose it makes for a more positive wave structure.

But, I suspect the bigger worry for bulls is the Fib .786 at 1381.50 (in yellow).  This retracement from the 1576 to 666 plunge (Oct 2007 - Mar 2009) was only recently exceeded again; and a real, live bull market shouldn't have any difficulty retaking and defending it. 


...continued on pebblewriter.com...

Monday, July 30, 2012

The Big Picture: July 30, 2012

We've been blessed with a great trader's market the past few months.  Had we simply held our April 2 shorts (at 1422), then covered and gone long on May 23 (at 1298, I was early), we'd be up a respectable 215 points (15%) as of Friday's close.

There's certainly nothing wrong with a 15% return in 4 months. It beats the heck out of a buy and hold strategy which would have left us down 33 points (-0.49%)

By paying attention to harmonics and chart patterns, however, we registered 685 points over the same period for a 49.25% return.

Looking back, our forecast was crazy accurate.  Here's the chart I posted on June 11, a slightly revised version of the June 1 forecast [see: Mixed Signals.]


The forecast line is the solid purple line rising diagonally across the chart in the middle of the red channel.  I was expecting a quick decline from 1335 to 1308, then a rise by July 25 to 1389.  I punted on the likely wave shape, drawing a straight line down the channel midline from June 22 on.

We got the decline the next day (to 1307)... and followed that with a rise to 1389 by July 27 -- only two days later than expected.  Here is the exact same forecast, superimposed on the actual market results.


I'm not aware of anyone who correctly anticipated the wave moves.  Fortunately, I didn't embarrass myself by taking a wild guess.  But, the channel worked very well -- until the July 12 dip necessitated a slightly tamer slope.

Earlier today, a friend recounted his attempts to capitalize on the rise since early June using options.  He had the right direction, the right target and nearly the right timing.  Yet, profits had been elusive.

I attribute the difficulty to the crazy wave structure we've seen since the bottom.  It's been very challenging staying ahead of the daily swings.  Only 3 of the past 38 sessions since June 4 featured daily swings of less than 10 points.  Fourteen had daily swings of 19 points or greater.

So, what's next?

...continued on pebblewriter.com...


* * * * * * * *


NOTICE:  pebblewriter.com recently wrapped 2Q2012 at the top of its class.  Investors who simply bought SPX at called bottoms and sold at called tops would have earned over 37% (about 49% to date since inception on March 22.)  For details and disclosures, click here.

Last week, to celebrate these results, I announced a 37% discount off our new annual rates to the first 37 annual members.  That's an $800 membership for only $500 -- about what you'd pay in 12(b)1 fees for a $10,000 mutual fund investment. 

Looking at it another way, it's about $2 for every day the markets are open -- less than the cost of a latte.  Honestly, how much did the barista's stock tips make you last year?

As of this posting, there are only 4 of these suckers left. Tempus fugit, ya know?  Just enter the discount code SAVE37 when you sign up.  Thanks!


Friday, July 27, 2012

Butterfly in the Making?

ORIGINAL POST:  Still long since 1331.

Because we have so many new members over the past week, I'd like to suggest you check out the post: How to Use Pebblewriter.  It's a good general overview of how my process works.  And, if Butterfly, Bat, Crab and Gartley Patterns sound like gibberish, check out the pages under Harmonics in the Learn tab on the main page.  I will try to update the How to Use Pebblewriter page over the weekend.

There are still a handful of the 37 2nd quarter discounts available.  These are annual memberships for $500, a 37% discount (in celebration of our 37% 2nd quarter results) to the new annual price ($800) which will go through tomorrow.  Details here.

If you've recently signed up for a monthly or quarterly membership, consider upgrading while these are still available.

* * * * * * * *

We just retraced a Fibonacci .786 of the 1380 to 1329 drop from last week.  A pull back at 1369.44 to say, 1348 - 1360, would be helpful in establishing a small Butterfly Pattern (in red, below) to go with our larger Bat/Gartley (in purple.)


A Butterfly would work nicely here, as it completes at either the 1.272 (1394) or the 1.618 (1412) extension -- both in the vicinity of our other targets.  The lower target of 1394 also lines up pretty well with TL 2.

If we don't pause here, look for a reversal at the .886 at 1374.56 in the construction of a Crab Pattern (also completes at the 1.618, or 1412.)

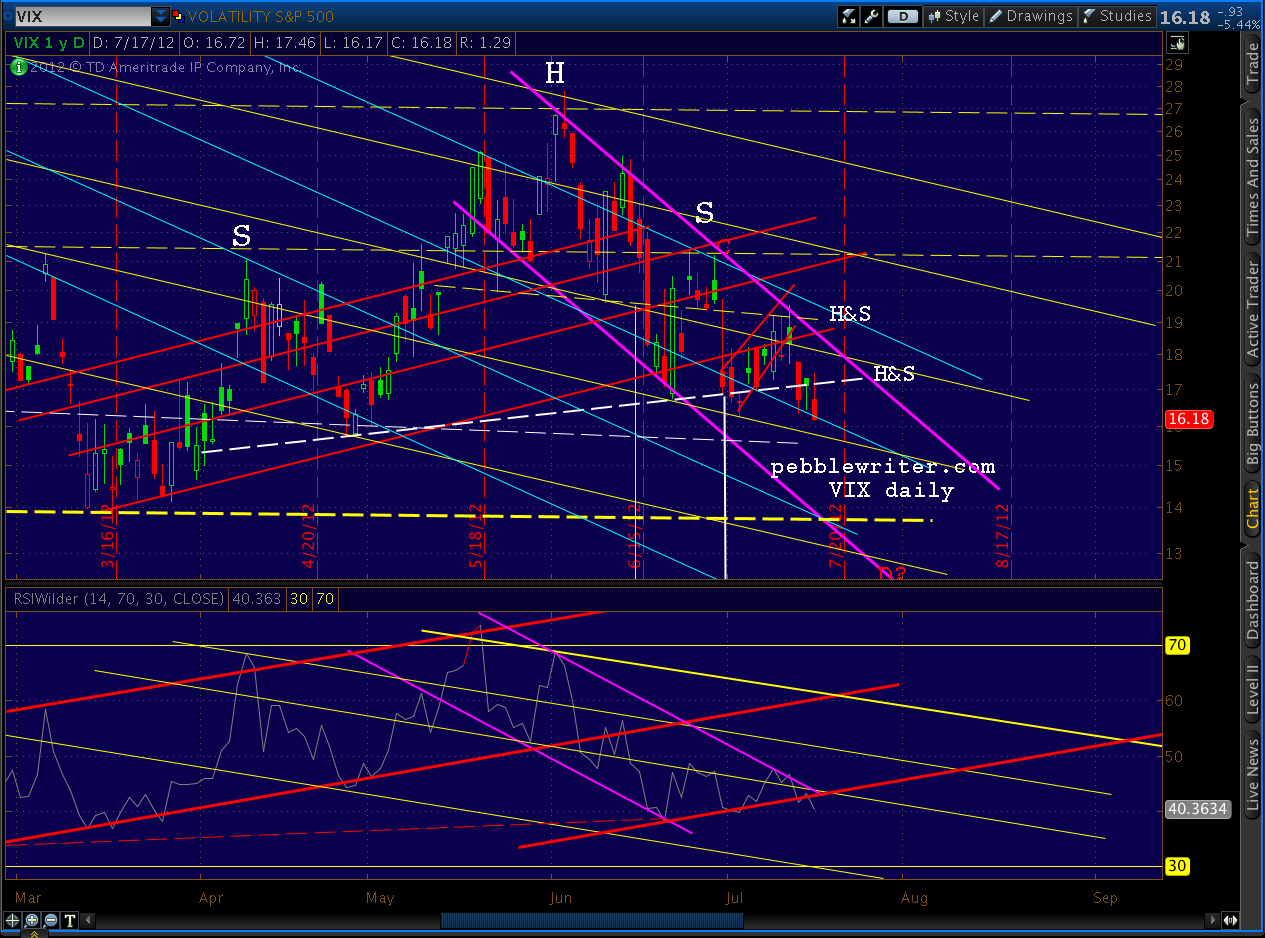
The RSI shows we have a ways to run before running into any serious opposition -- so my money is on the .886.  The intersection of the white TL (3) and the purple dashed line should be our next hurdle -- probably at the .886 or higher.


As always, when the market is ramping strongly, look at the 15 or 30 min charts for how the channels are behaving.


Any deviation from the general uptrend will appear here first.  The harmonic levels clue us in as to the potential turning points.

UPDATE:  11:00 AM

The channel holding nicely as we approach the .886 at 1374.56.  I expect a little pull back here, but keep an eye on the channel just to be on the safe side.


Some strong rallies barely pause, and it's always frustrating to watch the market continue to move after you've pulled out.  An example was the rally between Jun 19 and July 3, which plowed right through all the usual suspects and didn't even take a breath until the previous high.


But, it had already made a strong reversal just shy of the .500 mark, and was working on a Crab Pattern when the channel and TL #1 applied the brakes.

An alternative to anticipating these turns (intra-day anyway) is to continue raising your stops.  Just know that market makers know where your stops are, and love to push the market just enough in each direction to stop out those who aren't watching before letting the market resume its ramp.
More later.


UPDATE:  11:30

We're getting a nice reaction off the .886.  I'm pulling some longs and will try a few shorts here at 1375 -- but will likely go long again immediately if we push through 1376.  I view this as a very short-term trade, and it doesn't affect my view that we're going higher.


But, again, I'm watching the little channels for signs that it isn't working or is developing into something more.  My target on the downside is the .786 at 1369, but it could go further to the .618 at 1360.

DJIA's high for the day is 12,999.75.  How cute is that?  Interestingly, it is bumping up against its channel line on the daily chart.  Can't tell exactly, because there's a little wiggle room in this chart, but there could be some resistance between 13,000 and 13,015.


Re SPX: Since we already had a 10-point reversal at the .618 of this latest pattern, there is no reason to think that we must have a reversal here at the .886.  Bat and Crab Patterns form around .618 Point B's all the time, completing at the .886 and .1.618 respectively.  But, a reversal at the .886 helps create ambiguity -- a hallmark of the recent market action.

More later.


UPDATE:  1:30 PM

DJIA had a nice break out of its channel - very bullish.  Even though it's likely to back test either the channel or at least put in a little reversal at the .786 and the purple channel line, this is positive for equities.


SPX is closing in on its .786 at 1389, which has been the lower end of our target range since early June.  Look for a reaction there.


If we're still going strong, TL 2, the 1.272 of the smaller Crab Pattern and the purple channel are all just above at 1394.

Is it worth going short at these levels?  The daily RSI has slightly exceeded  #3, and will mostly likely close right on it.  A tag of #2 probably means either 1394 or 1404 -- depending on how much of a reaction we get at 1389.


I suspect getting back to #1 will mean a new high such as 1433.  But, again, it depends on how much of a reaction we get at 1389.

German Finance Minister Wolfgang Schaeuble and Wall Street spokesmodel Timothy Geithner are due to meet on the island of Sylt in far northern Germany.  It's somehow appropriate that these two lovebirds will be kanoodling on a remote island of shifting sands as far away from Southern European trouble-makers as possible (without slipping over the border into neighboring Denmark, which has wisely clung to the Krone.

What pillow talk can we expect?  They've already scheduled a press conference, which means it's something good, right?   Or at least we're supposed to perceive whatever they say is positive... like mom and dad explaining how the divorce will be a good thing.

We also have the FOMC meeting coming up next Tuesday and Wednesday.  While it's not inconceivable, this equity rally does make it marginally tougher for them to announce a full-on QE3.  At 1389, we're only 2.3% off the highs of the year and 11.8% off the all-time highs (the Dow, less than 8% off.)

More on this over the weekend...

BTW, congratulations to all of our new members.  If you went long at 1331 this past Tuesday with at least $11,500,  you've earned back your annual membership fee in only 3 days!

If you've followed our lead since the beginning back in March, you're up almost 50% by now.


Thursday, July 26, 2012

Investing & Poker


Our decision to go long again at 1331 is paying some nice dividends, with SPX up over 30 points in the past two days.  If we can hang on through tomorrow, we should be up over 50% since inception (March 22.)


A little reminder...  a few days ago I announced a 37% discount to the first 37 new annual members in celebration of our 2nd quarter results (up 37%!)   If you're already a monthly/quarterly/semi-annual member, we'll just tack it on the end of your current membership. If you're already an annual member, tell a friend and earn 3 free months when they sign up.   There are still 11 spots left, so grab 'em while you can.  This deal ends tomorrow, when new rates are announced.  To sign up, click here.

In my old days on Wall Street, this would be a great time to start indexing.  Institutional asset management is all about beating your benchmarks and quartiles, and every manager I know would absolutely sit on a lead like this and ride out the rest of the year essentially owning the S&P 500.  But, you all know me better than that, right?

I am an ardent believer in the chart patterns, channels, harmonic patterns and technical analysis that have enabled us to capitalize on rather than fall victim to volatility.  It's hard work, for sure.  I start around 5:30 am and often nod off around midnight -- still charting.

But, the results are worth the effort.  We certainly won't be on the right side of every move every time; my goal is to get most of them right by sticking to our proven methodology, and avoid being sucked into positions based on hope or fear.

One of our members (known here as Beach Justice) is a professional poker player;  he recently offered me the following sage advice:
There's a saying in poker: "Don't be results oriented," which simply means that just because your play didn't work out and you lost the hand, that doesn't mean it was wrong, and thus you shouldn't bitch about it.  Profitable situations in poker get annihilated by low-percentage cards all the time, but if the expected value of the play was positive, that's all that matters and the profit will be there over the long run.
Trading the is the same way, just because a particular forecast doesn't work out for whatever reason, it doesn't make the position a bad bet.  If I make 10 trades with an estimated 3:1 risk reward and I get stopped out on all 10 of them, as long as the analysis was good that's fine.
Anyway, as simple as that concept is, I never see traders discuss it and just thought it might be helpful in teaching trading.  We're here to take good gambles (and on pebblewriter.com, learn how to find them) but all a good gamble does is offer an edge, it doesn't guarantee it will pay off every time.
Perhaps a blog about something like this will reinforce to any readers (or haters if you somehow have them), that it won't always work out, and there's nothing wrong with that.  So just a suggestion in case that's helpful.
Thanks, BJ; it's extremely helpful.  Because, I have no interest in sitting on our lead or playing it safe.  God willing, we'll keep doing what we're doing and the results will sort themselves out.

And, thanks to all of you for your emails yesterday.  I will strive to make my posts more succinct for those who want the headlines, and still offer excruciating detail for fellow chart rats.

More charts coming shortly.


Wednesday, July 25, 2012

Does Technical Analysis Work?

Recently, a reader asked if I had an opinion on NFLX.  As someone who wrote Reed Hastings not once, but twice, when he "improved" Netflix, I definitely had an opinion.  But, I set aside my personal feelings and what I knew of the company's financial situation and focused instead on the charts.

The following is an excerpt from a post on July 18, a full week before their earnings were to be announced [see: Baby Steps.]

* * * * * * * *

We turn our attention to NFLX.  The stock rose from 2.40 to over 300 from 2002 to 2011.  Then it fell spectacularly to 60 inside of 10 months.  How do you forecast something like that? Well, as it turns out, NFLX has done an excellent job of obeying its long-term channel lines.


Whenever it fell out of one channel, there was usually another TL exerting influence, such as the parallel lines and the big descending triangle.  But, not every move was well-signaled.

It’s easier now, looking back at the major channels, but in the early days of the top and decline, these channels were in their infancy and not very discernible.


Presently, NFLX is at the intersection of three different channels.  It’s meeting resistance from both the red and purple declining channels that are several years old, while moving upwards through a small bullish channel (also in red.)

In general, I favor older, bigger channels over the little whippersnappers.  In a battle of wills, go with the brute.  And, there’s obviously some consolidation going on right here at the .500 Fib level — not normally a trend stopper.


If I had to guess, I’d say NFLX is going to obey the large red channel and pull back here.  There’s plenty of room to the downside that would require no special magic whatsoever.  It could even stay in the little red channel (keeping the upside alive) and fall as far as 76.

It would make a great place from which to start a fresh drive upwards and potentially out of the bigger channels — perhaps driving toward a Bat pattern completion at the .886 Fib level of 104.  But, if the market falls apart, it would simply continue on down with just about every other stock.

So, if I were inclined to play NFLX, I’d be thinking about a downside bet here -- but would definitely put in a stop just above the previous high of 86.65.  I’d probably take some profits at the bottom of the little channel and let the rest ride — especially if the overall market is melting down — utilizing trailing stops along the way.

* * * * * * * *


Fundamental analysts will attribute NFLX's plunge to a poor earnings report.  But, in actuality, NFLX had already shown its hand via these chart patterns a full week in advance.

Those who read the writing on the wall (or on pebblewriter.com) and bought puts or shorted at 84 made a lot of money.  How do I know?  As one member wrote a few minutes after the announcement:

You, sir, just made me a lot of money!

Anyone with an internet connection can get daily access to pebblewriter.com for the price of a latte.  But, there's a catch.  The deal is only good through Friday, when the celebration is over and higher annual prices kick in.

We're celebrating our 2nd quarter success (+37%) by offering a 37% discount on annual memberships to the next 37 folks who join up.   As of this afternoon, there are only 11 left.  To join up, simply head over to pebblewriter.com and click on the annual membership button.  Be sure to enter the discount code SAVE37 when you join.


p.s.   to anyone else who also made a lot of money on that call and wants to send a thank-you note... just engrave "thanks, pebblewriter!" on the back of a black iPad with retina display and ultrafast 4G LTE, 64GB of memory and wifi/cellular and send it my way

p.p.s.  in case you thought I was kidding...


p.p.p.s.  okay, I didn't actually cancel.  It was an empty threat.  I assumed he wouldn't care one way or the other.  But, I made enough money buying puts to pay for a subscription for many, many years!

p.p.p.p.s.  why in the world are you still reading this drivel?  Go sign up, already!

Tuesday, July 24, 2012

Don't Chase It

Looks like we jumped the gun Friday, getting back in too early after scoring 15 points on the downside.  We have a substantial cushion, being up 626 points/45% since inception on March 22, but I really hate giving any of it back on a off-hours dump like this.

As I posted Friday:
If you didn’t get short ahead of time, the likely downside of this push is the small channel bound at around 1364.  I don’t think it would be worth jumping in at this point.  Of course, if we break 1360, it’s a different story.
Having a stop at 1360 doesn't help much when the market gaps open down 20 points.  So, we'll focus on where we're likely to end up today.


While the upper bound of our rising wedge has been pretty clear, the bottom has so far refused to present a crystal clear picture.  Whether or not to include which tails has left the exact slope muddled, which means it's difficult to anticipate the probable low this morning.
 
But, there is a trend line (yellow, dashed) in the daily RSI that indicates a bottom is already in.


It caught the tumbles on Apr 10 (-28.25), June 11 (-42.25), June 25 (-24), July 12 (-19.75) and is thus skilled at putting a stop to big drops.  It has just been tagged this morning.

On top of that, check out the red channel lines we drew months ago.  If I'm not mistaken, that's a solid tag on the latest of the channel lines that also suggests the bottom is in.


Continued on pebblewriter.com...


* * * * * * * * *

 
The new pebblewriter.com wrapped the 2nd quarter at the top of its class.  Investors who simply bought SPX at called bottoms and sold at called tops would have earned over 37% (about 45% between March 22 inception and July 20.)  For details, click here.


For the price of a daily latte, get unique and insightful analysis like this every day.   Annual membership rates are going up by $100 on July 28.  But, the next 37 new annual members who sign up by midnight July 27 will save 37% off the new rate -- a $300 savings.


Just enter the discount code SAVE37 when you sign up.  Thanks muchly.!


* * * * * * * * * 
update July 23:  only 22 annual memberships with this special discount left!

Sunday, July 22, 2012

Lucky #37

The new pebblewriter.com wrapped the 2nd quarter at the top of its class.  Investors who simply bought SPX at called bottoms and sold at called tops would have earned over 37% (about 45% since inception as of July 20.)  For details, click here.


The first 100 annual members got their membership rate grandfathered for the life of the site.   It was a pretty decent deal (unless I'm hit by a bus tomorrow, in which case we're both screwed.)

So, I wanted to come up with something just as cool to celebrate our über-successful first quarter.   Annual membership rates are going up by $100 on July 28.  But, the next 37 new annual members who sign up by midnight July 27 will save 37% off the new rate.

That's an $800 membership for only $500 -- about what you'd pay in 12b-1 fees on a $10,000 mutual fund, or to pick up one Krispy Kreme on your way to work every morning, or for four tanks of gas for your Escalade.

Seriously, wouldn't you rather spend money on improving your investment IQ than on highly-processed, decomposed organic material that's millions of years old  -- or gas for the Escalade, for that matter.

Just enter the discount code SAVE37 when you sign up.  Thanks muchly.


p.s.  if you're currently a monthly, quarterly or semi-annual member, we'll just tack it on your existing membership.   If you're already an annual member, pass this along to a friend and get three free months when they become an annual member, too.


Tuesday, July 17, 2012

VIX Update: July 17, 2012

Regular readers are well-acquainted with one of the tools we frequently use in forecasting VIX: the channels on its daily RSI chart.  On April 18, with VIX at 18.70, RSI channels helped me forecast a high of 27.13 [see: VIX at a Crossroads.]  VIX reached its yearly high of 27.73 on June 4.

Being able to accurately forecast VIX enabled us to capture most of the downside from 1422 to 1266, and most of the upside since.  On June 2 [see: Channeling VIX] I reiterated VIX's impending high and called for a reversal to 16.84.
An ideal .618 retracement of the difference between A and D indicates a downside of 16.84, realistic if stock market takes off again.
Earlier today, in addition to reaching this target we spelled out six weeks ago, we had an important development that strongly supports our latest equity forecast.


* * * * * * * * *

pebblewriter.com just wrapped 2Q2012 at the top of its class.  Investors who simply bought SPX at called bottoms and sold at called tops would have earned over 37% (now about 43% since inception on March 22.)  For full details and disclosures, click here

The first 100 annual members got their membership rate grandfathered for the life of the site.  To celebrate the success of our last quarter, I'm offering the next 37 annual members something nearly as cool.

Annual memberships rates go up $100 on July 28.  But, the next 37 annual members to sign up by July 27 will save 37% off the new rate.  That's an $800 membership for only $500 -- about what you'd pay in 12b1 fees on a mutual fund for a $10,000 investment. 

Just enter the discount code SAVE37 when you sign up.  Thanks!


Friday, July 13, 2012

Friday the 13th

Going long again at 1327 is paying off nicely [see: Shakeout or Fakeout], with SPX currently trading at 1353.  We had a nice reaction off the Fib .382 at 1326.19 and have obviously broken out of the little red channel that was guiding the downside.


We're well on our way to our target area, and will devote the rest of this post to potential outcomes.

 
...continued at pebblewriter.com...


Tuesday, July 10, 2012

Second Quarter Results

~reposted from pebblewriter.com

We just completed our first calendar quarter on the new pebblewriter.com.  2Q2012 came in at 37.7% -- which would have ranked us #1 among managers if we were an equity mutual fund or (at least, according to one website) a hedge fund.  Now, if we can just repeat that!

Since the March 22 inception of the new site, the numbers are slightly better...

as of July 6, 2012

Inception to date:                  +40.47%
S&P 500:                                - 2.74%
Performance Differential:      +43.21%


Note: see website for the fine print.


Monday, July 9, 2012

Update on EURUSD: July 6, 2012


First, I should make clear that I think the euro zone is toast.  The only thing holding it together right now is Germany’s indecision as to whether it’ll save money in the long run by going its own way.

But, one of these days, investors will turn their attention back to the US dollar.  When that happens, there’s a fair chance that the American problems will be judged to be every bit as serious as the EZ’s.  In the end, it’s a dirty shirt contest and either currency could take first prize — especially if everything starts melting down — stocks, bonds, metals alike.

With that said, let’s look at the charts.  A close-up of the weekly chart shows the potential lifeline offered by the RSI channel.  We’re clinging to the mid line and a TL off the recent RSI lows.


Prices for the pair are clinging to a fan line off the 2008 highs – seen below as a solid yellow line.  This line passes through the .886 Fib line sometime in the next two weeks.  It’s hard to chart precisely, but today’s low of 1.2259 is only a bit higher than the .886 of 1.2225.  There should be a significant reaction at that point.


A reaction up to test the red channel line around 1.28-1.29 would sync up nicely with our current forecast for equities.


This forecast is obviously a very contrarian view.  Just look at the positive divergence on the daily chart.  But, I’m trying as best I can to ignore my bias.

The list of things that can go wrong with the euro dwarfs the list of things that might suddenly go right.  But, gauging from level of negativism out there (including my own!) any seemingly positive development in the next few days could trap an awful lot of bears.  And that, my friends, has been a hallmark of this market ever since last October.

GLTA.

* * * * * * * * 

 Get current forecasts as they're posted on pebblewriter.com.

Thursday, July 5, 2012

The Fork in the Road

reprinted from pebblewriter.com~

We're getting everything we anticipated on Tuesday, with the notable exception of that 1.272 tag at 1378.20 before a reversal to 1363 [see: Going For It.]
"Note that the 1.272 of 1378.20 is very close to the larger (purple) pattern’s .707 of 1376.78 — lending credence to the idea of an interim reversal there.  The likely target is the Fib level around 1363 — the larger pattern’s .618 and our previous high."


We only reached 1374.81 instead of 1378.20. But, as we discussed Tuesday, the close at 1374.02 (on the presumed rising wedge upper bound - purple, dashed line) strengthens the case for the rising wedge pattern.

It's important.  While either the rising wedge or the channel could get us to our price targets, it has huge implications for what happens next.

Rising wedges spell the end of an uptrend.  Channels can go on for a long, long time.  So, which is it?
Note our price target -- the highlighted rectangle that ranges from 1389 to 1404.  The channel can get there quite easily -- as early as Monday or Tuesday of next week.  The rising wedge doesn't reach those prices until the 17th or so.

I suspect the biggest deciding factor will be the upcoming summit of European Finance Ministers on July 9-10.  There are several issues at play.

The recent Spanish bailout announcement boosted markets because, in a nutshell, banks would get up to $100 billion directly (asset purchases) from the ESM.  Importantly, existing debt would not be subordinated to the new debt and the ECB would gain more control over the various sovereign central banks.

Now, with Eurogroup/ECOFIN only a few days away, some serious problems remain with the "solution."  First, the ESM doesn't officially exist yet.  As the effective successor to the ESFS, its existence requires approval by member states representing 90% of the capital base.  So far, Finland, the Netherlands and Slovakia (combined, about 9%) are balking. As long as everyone else is aboard, this should not be an issue.  But, if not...

Second, Germany is balking.  Not Angela Merkel, of course, but seemingly everyone else is dead set against backstopping failing foreign governments and banks.  They are justified, as we discussed at length when Greece was in the cross hairs.  Why should Germany, with a retirement age of 67, put itself on the line for countries whose retirement benefits kick in at age 60?

Pulling out now would be a no-brainer, if not for the fact that so much of the German economy relies on its less fortunate neighbors.  Sales, production, suppliers, investment, etc -- it's a tangled web.  The $64 billion question is whether Germany would suffer more pain/expense from pulling out now or from seeing the whole mess through to the bitter end.

Germany's constitutional court is considering an injunction that would impede ESM ratification.  Oral proceedings are scheduled for July 10.  German Finance Minister Martin Kotthaus has been quoted as saying he doubts whether the troika (EC, ECB and IMF) can approve the ESM by Monday.

Last, even if the ESM survives the various challenges, will it be enough to do the trick?  Nearly 40% of the fund's capital contributions would presumably come from Italy, Spain, Greece, Portugal and Ireland.  Add in France, and the total is closer to 60%.  Can the ESM maintain its value if 40-60% of its guarantors are in or near insolvency?

This situation is very fluid, and has potentially devastating consequences.  I highly recommend staying on top of the steady flow of news from sources such as Zerohedge.

More charts for members will be available in the next hour or so.