PEBBLEWRITER.COM IS LIVE!


*************** PEBBLEWRITER.COM IS LIVE! TO SIGN UP, CLICK HERE ***************


Showing posts with label DX. Show all posts

Tuesday, July 2, 2013

Fireworks Ahead!

NOTE:  Only about half the discounted annual memberships are left.  Many of you have memberships expiring this month.  If you plan on upgrading or extending or haven't completed your order yet, don't forget it's first come-first served. 

The sale will be announced outside the membership tomorrow if any memberships are left at the discounted price.  This will likely be the last sale before the Fund goes live and memberships to the current website will no longer be accepted.  CLICK HERE

Also, I intended to post the May and June performance last night, but ran out of time.  I should get it posted later this afternoon.  Check back HERE.  I have put together a page describing the basic investment philosophy and strategy underlying this site that some might find interesting: HERE


Reposted from pebblewriter.com...

Everything is going according to plan this morning, with all currency pairs approaching their targets from last week.

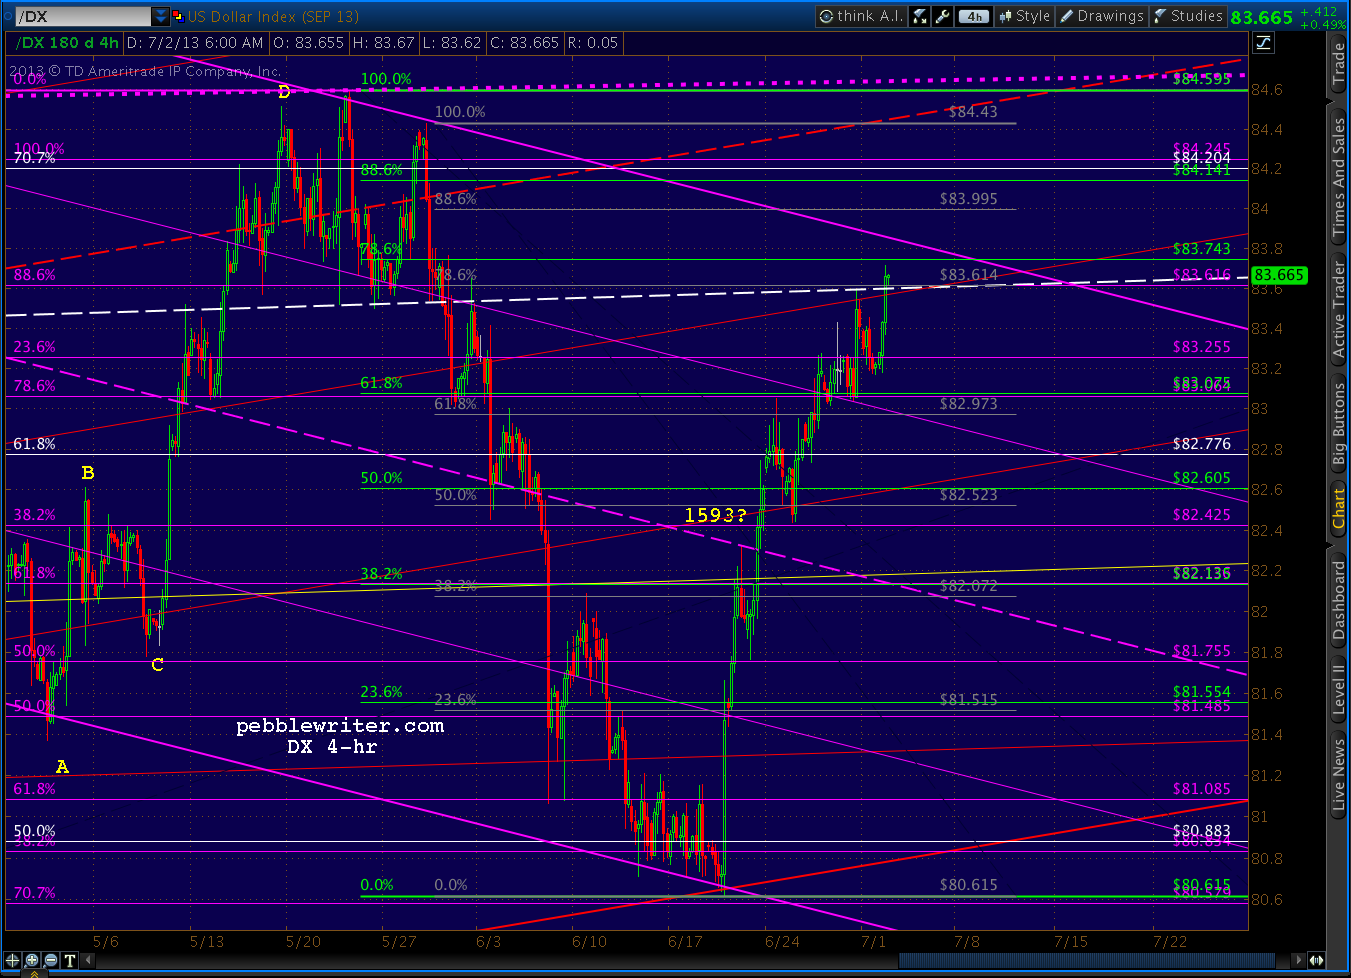
The dollar is back to the white channel midline where exciting things happen.  The last squirt higher led to 84.595 on May 23, the day after SPX topped out at 1687.

This time, however, there's a falling purple channel and the .786 Fib line to consider.
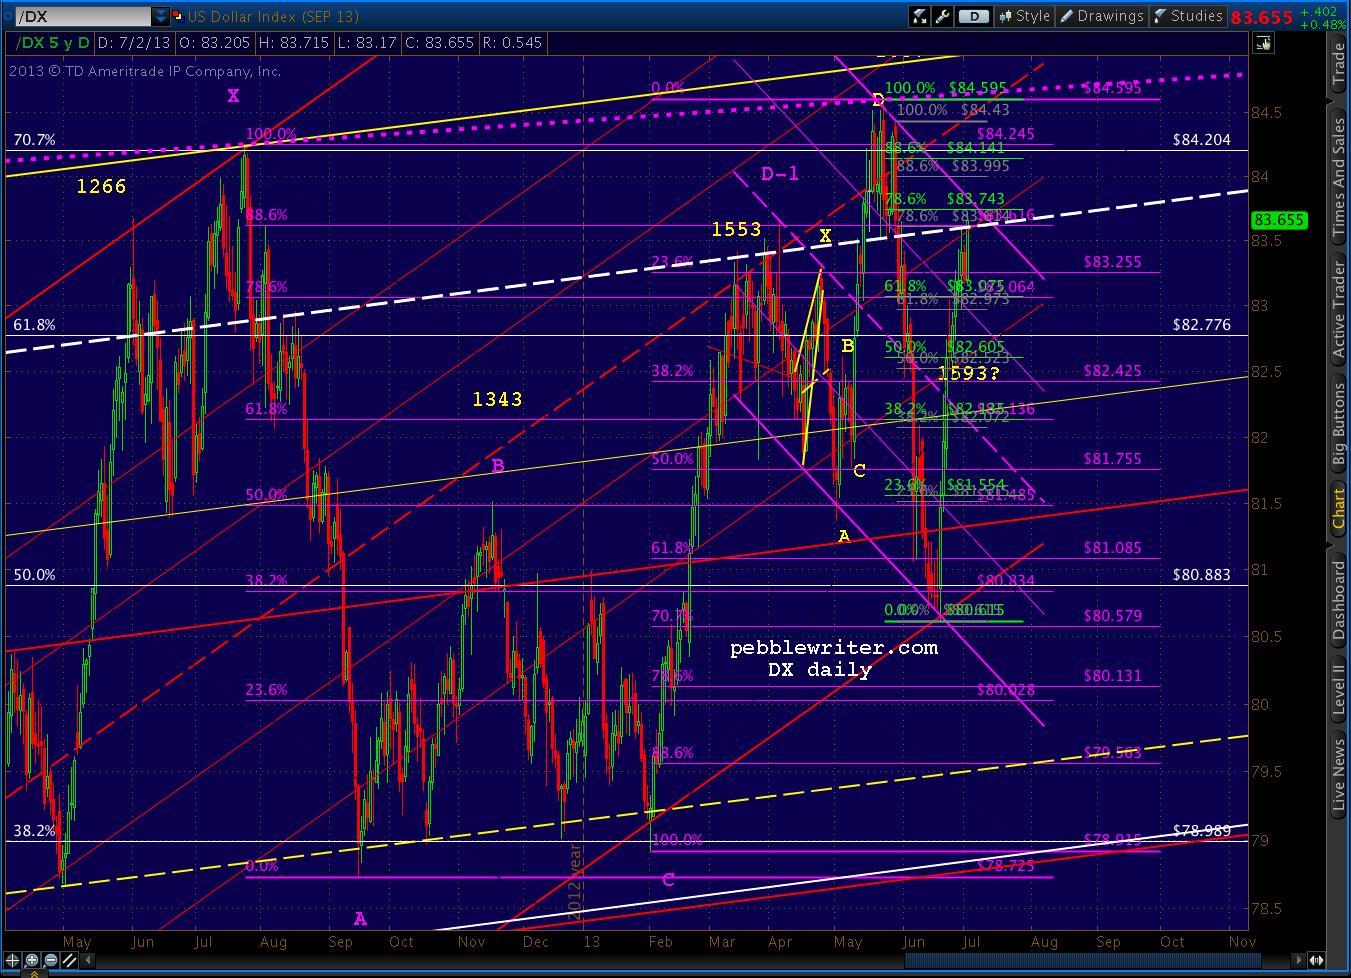


A close up reveals that DX is also pushing up through the red channel .382 line.


While the EURUSD is approaching the .786 retracement of its rally from the 1.2795 low, the red channel midline and the bottom of the light blue channel.


A close up...


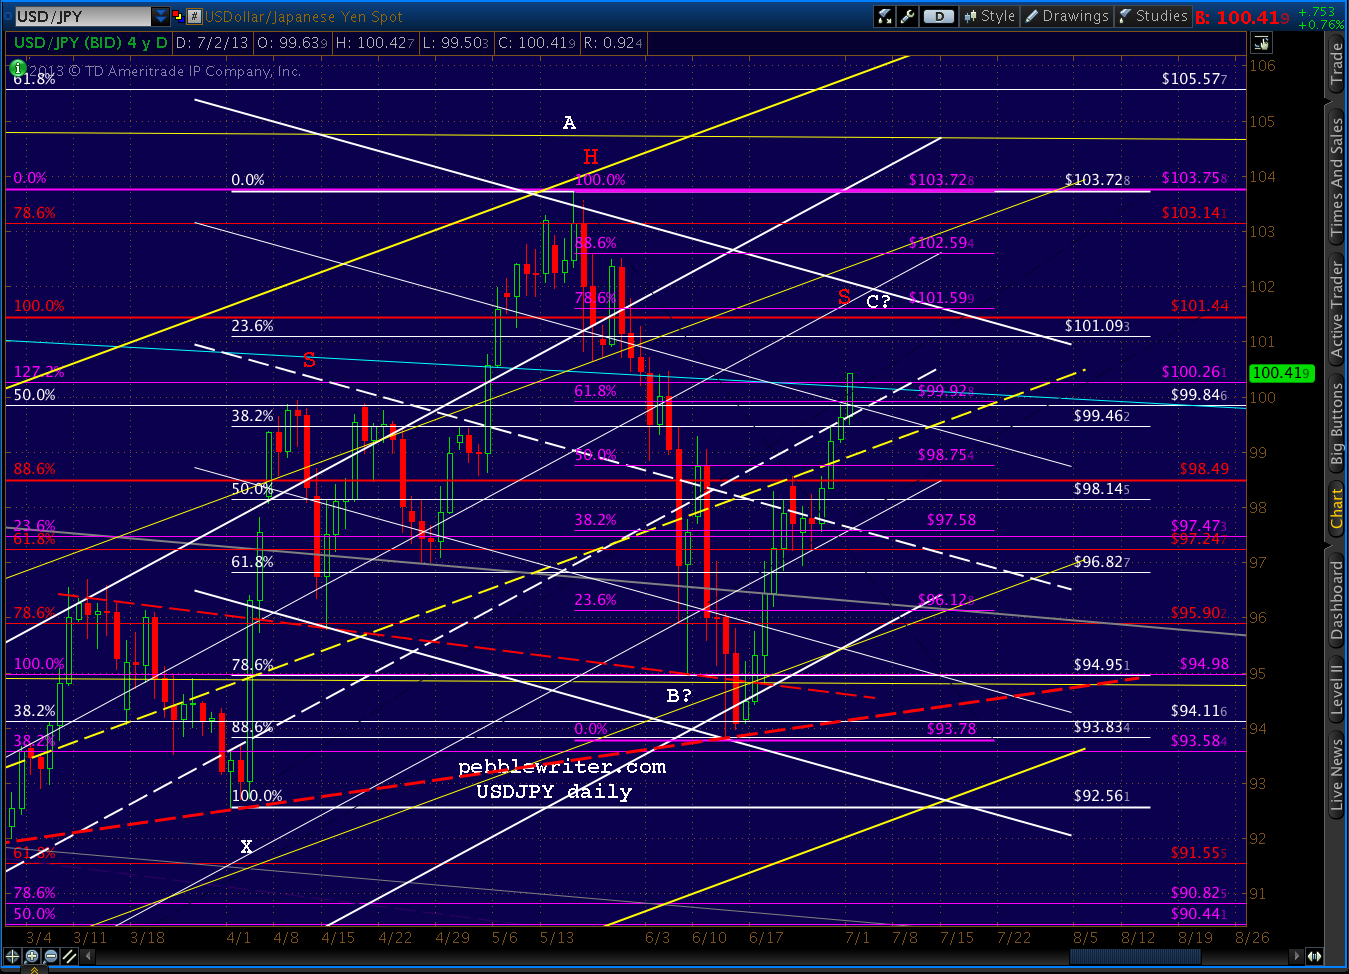
The USDJPY is closing in on our 101.59 target at the .786 Fib.

The e-minis, which back-tested the bottom of their purple channel at the white .500 Fib yesterday, took another run overnight but fell short -- reaching only the top of the falling red channel.


We'll see if SPX has enough juice left to take its own shot.  The first test this morning will be pushing through the top of the red channel -- at least intra-day -- at about 1621.50.

UPDATE:  9:52 AM

SPX reached the red channel and is debating whether to push through or take a breather.
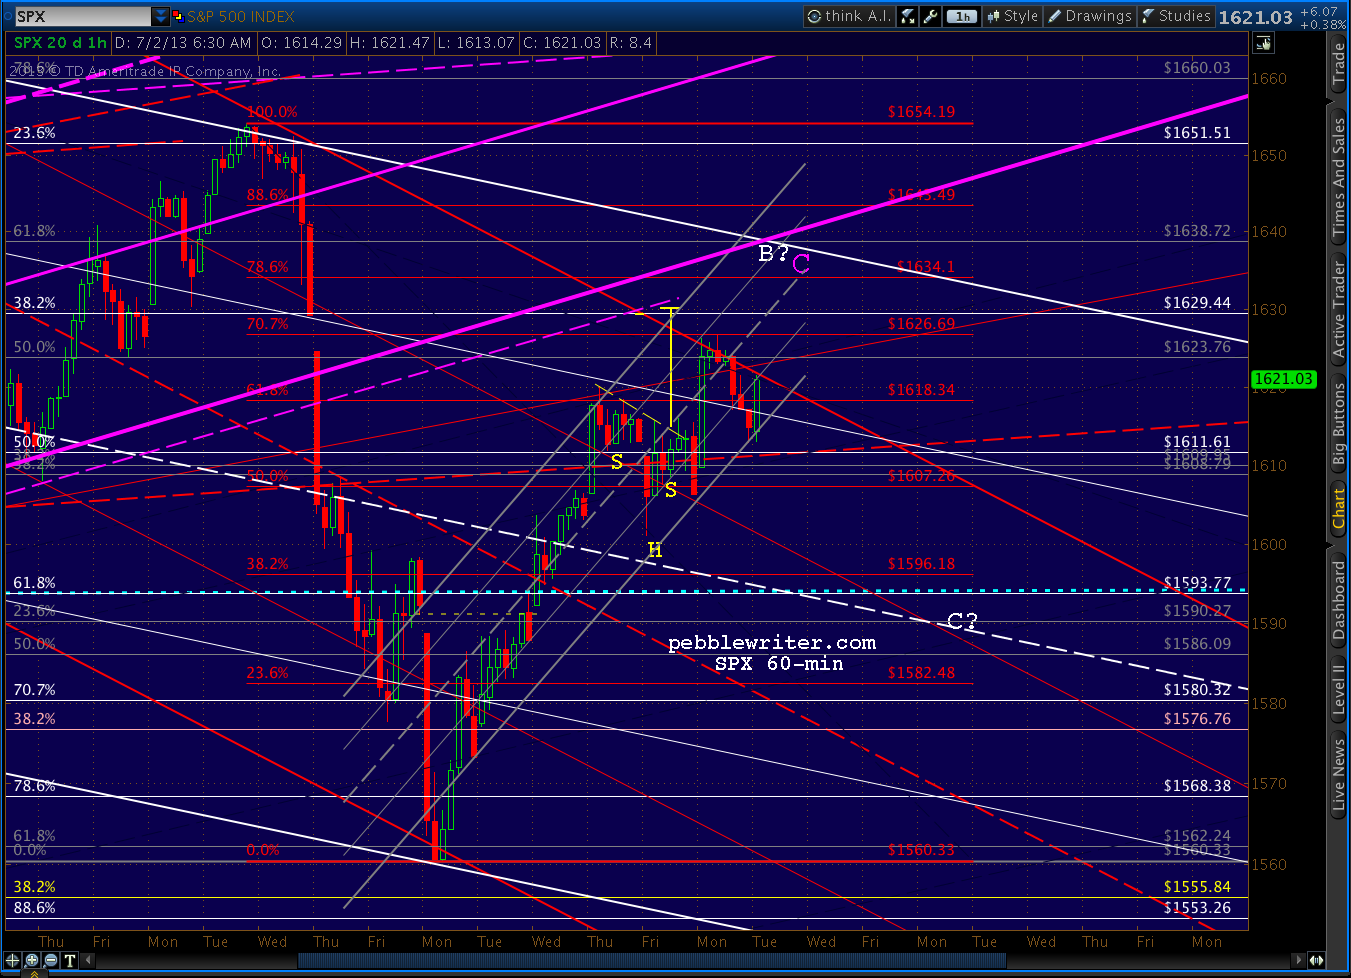

Recall, the cluster of targets we discussed last week includes:
  • the gap fill at 1629.22
  • the IH&S target at 1631.67
  • the red .786 Fib at 1634.10
  • the grey .618 at 1638.72
SPX came within 3 points of filling the gap yesterday, but ran into the same channel top and fell back to close at the bottom of the grey channel in the 5th such stop-clearing exercise in a week and the 9th close at or near the daily low in a fortnight.

It also tagged the .500 grey Fib (of 1687-1560) yesterday, where it (so far) reacted less than it did at the red .618.

So, the red pattern is assumed to be the one in charge, with a Gartley Pattern completion at the red .786 (1634.10) the next major Fib target on the radar.

UPDATE:  10:15 AM

A close up shows two smaller patterns also pointing to the 1631-1635 range if SPX can poke through the red channel top.  Note also the presence of the pink .618 here -- contributing to the pause.


We've had a few pieces of economic news this morning.  First, the Fed is set to vote on Basel III this morning.  While significantly watered down, it could still be construed as a speed bump on the road to global financial domination.

Also, Census released the factory orders survey for May. The managed (a.k.a. seasonally adjusted) version came in slightly higher than expected, at +2.1% versus 2.0% consensus and 1.3% for April.


There is bound to be some concern that the slight beat undermines support for QE (does anything else matter?)

This explains why the less-managed, de-emphasized, and not seasonally adjusted number, at +5.4% month-over-month, is the better number for a change.  Remember the good old days when they massaged the numbers to make things look better?

Monday, May 20, 2013

Charts I'm Watching: May 20, 2013

Pebblewriter.com is being transferred from GoDaddy to Hostgator.  But, it takes a couple of days for the content to propagate to various servers around the world.  So, some of you in Asia, parts of Europe, the Caribbean, India and the Middle East are not able to see posts made over the past 24-48 hours.

For the next couple of days, I will update this site alongside the pebblewriter.com site so you're not left out in the cold.  I will also repost a couple of recent posts that were lost during the transition.

Please note that the address of the site has changed slightly:  http://pebblewriter rather than https://pebblewriter.com (the "s" which signifies SSL is no longer necessary, as membership payments are now processed directly by PayPal.)  

If you get an error message when accessing the site, simply go to the address bar and remove the "s" and then refresh the page.  While you're at it, this would be a great time to edit your bookmarks, etc. 

You might notice that once the few remaining bugs are ironed out, the site will run much faster and more reliably.  Disqus doesn't play well with SSL, so comments will now be easier to make, append and edit.

 I have already been impressed with Hostgator's excellent customer service. The propagation hit my server about 10 minutes prior to the opening bell this morning.   My email and a couple of administrative pages weren't working properly.  I called the 800 number and got right through.  Ten minutes later, everything was good to go.


*   *   *   *
~reposted from pebblewriter.com:

Nothing much has changed since Friday's close.  There's a slight negative bias, which could be nothing more than consolidation after Friday's rally.  We'll play along on the downside, with the understanding that 1673 is still on the table.  In other words... tight stops.


Price has been on a tear, but the underpinnings of the rally have been fading the past several days -- as seen on the 60-min RSI chart.


We went to cash at the close Friday because of the conflict between short-term and long-term patterns such as are displayed in the currencies.  The euro and dollar have hit short-term targets, but have more room to go before the tide turns.

UPDATE:  10:10 AM

SPX just pushed above 1667.  I'm going to switch to the long side with stops at 1667 in the expectation that it's headed to 1673.

Note that we're currently above the yellow TL connecting the 1994 and 2002 lows, and at 1667.50 have pushed above the top of the purple channel itself.


As I mentioned earlier, this might be nothing more than an intra-day move. But, we can't ignore the possibility of a breakout here.  It's visible on both the short-term and longer-term RSI charts -- the action immediately ahead of us will determine which it is.


The most logical move, given the degree to which we're overbought, would be a reversal off the channel tops.  But, we'll see...

UPDATE:  12:47 PM

SPX got within .16 of our 1673 target and is rolling over.  Watch for the latest even-more-steeply sloped channel (white) to catch it around 1669-1670.  A drop back through the top of the purple channel would argue for 1663 (yellow dashed TL) for starters, maybe lower.

I'll likely take a crack at an interim short position with any push through 1669.60.


UPDATE:  12:56 PM

Here we go... interim short here at 1669.60.


Totally jumped the gun on that one.  Stopped out with a bounce at the top of the purple channel.  Should have been more like 1669.  Too bad, because the dollar's confirming a drop here -- as is SPX RSI.

I'll just wait for a push through 1669 itself.


To give you an idea of how silly this has become, the little white channel slopes up through the red channel which slopes up through (and has, for the moment at least, departed) the purple channel.
This is, by definition, exponential: increasing at an increasing rate.

UPDATE:  1:19 PM


Just got the break.  Full short here at 1669.  Charts in a few...


For the bears, a move back through 1663 is necessary to generate any real downside potential.  Otherwise, this could be viewed as a backtest of the yellow TL.

As always, watch for the back test of the broken channel/TL -- in this case, stops around 1670.50 should be safe.


UPDATE:  2:40 PM


Got very close to the yellow TL and bounced.  It's not clear yet whether that was the extent of it.  But, I'd expect SPX to at least tag the red channel midline -- currently at 1663.75.


UPDATE:  3:55 PM

Holding short into the close.  The dollar and euro appear very ready to reverse, and SPX is still back below the purple channel top, meaning a reversion to the midline is the most likely scenario.

There is a good possibility that DX will sell off a little more first -- say 83.609.  But, that could easily happen overnight.  If not, look for SPX to retrace to 1670-1672 before any additional downside.  In other words, a potential gap and crap on the opening bell.


GLTA.

Wednesday, April 24, 2013

Chart Patterns and You

ORIGINAL POST:  9:15 AM EST

Last night, the dollar tagged the .786 Fib retracement of its decline from Apr 4.  It subsequently sold off almost to the .618 but, so far, is hanging in a rising wedge.


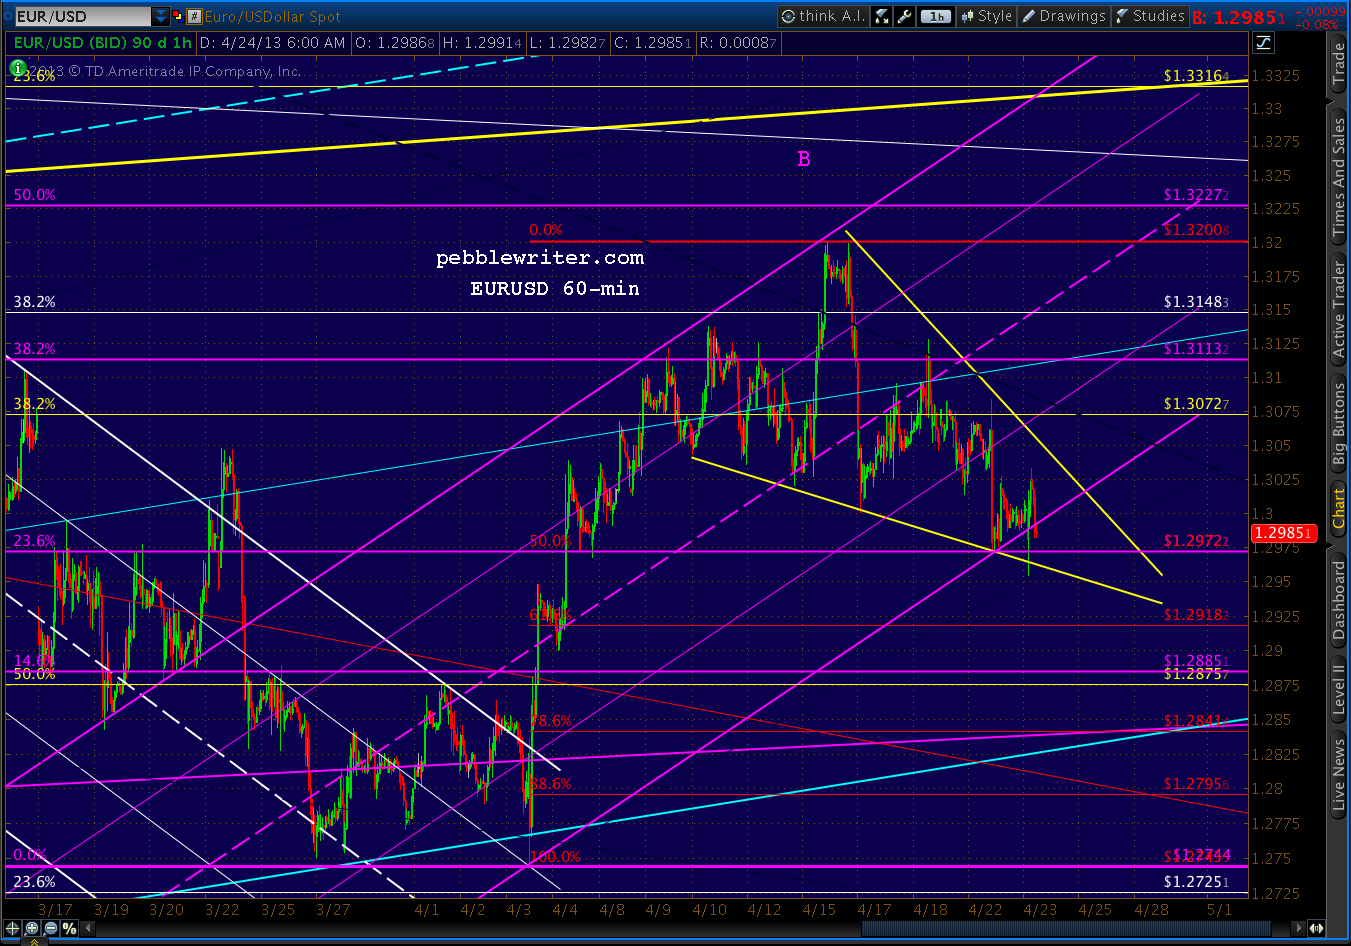
The EURUSD re-tested the .500 Fib of its rise from Apr 3, and snapped back into its falling wedge and the (purple) channel that's guided prices since then.


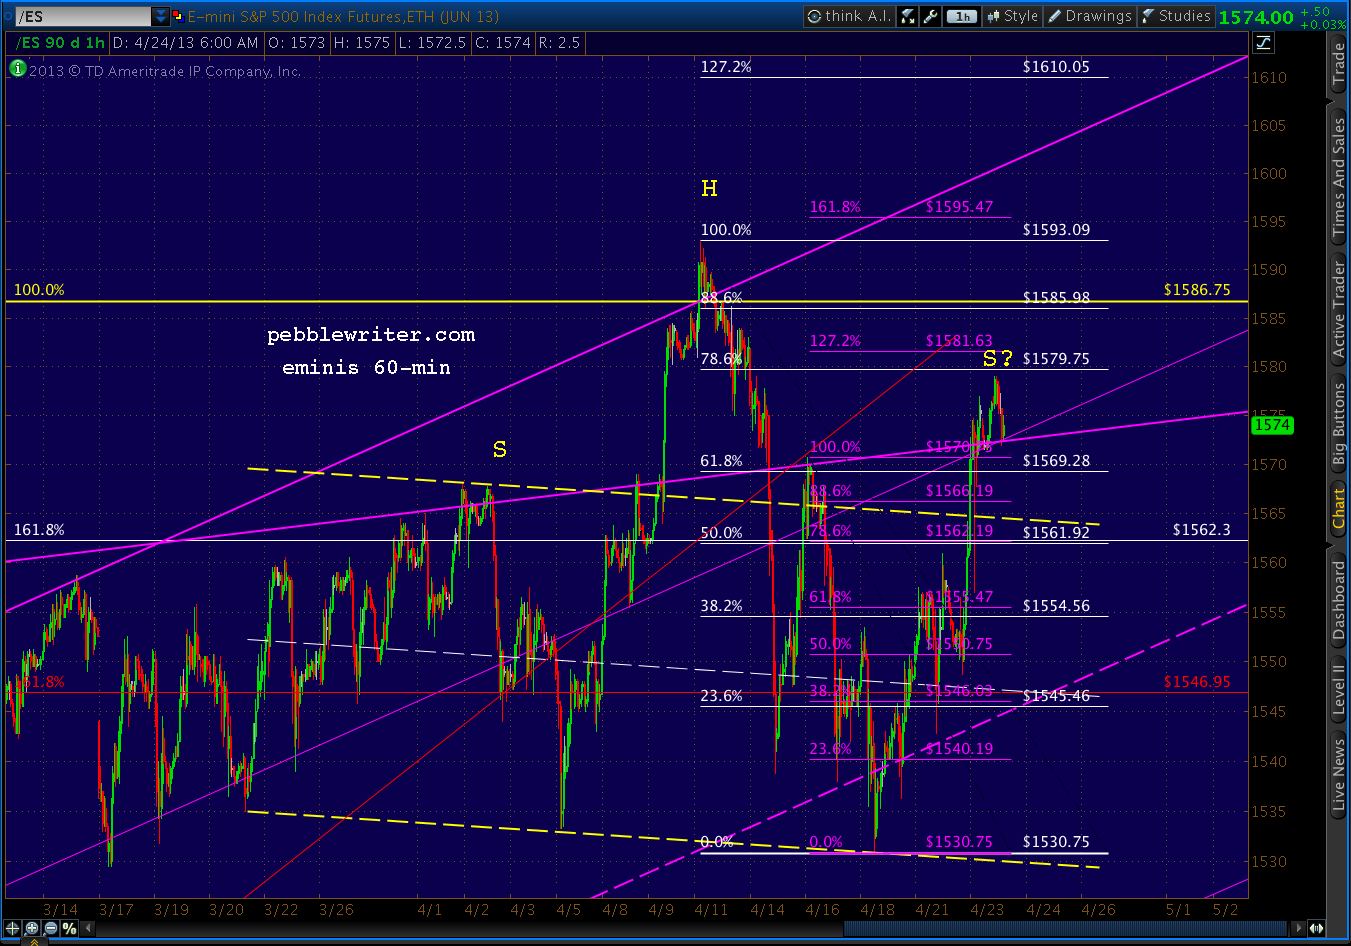
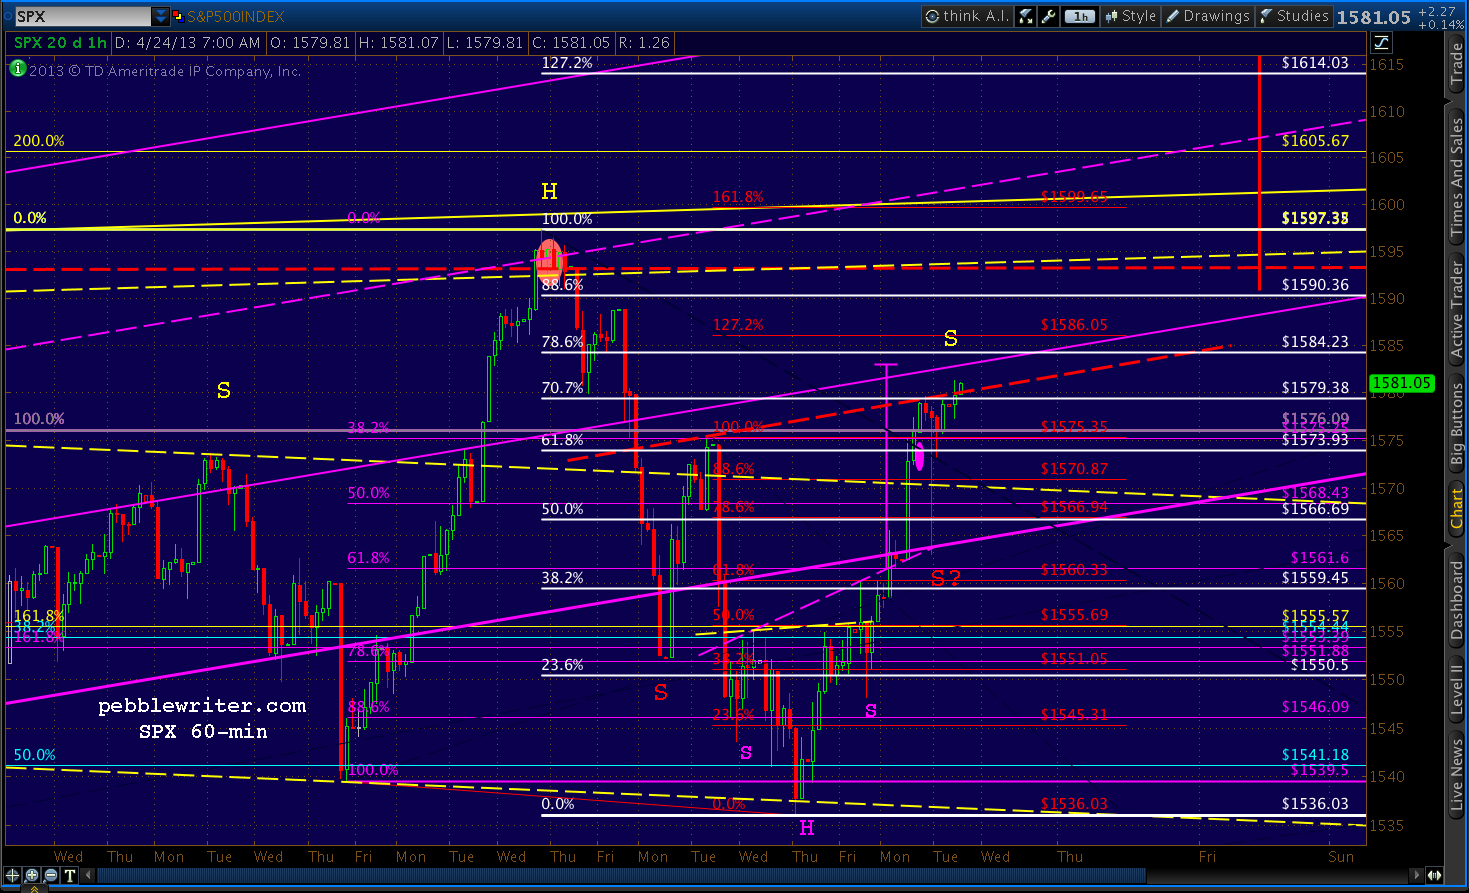
The e-minis tacked on a few points overnight -- almost reaching the .786, only to give them all back with this morning's underwhelming Durable Goods report.  The Head & Shoulders Pattern that was looking pretty good at yesterday's open is now looking a little iffy, with a right shoulder that's already 15 points higher than the left.


UPDATE:  9:45 AM

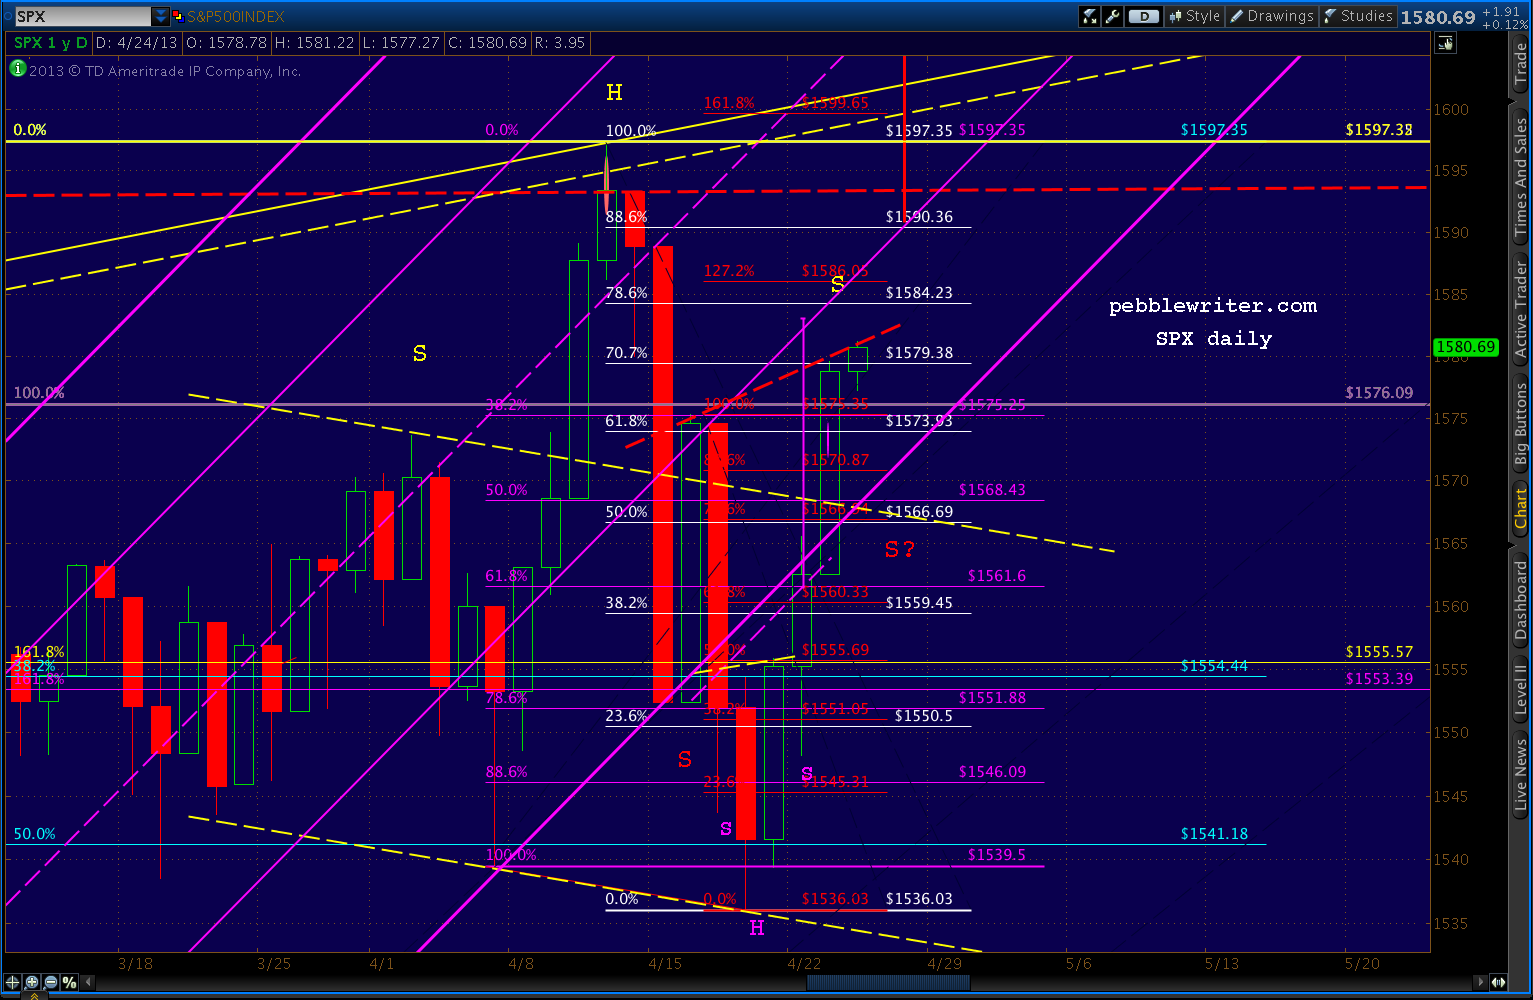
SPX continues trudging toward the .786 retracement (1584.23) of its decline from 1597 to 1536.


After plunging beneath the channel that's guided it from 1343 to 1597 on Apr 17, SPX rallied and re-joined the channel yesterday.  This was a very bullish development, as long as SPX remained in the channel all the way to the closing bell.

Despite a five minute thrill ride from 1578 to 1563 (the channel bottom) and back, SPX managed to regain and hold the 2007 high of 1576.09 into the close.

It now sits perched on the neckline of an Inverted H&S Pattern which has either completed or not, depending on whether a 5-minute plunge qualifies as a shoulder.  Short answer -- I have no clue.


Here's what we do know:
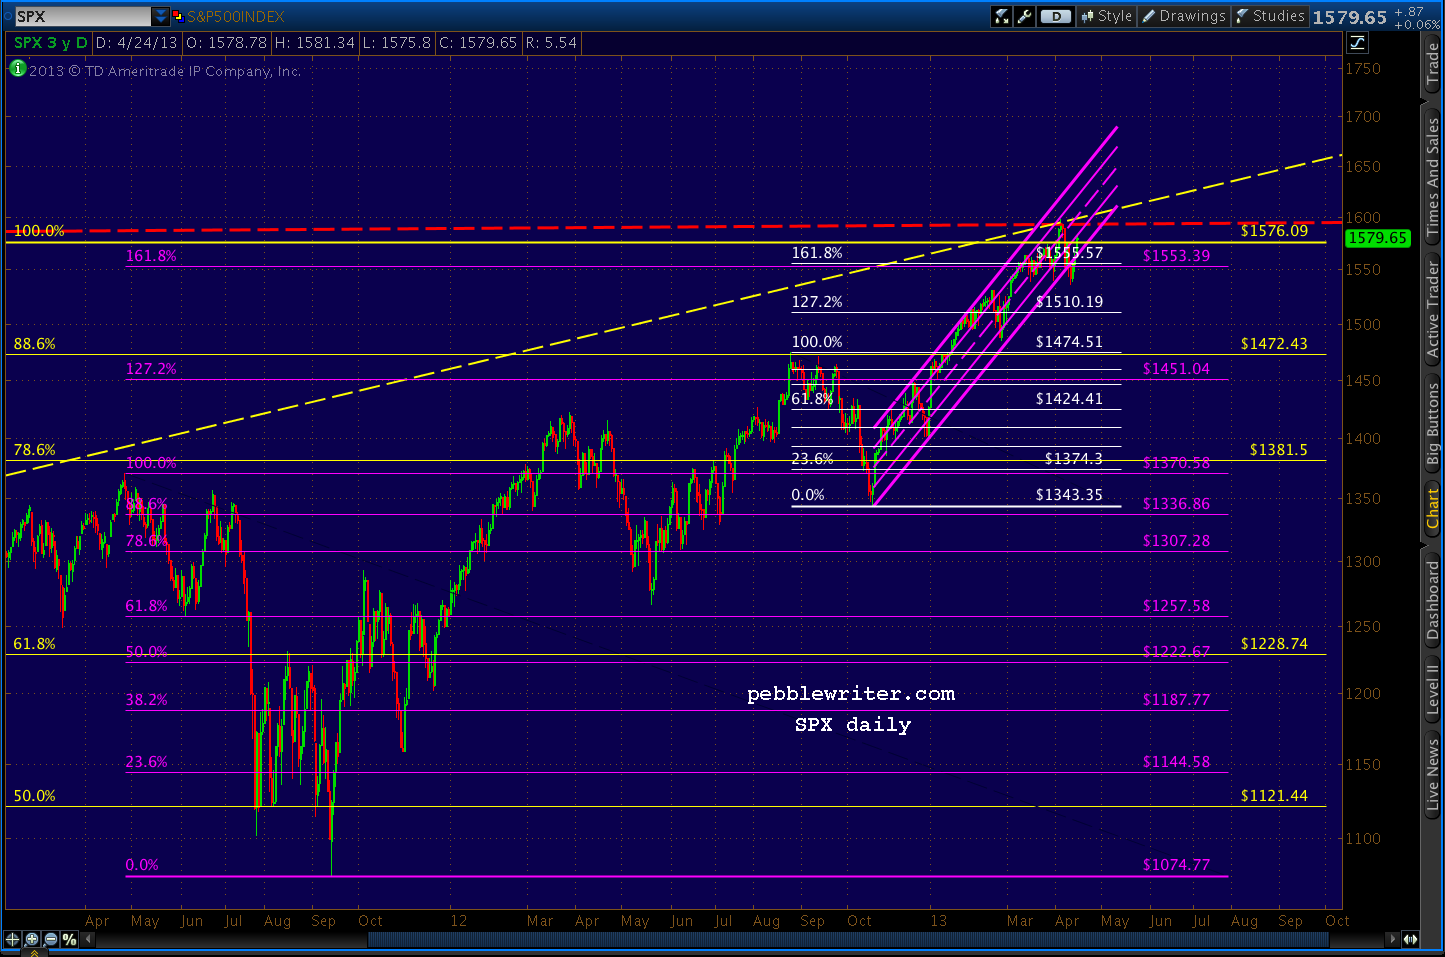
  1. Prior to Apr 17, SPX had been locked into that purple channel below since 1343 on Nov 16 -- an 18.9% gain in five months
  2. SPX barely paused when it completed two big Crab Patterns -- the 1.618 extensions of the 1370-1074 decline and the 1474-1343 decline (purple and white below)
  3. Instead, SPX exceeded the Oct 2007 high of 1576.09 (yellow)
  4. SPX reversed at 1597.35, almost precisely at a trend line drawn between the 2000 and 2007 highs
  5. SPX fell 3.8%, making a lower low, dropping out of the channel mentioned above and suggesting a H&S pattern that targets 1474 -- the Sep 2012 high (white pattern)
  6. It roared back into the channel, retracing almost 78.6% of its drop
  7. In the process, it topped the 1576.09 high and the 1553 and 1555 Fib levels and almost reaching the 1583 target of an IH&S Pattern
  8. Depending on your interpretation, it might also have completed an IH&S that targets 1621.


What Does It All Mean?

When I forecast markets, I look for lines in the sand.  I try to determine price levels that, if crossed, would signal a change in trend.  When that trend switches from bullish to bearish, I want to be short.  When it switches from bearish to bullish, I want to be long.

A channel is one such method that features boundaries rather than absolute price levels.
As long as prices remain in a rising (or falling) channel, we can expect prices to continue to rise (or fall.)  It's rather simplistic, but it usually works.  We can make educated guesses as to future price targets based on where the channels point.

Of course, even well-formed channels (multiple tags on the top and bottom and over a sufficient time period) can't go on forever.  I look for moments when prices must choose whether to remain in or leave the channel.  A tag of a top or bottom bound or midline usually create opportunities, though other lines can as well.

The Real World

Recall that we shorted SPX at the 1597 high on the 11th [see: Big Picture], riding down to the channel bottom where I went long at 1554, expecting at least a bounce.  We got one on the 16th with SPX rallying up to 1575 -- the channel .25 line.

We closed our long position, going short the following morning for the trip back to the channel bottom at 1555.  We tried another long position there, but were quickly stopped out as the channel was broken -- signalling a bearish trend change.

So, we shorted again, playing quite a few bounces down to 1540 where we eventually went long in anticipation of establishing a H&S Pattern neckline [see: Dollar Daze.]

At that point, I expected a back-test of the broken channel.  We got it, reaching 1565 on the 22nd but closing beneath the channel's lower bound.  Note that this move completed 5/6 of a H&S, but the right shoulder was underdeveloped relative to the left.

Anticipating an intra-day retracement to 1567 (the .500 Fib) or 1574 (the .618) the next day (yesterday), I stayed long -- trying without much success to anticipate the top.  Since SPX topped the .618, the next up on the chart is today's target: the .786 at 1584.23.

Going Forward

With all that as preamble, here's what I expect going forward.

...continued on pebblewriter.com...

Thursday, March 21, 2013

Charts I'm Watching: Mar 20, 2013

~reposted from pebblewriter.com:

9:00 AM EDT

The ECB's vow to do "whatever it takes"apparently translates into strong-arming the Russians into bailing out Cyprus.  Still no break out on the EURUSD, though.


It makes sense to play along with the upside on SPX, but keep stops close.  Not sure whether this rally will have legs.  The dollar looks like it's finding support here.


UPDATE:  09:33 AM

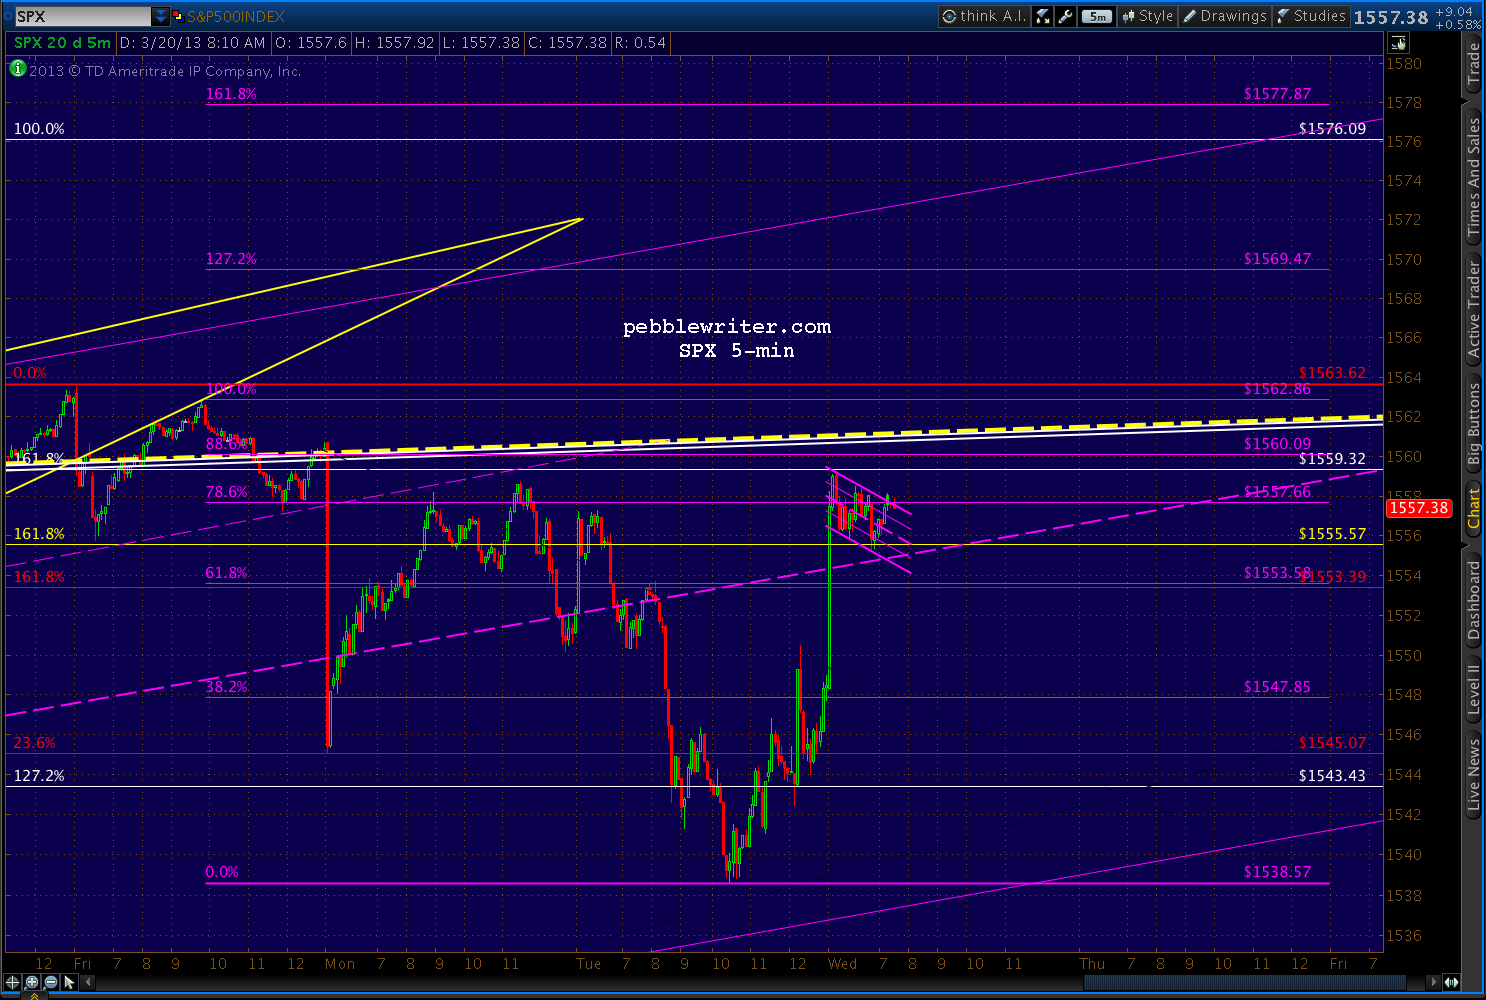
Just reached the .786 of the move down from 1563.62 (purple) and the .886 of our proposed path to 1576 (white.)  Full short again, stops at 1561ish.  Revised charts in a few...


UPDATE:  09:55 AM

The daily chart tells the story.  The most prominent features include:
  • large 1474-1343 Crab Pattern completion at 1555.57 (yellow)
  • large 1370-1074 Crab Pattern completion at 1553.39 (red)
  • small 1530-1485 Crab Pattern completion at 1559.32 (white)
  • small broken rising wedge -- at 1563 top
  • long-term TL and channel top (white) at 1560


UPDATE:  11:10 AM

SPX continues to position itself for a run at 1576.  The 5-min chart shows a small potential Crab Pattern with a 1.618 at 1577 and a Flag Pattern targeting 1576.

It has broken back above and backtested the purple channel midline and retraced nearly .886 of its drop from 1562 and a little more than .786 of the drop from 1563.62.


While it's positioned for 1576, there is no more certainty than when we first broke 1555 on the Mar 14 overnight ramp job.  The large, bearish patterns listed above have still not produced the kind of sell-off they normally do.

And, it's all because of the Fed's media's cheerleaders' TPTB's determination to be able to tout a swell new all-time high for the S&P 500.

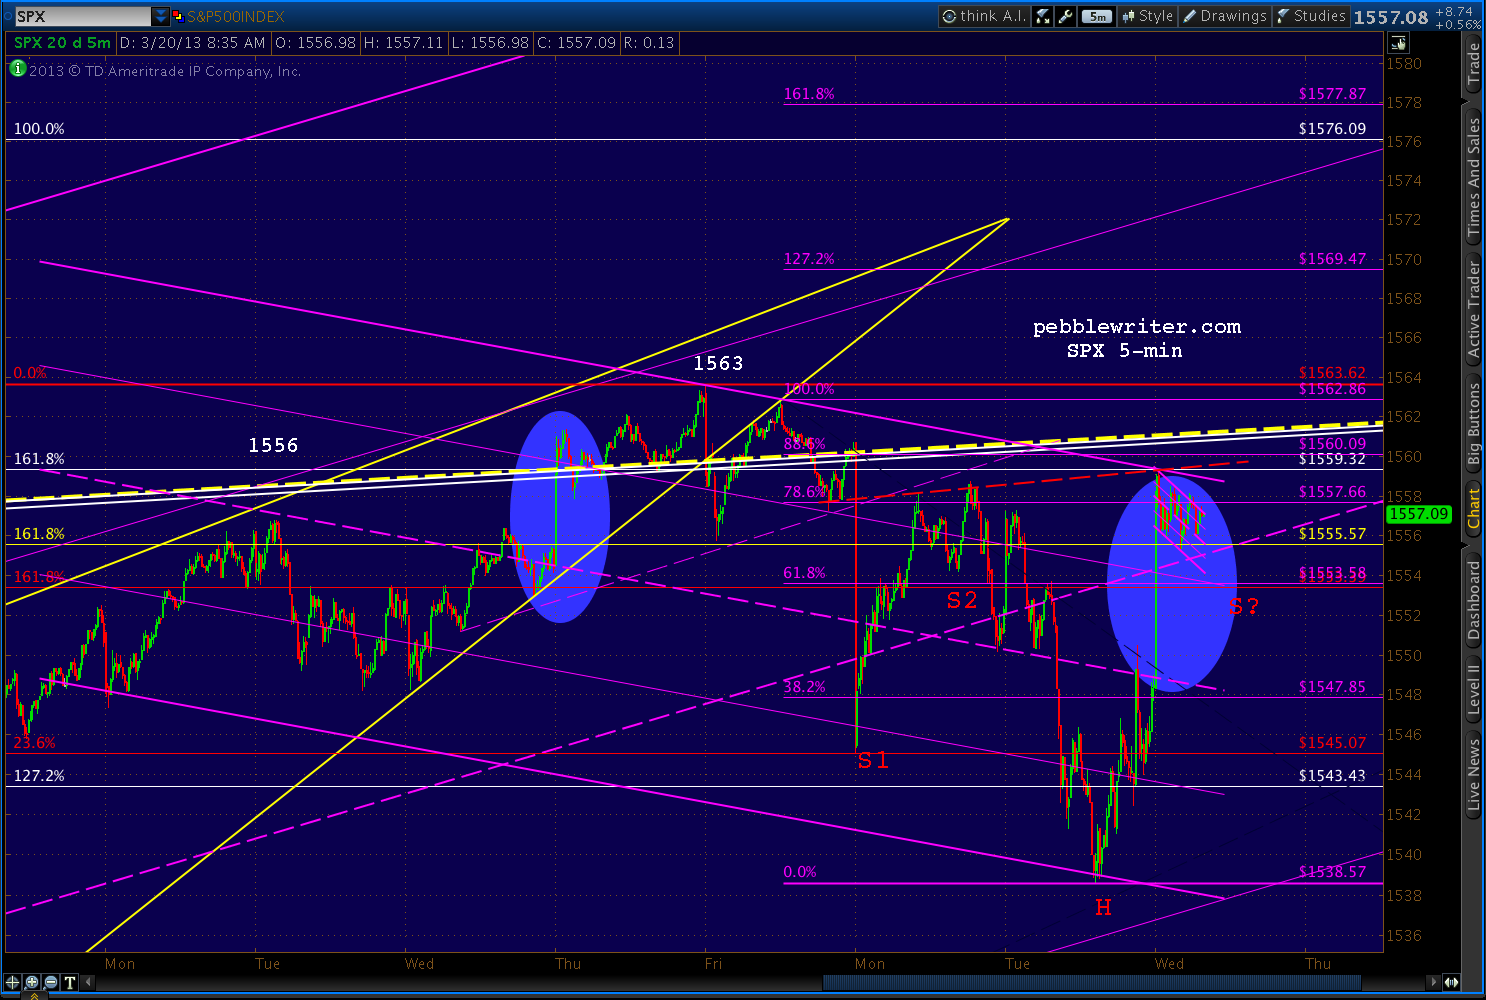
In addition to the little Crab Pattern (purple) that targets 1577 and the flag pattern targeting 1576, there's an obvious effort to construct an IH&S pattern targeting 1580.  It could benefit from a lower right shoulder, but bulls must beware of crossing back beneath the purple channel midline.


The S2 shoulder isn't quite legit, BTW, as the neckline doesn't quite connect on the left side.  But, the S1 shoulder is quite a ways down there.  So, if the pattern plays out, be prepared for some serious chop.

UPDATE:  1:00 PM

With the FOMC announcement a little over an hour away, let's resume our chat about the big picture.  If it seems like we're "lost in the reeds" as one reader so aptly put it, it's because we are.

The large Crab Pattern completions promised a good-sized dump last week at 1553/1555.  Instead we've inched higher.  Why?  These patterns completed in the middle of harmonic no-man's land: the gap between an .886 retracement and a double-top.

The .886 retracement (of the 1576-666 crash) produced a 9% reversal back on Sep 14.  Since then, SPX came screaming back to retake the 1576 all-time high -- but slammed into the Crab Patterns and a very important channel line along the way.

Now, it doesn't know what to do.

Double tops usually produce reversals, too -- sometimes meaningful ones as we found out on October 11, 2007, when SPX scooted up past the 1552 top from 2000 by a whopping 24 points before dropping 58%. 

The 2000 top itself shows just how "messy" tops can be.  Here's the finished picture in perfect hind-sight.  It's a very crowded chart, but every pattern on there had a say in how the top unfolded.


Once SPX broke out of the falling purple channel, it had "permission" to pursue several harmonic patterns in the works.  SPX shot up 66 points in that one day -- blowing through every Fib level between .618 and 1.000.

It finally came to rest at 1458, completing a Bat Pattern at the purple .886.  But, the small white 1.272 was just above at 1477, as was the rising purple channel midline and the 1.272 from a much larger pattern seen below.  An IH&S target waited at 1497 - tantalizingly close to the nice round number of 1500.  The all-time high of 1478 from two months earlier beckoned.


SPX got up to 1477.33 before reacting, falling to 1466 over the next two days.  Close, but not quite.  Someone watching closely might have noticed the Flag Pattern it constructed, targeting 1562.  Someone else probably pointed out the biggest Crab Pattern target of all -- the 1.618 extension of the 13% correction from 1420 to 1233 from Jul-Oct 1999.

I don't know what the catalyst was, but on Mar 21, 2000 (that date sounds awfully familiar) SPX shot up through the channel midline, the cluster of Fibs around 1477 and, importantly, the 1478 high and raced up toward those higher targets.

On Mar 24, it reached 1552.87, which cleared the IH&S target at 1497, the purple 1.272 at 1519 and the last remaining Crab Pattern at 1535.  What ultimately stopped it?  The .75 line from the big purple channel dating back to Jul 1999 -- almost to the penny.

Total move: 17% and 227 points in 20 sessions.  Could it happen again?

continued for members...

*   *   *   *   *   *   *   *

For full access to live market commentary throughout every trading day, subscribe to pebblewriter.com. 


Monday, March 18, 2013

Mad Men, Liars & Thieves

reposted from pebblewriter.com

It's hard to believe the numb nuts running the big show in the euro zone could be so stark-raving mad.  Raising taxes on countries with 25% unemployment seems positively brilliant compared to the idea of confiscating 10% of bank deposits -- especially those that are supposedly insured.

Get ready for the media interpreters who assure us "it's only Cyprus" --  which reminds me an awful lot of "it's only Bear Stearns" or "it's only Lehman."

The issue, of course, isn't the size of the depositor base in Cyprus banks.  It's the effect this action will have on depositors in Portugal, Spain and Italy.

 By now, even the most clueless depositors have to be wondering just how safe their deposits are.  The smart ones already know.  And, the brilliant ones moved their money a long time ago.

This bone-headed action also calls into question the ECB's willingness and/or ability to support troubled nations/banks.  If they can't float a lousy $13 billion to bail out Cyprus, how will they react when other, larger systemic risks pop back up?

And, last but certainly not least, what effect will this action have on the $700+ trillion derivatives market?  It's a spiders nest of complicated agreements whereby one party guarantees another that credit quality/interest rates/etc. won't slip past a certain level.

These private contracts are bought and sold countless times, to the point where no one usually knows the true exposure of any given player until it's too late.  When a bank fails, it's very difficult to discern how many counterparties will be affected.  It quite rightly shakes confidence in the entire system.

Cyprus is a reminder that the euro zone is not "fixed."  It's a reminder that much more is needed to fulfill the promise of "whatever it takes."  And, it's a reminder that the Fed and the ECB either don't have as much control as they'd like us to think, or are losing interest in preventing every little hiccup along the way.

*  *  *  *  *  *  *  *

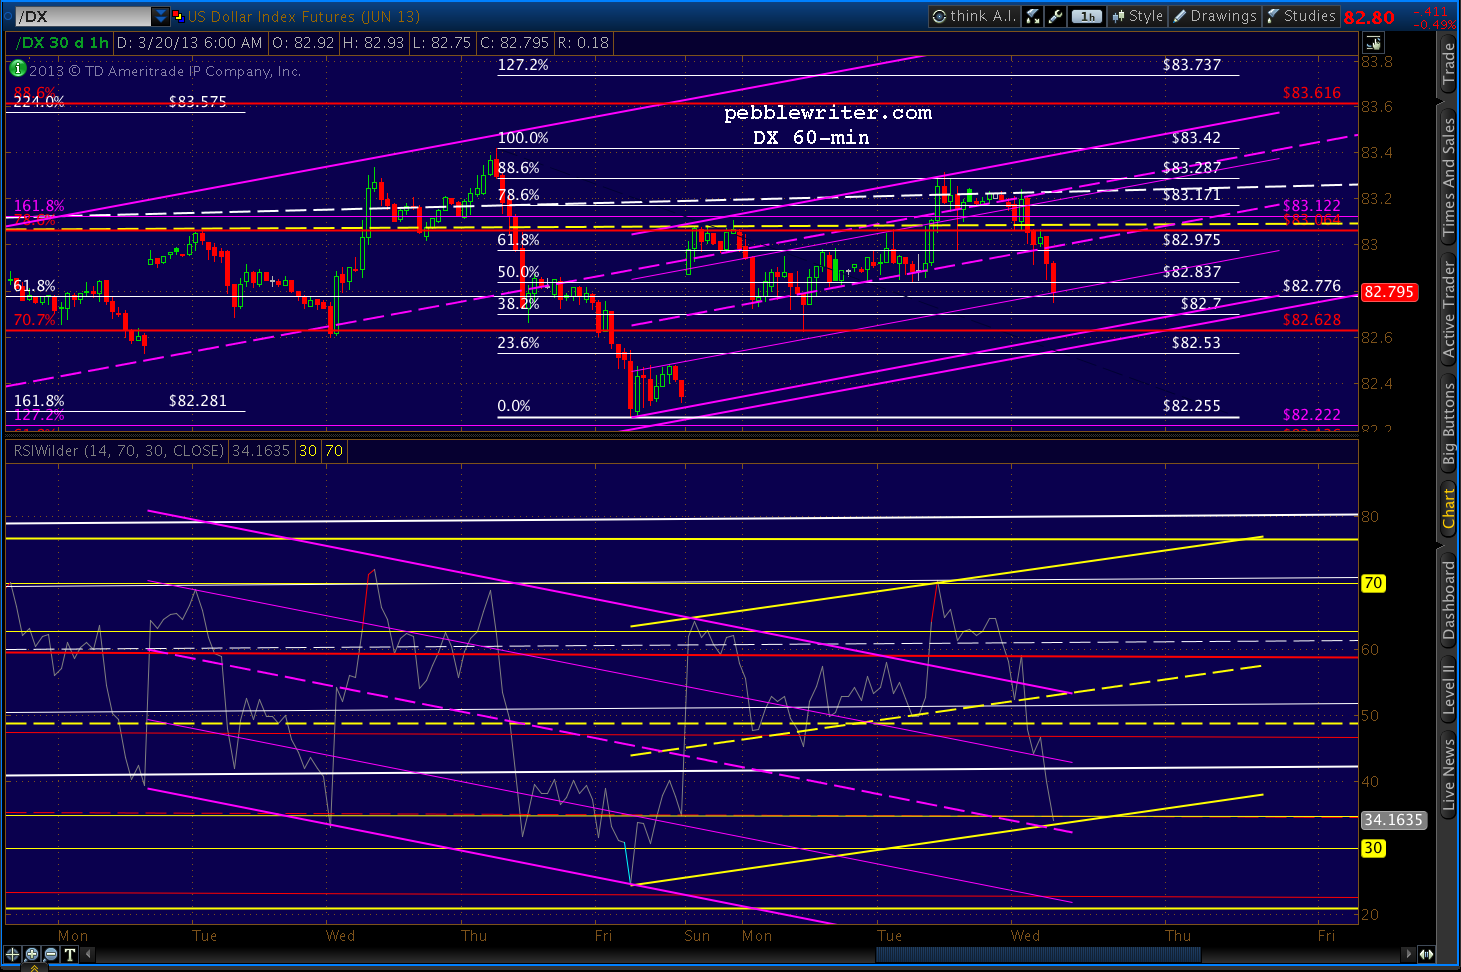
The dollar may have just completed the transformation we discussed at length Friday -- reverting back to the risk-off safe haven to which we're accustomed.


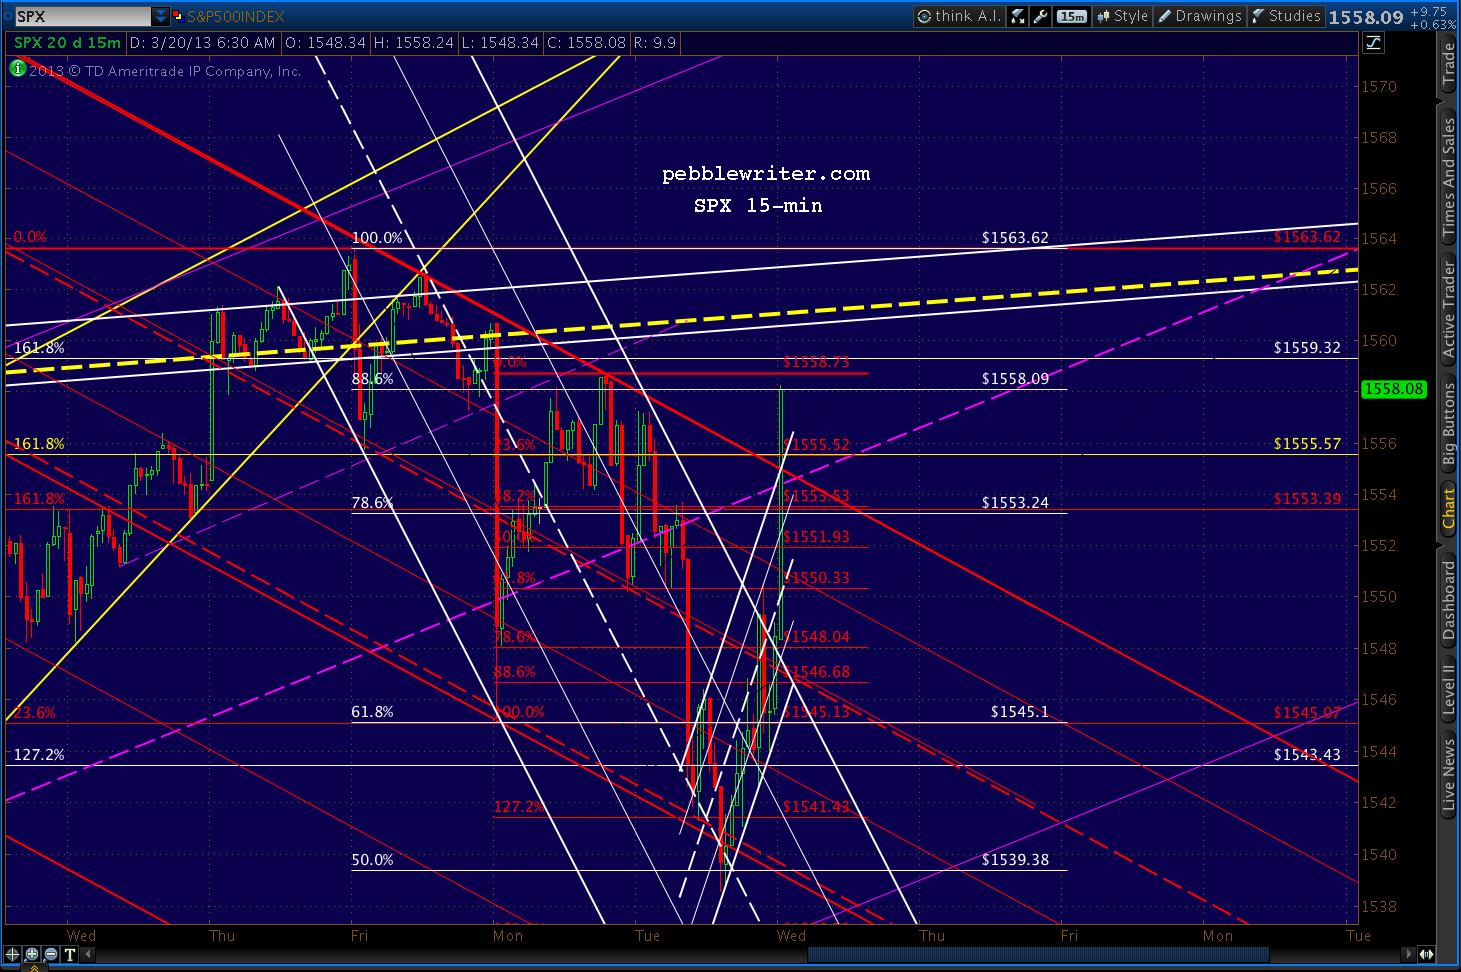
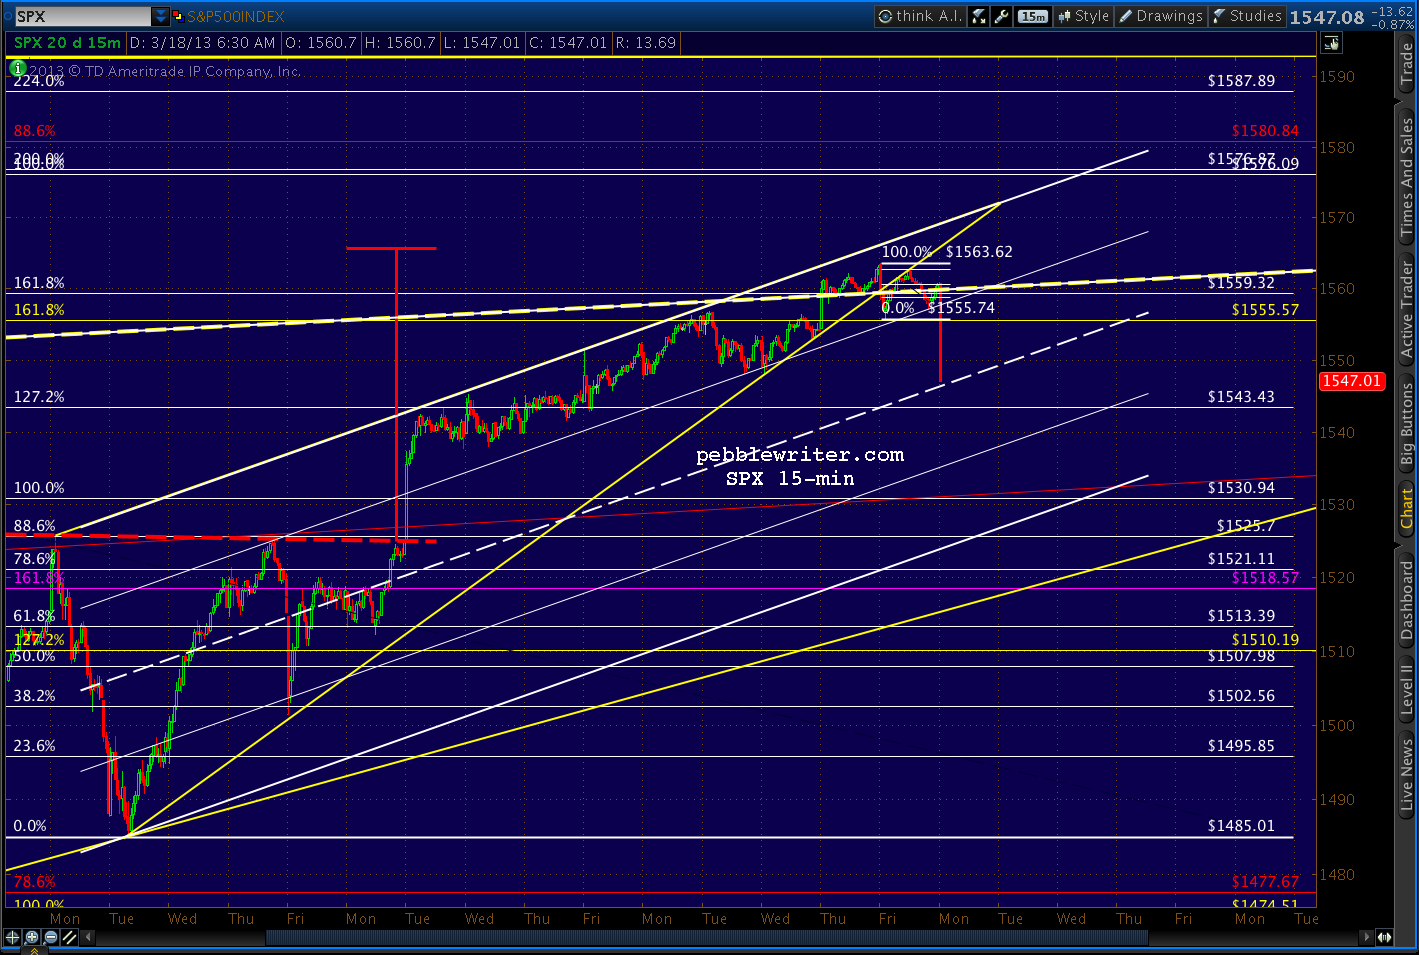
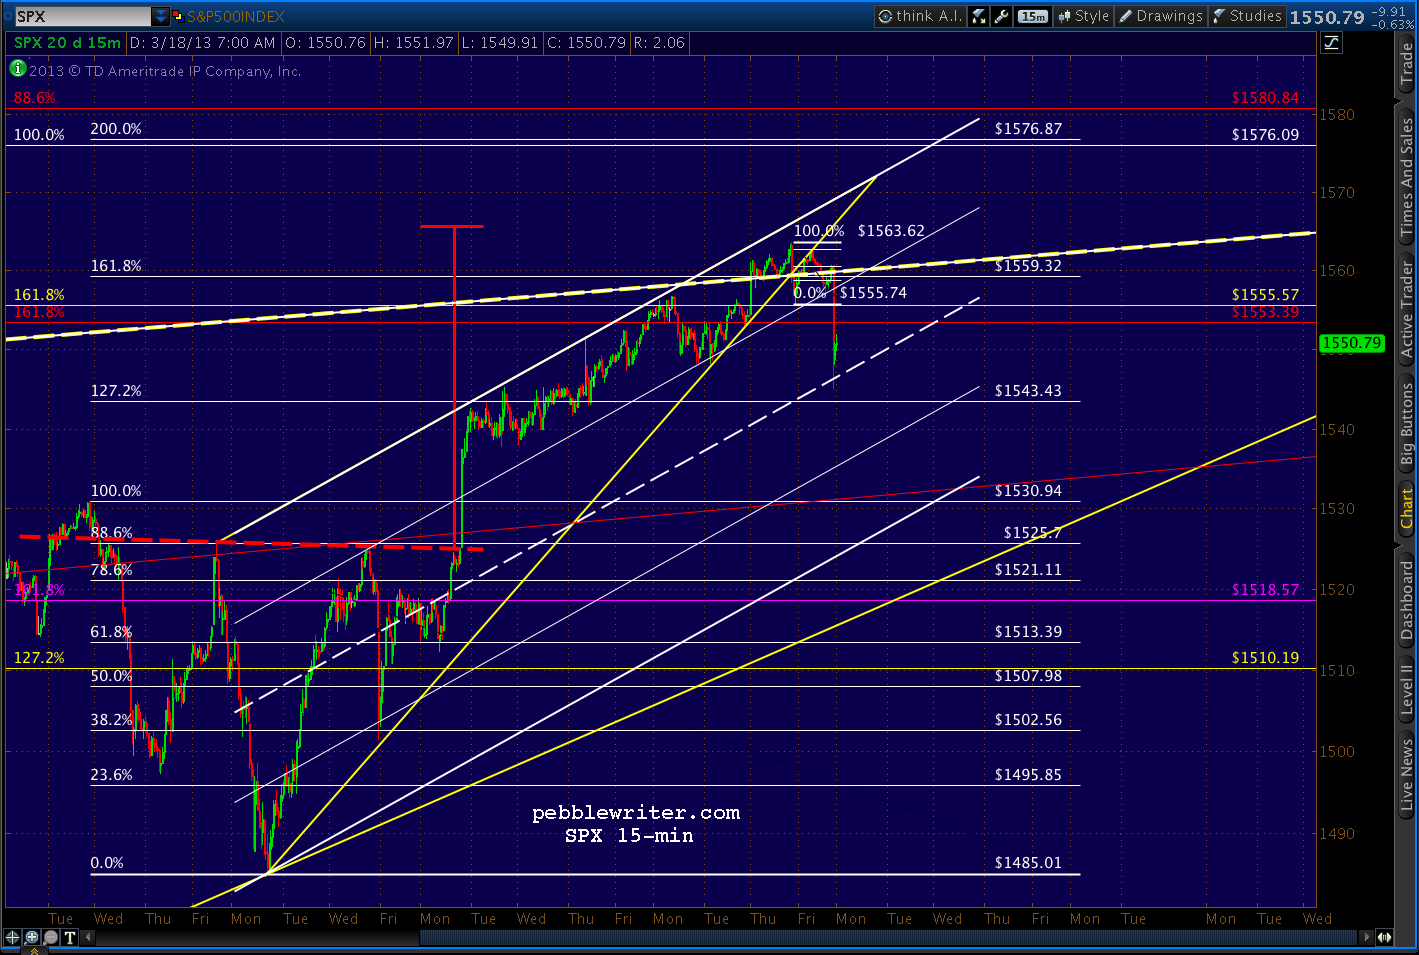
The smallest rising wedge on SPX has clearly broken down and should now try to establish a channel something like the one drawn below. Look for a playable bounce here around the midline between 1543.43 and 1546.


UPDATE:  10:10 AM

We got the expected bounce at 1545.13.  If the bears can keep the trend going, it should fail before the next higher channel line -- currently around 1558 -- or the yellow TL up at 1560.  But, of course, there's no reason it has to be more than 1553.39 (the 1.618 extension of the 1370-1074 correction in 2011) or 1552.19 (the .382 retracement of the move down from 1563.32.)


As legitimate as the little white channel above appears, it's merely a conjecture.  A pitch.  If Cramer & Co. can convince the average small investor to ignore the implications of Cyprus and embrace a market selling near all-time highs, the channel is proof of the absence of risk in the markets.

It coincides nicely with the midline of the larger purple channel that's guided SPX's upside since November.  To bulls, this morning's dip looks like nothing more than a successful test of the midline.


Here's a close-up, showing the tag of the .236 Fib (red) and slight push below the purple midline.  Important for the bullish case: (1)  the white 1.272 is even still intact, and (2) prices are re-testing the 1.618 Fib at 1553.39.

If SPX pushes higher than 1553.39, it reinforces the idea that the Crab Pattern set up by 2011's plunge from 1370 to 1074 is going to fail (8 points would be a failure.)  If it drops below, then the push up to 1563 can be characterized as a momentary blip of irrational exuberance.


The technical elephant in the room, of course, is whether or not SPX will continue to take a run at the previous high of 1576.  It's not as though bulls will throw in the towel over Cyprus.  Take the move down from 1563, for instance.


If this bounce from 1545 retraces all the way to the .786 at 1559.66, it will have set up a potential Butterfly Pattern that targets 1575.   Look for the little white channel to turn by the .500 (1554.38)  in order to construct another leg up.

UPDATE:  1:25 PM

Where does this morning's dump fit in with yesterday's LT charts from the last post [see: Do or Die]?

continued on pebblewriter.com...

Tuesday, March 5, 2013

After the Funding's Gone

~reposted from pebblewriter.com

After a scary drop in equity futures overnight, the market looks to open soft...but not exactly panicked. I remain short since 1525.34 on the 28th, but will continue to play any significant bounces that come our way.

The dollar is still looking strong, reflecting both plenty of fear and euro weakness.  Note, DX reached our intermediate target range from last month (the red .618 @ 82.22 & white 1.618 at 82.28.)


The next level of resistance is the red .786 at 83.064 where it intersects with the purple 1.618 at 83.122.  The acceleration channel that's carried prices skyward since Feb 1 intersects that nexus this week.

Also intersecting there are two channel lines -- the large white midline and the much larger yellow midline -- seen here on the weekly chart.


Daily RSI still shows plenty of upside potential, though we've also seen some negative divergence start to creep into the picture.


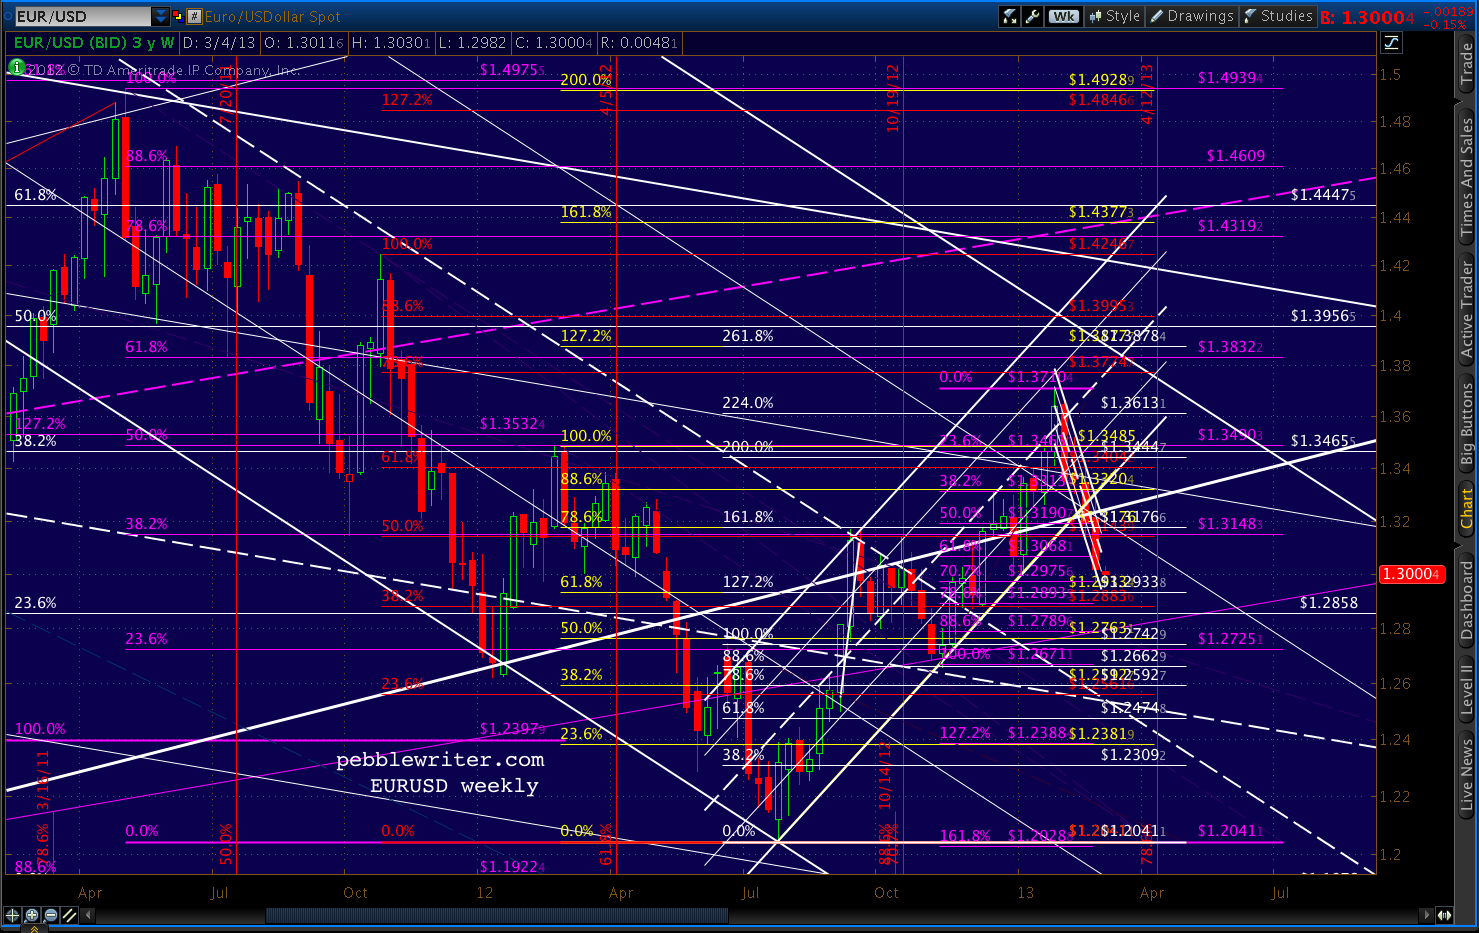
As noted back on Feb 21, the EURUSD has broken down from its rising channel (white) and has accelerated to the downside, breaking the Jan 4 1.2996 low and the psychologically important 1.30 level.


The intersection of the purple .618 and two white channels at 1.38 will have to wait (until my next visit across The Pond, no doubt.)


Losing the rising white channel hurts momentum quite a bit, but it's the drop back through the 75% line on the falling white channel that represents the bigger problem for the pair.

This channel dates all the way back to Dec 06. Reaching the top for the third time is still possible, of course, but it's that much harder now that the pair needs to retake the higher channel line and mount a fresh attack.

I've redrawn the falling white channel as red and will lower its top (for now) to reflect the brick wall it ran into.  I've also sketched in a more relaxed rising channel (light blue) that reflects potential channel support at current prices (the intersection of the falling red .75 and the rising light blue .25.)


I don't know whether the pair needs to retest the falling white midline or not.  The bottom of the new light blue channel intersects with the red .75 in mid-March.  Also there is the .25 of the very large rising purple channel, which provided a huge bounce in Jun 2010.  It's easier to see in the LT chart below.


Recall that we closed a long position and last went short at 1525.34.  From there, SPX fell nearly to our initial target (1496-1500), reaching 1501.48 Friday morning before the bounce to 1519.99.

As we discussed last week, the reversal at the red .786 could be the full extent of a corrective wave on the way lower (the B wave in an A-B-C)  that is meant to test the bottom of the white or purple channels.  But, it could also be the Point B in a Butterfly Pattern targeting 1531 or 1540.


continued on pebblewriter.com... 


Thursday, January 24, 2013

Bonds: The Big Picture

~reposted from pebblewriter.com

First, an important caveat:  I'm not a bond guy.  Never have been, never will be -- at least with long bonds under 8%. To me, the idea of sinking even one dollar into a security (which should be downgraded, mind you) that guarantees less than 2% for 10 years borders on insanity.

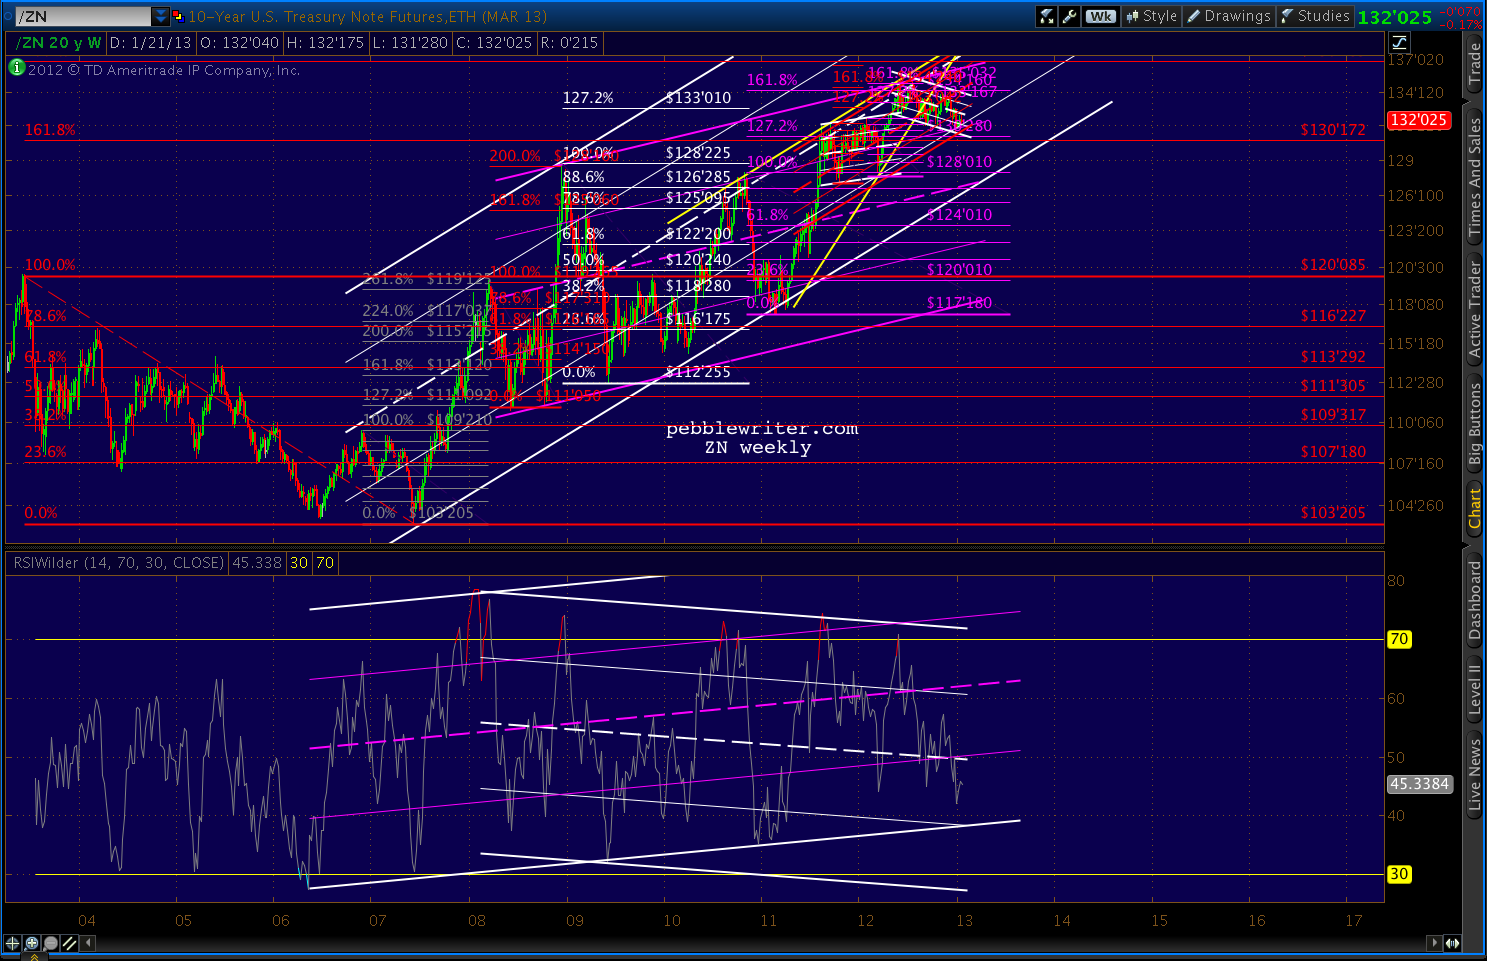
But, different strokes and all that.  Plus, bonds can be a good window on equities and currencies, so I don't mind charting them once in a while.  The 10-yr has obviously been on a tear for several years.  It's settled back from the 2008-09 spike into the bottom half of a channel that dates back to 2005 (white.)


The big question is whether the white channel is still in charge, or the less aggressively sloped purple one has taken over.  Making things interesting, there's a pretty well-formed rising wedge that broke down in August.

But, the RW is slightly suspect because the July 25 high was slightly exceeded on Nov 16 and Dec 6, meaning there are two higher highs and a higher low in place since the August break (though both highs came on negative divergence relative to the July high.)

Harmonics have performed pretty well with the 10-yr note.  The chart below shows a big Crab (grey), followed by another Crab (red), a Bat (white) and another Crab (purple.)  Each previous Crab Pattern completion has been followed by a significant retreat, so we might suspect one here with the purple pattern completion.


The only potential hitch is whether the white pattern is still in play.  Bats can and do go on to form Crabs, and the white 1.618 is way up at 138'170 -- a 4.5% increase from current levels.


There is a significant amount of negative divergence on the daily and weekly channels, so I suspect not.  But, obviously, a strong equities sell-off would turn that assumption on its head.

A return to the top of the red channel would take daily RSI to the purple midline.  On negative divergence, that could easily line up with the white 1.618.


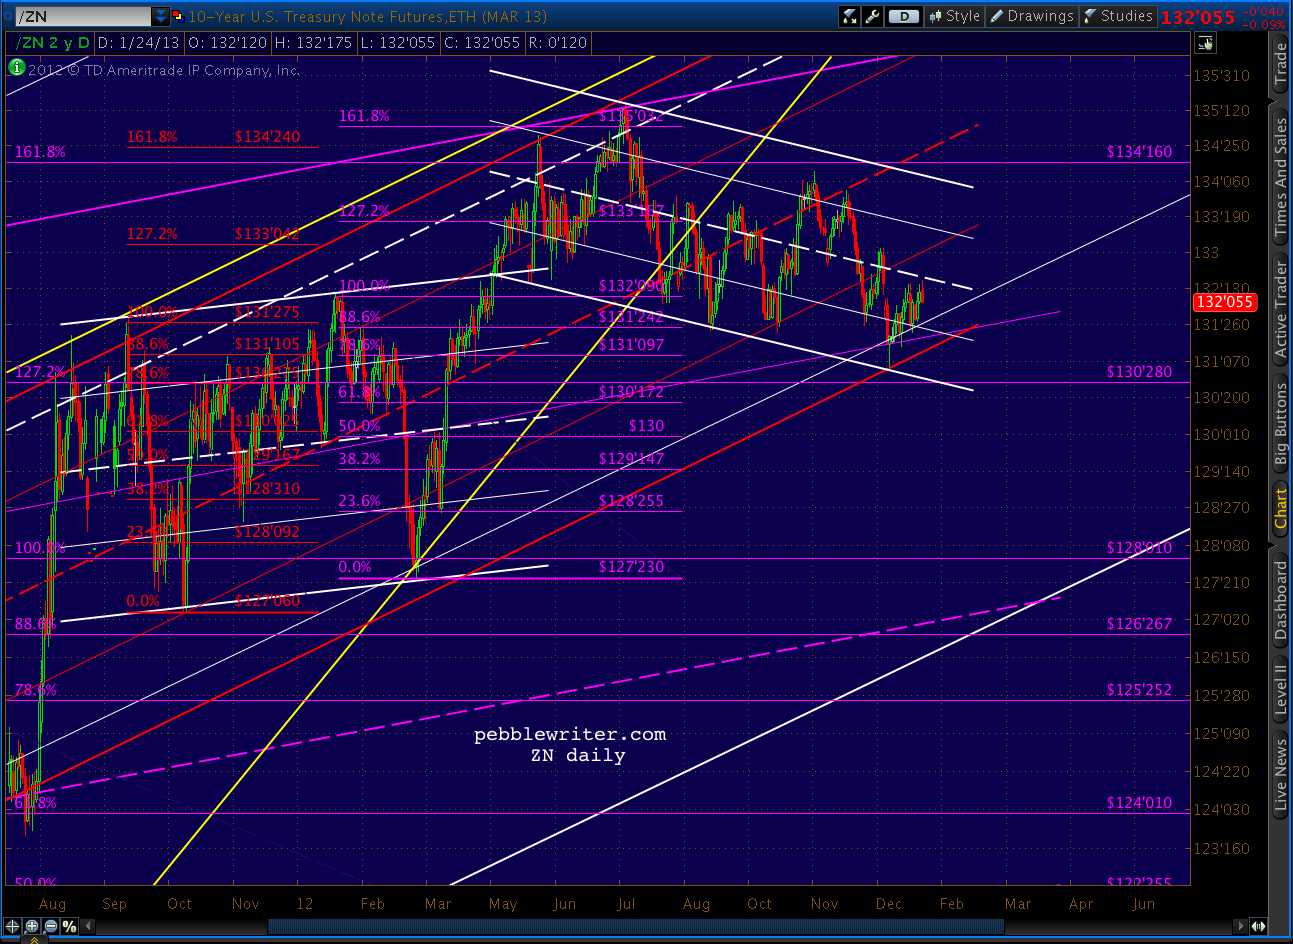
The close-up shows a potential channel since the most recent Crab Pattern reversal and the impact of the white 25% channel line.  The easiest call is for a bounce off this line as well as the small channel bottom.  If that occurs, the 138'170 level is in the cards.


Otherwise, the bottom of the white channel and the middle of the purple channel intersect at the 126-127 area (the purple .886 is 126'267 and the white .886 is 126'285) around the middle of March.