PEBBLEWRITER.COM IS LIVE!


*************** PEBBLEWRITER.COM IS LIVE! TO SIGN UP, CLICK HERE ***************


Showing posts with label pebblewriter. Show all posts

Tuesday, November 3, 2015

Banks' Wipeout Ratio - An Update

reposted from pebblewriter.com:

In April 2012, I calculated the size of banks' derivatives positions relative to their capital to show how small an upset it would take in the derivatives market to wipe out banks' Tier 1 capital.
The results were pretty alarming.  It would take only a 0.18% decline in the value of their collective $240 trillion derivatives portfolio to wipe out their Tier 1 capital.
Wipeout Ratio
S&P's announcement this evening that it had placed big US banks on Ratings Downgrade Watch got me to thinking.  Have banks improved their financial stability, or are they still perched on the eve of destruction?

First, it should be noted that it isn't that easy to find Tier 1 capital anymore.  The OCC now reports Total Risk-Based Capital, which includes Tier 2 items such as subordinated debt, asset revaluation reserves, undisclosed reserves and hybrid (debt/equity) capital instruments.

The upshot is that Total Risk-Based Capital is bigger than Tier 1 alone (from 5-18% bigger.) Regardless of whether or not the padding is warranted, we'll ignore it for comparison purposes.
The 2015Q2 results can be seen in the chart below.  Things have improved, but only slightly.

Wipeout Ratio 2015-1102

JP Morgan and Bank of America significantly decreased the size of their reported (nominal) derivatives portfolios.  And, each has roughly doubled their Wipeout Ratio.

Citibank and Goldman Sachs, on the other hand, barely decreased the size of their derivatives portfolios.  And, their Tier 1 Capital increased only slightly.  So, their Wipeout Ratios improved marginally.

The fact remains that, seven years after the financial crisis, the four largest banks are still extremely vulnerable to a fluctuation in the value of their derivatives.  Theoretically, a 1/4 of 1% decline in the value of their derivatives would wipe out their capital.

Fortunately for them and their shareholders, the regulators don't require them to mark derivatives to market anymore.  They're also able to net out (supposedly) offsetting positions without providing much, if any, proof that such offsetting is appropriate.  From JP Morgan's financial statements:
U.S. GAAP permits entities to present derivative receivables and derivative payables with the same counterparty and the related cash collateral receivables and payables on a net basis on the balance sheet when a legally enforceable master netting agreement exists.
In other words, if you have an agreement with the next Bear Stearns, AIG or Lehman wherein you promise to make each other whole when TSHTF, there's no need to burden us with all the details.  It's enough to say that there's no net exposure.

If any of these deceptions helps you sleep at night, God bless.  The banks will gladly hold even more of your money and pay you next to nothing.  Or, maybe they'll start charging you for the privilege, as in parts of the eurozone.

Bottom line, S&P is probably making a big deal out of nothing.  Though global derivatives still exceed $1 quadrillion (that's 1,000 trillion or $1,000,000,000,000,000) and the capital of the biggest, strongest banks in the world are 0.25% away from being wiped out, there's really nothing to worry about.*
*  until there is

 *   *   *   *   *

Like what you see? For an instant $250
discount on new Annual Subscriptions

just enter the coupon code "Two-Fifty"
when you subscribe.

Details and sign-up at: SIGN ME UP!

Wednesday, October 23, 2013

Mucking About

~reposted from pebblewriter.com~

ES came within .09 of our interim target from Monday [see: CIW Oct 21] and is reversing nicely, though we're a day behind the schedule discussed on the 17th.


The implications are that this sell-off might be a little less deep than I originally thought. Still, as we discussed yesterday, it should be steep enough to flesh out the red channel within a few days.

The dollar reverted to the pale blue .886 before falling back to a higher low, having been rebuffed by the falling wedge's lower bound.  It'll be interesting to see whether the equity plunge is frightening enough to produce a real dollar rally -- or merely slow the bleeding.


SPX's 90-pt plunge in late June (1654 to 1560, in yellow on the chart above) produced a dramatic spike in DX -- which then continued to rally with stocks until they had recovered their losses.  For now, at least, the dip below the critical 78.725 has been averted.

I'm often asked why, if the larger harmonic patterns are so clear, one should muck about with the smaller patterns, channels, etc.  The rally from 1640 to 1754 demonstrates the value quite well.  The 110 points, alone, would have been a 6.7% return -- not shabby for a 12-session holding period. 

Yet, as the chart below shows, there were several reversals that were fairly "by the numbers."  The purple .786 (yellow .618) provided a 20-pt reversal, and the purple .886 another 11 points.


Adding in those extra 62 points alone (the reversals and their retracements) would have boosted the 6.7% return to about 10.5%.  But, more importantly, the harmonics alone don't tell the whole story.

Consider our forecast from July 15, when SPX was about to register a new all-time high.  Based on harmonics, I expected a reversal at 1712 (it came at 1709) and subsequent rally to 1765, followed by a 45-point retracement on the way to 1823 -- all by late August.


A buy-and-hold investor would have done reasonably well with that forecast.  SPX came within 6 points of that 1765 target before reversing yesterday -- a modest 4.6% gain from 1682.  There's nothing wrong with 4.6% for three months (about 18% annualized.)

However, by simply paying attention to the channels, we were able to spot the trend shift in early August that signaled a deeper dip than originally anticipated.  That deviation provided an additional opportunity of 54 points (27 X 2.)  The September dip from 1729 to 1646 provided another 166 points of potential return.


Suddenly, a 77-pt or 4.6% potential return becomes a 297-pt or 17.7% return (about 70% annualized) -- from simply tossing channel analysis into the equation.  By considering many other chart patterns, coincident developments in other securities and currencies, analogs, RSI channels and other, more traditional technical analysis, we've been able to do even better.

Let's be clear on one thing: it is highly unusual for anyone to catch the absolute top and bottom of every major move.  We've done better than most, but I still miss a lot more than I care to admit.  But, that's not important...because, it's not our goal.

Our goal is simply to catch "most of the moves most of the time."  This means developing the very best forecast we can and following it until it stops working.  Sometimes, it works for days or even weeks.  And, sometimes it works for all of five minutes.

The key is acknowledging when it's not working -- which means (1) having a discrete price level or chart pattern that provides a clear signal, and (2) setting aside one's ego and admitting that the forecast was hogwash in the first place (by far the harder of the two!)

continued on pebblewriter.com

Tuesday, July 2, 2013

Fireworks Ahead!
NOTE:  Only about half the discounted annual memberships are left.  Many of you have memberships expiring this month.  If you plan on upgrading or extending or haven't completed your order yet, don't forget it's first come-first served. 

The sale will be announced outside the membership tomorrow if any memberships are left at the discounted price.  This will likely be the last sale before the Fund goes live and memberships to the current website will no longer be accepted.  CLICK HERE

Also, I intended to post the May and June performance last night, but ran out of time.  I should get it posted later this afternoon.  Check back HERE.  I have put together a page describing the basic investment philosophy and strategy underlying this site that some might find interesting: HERE


Reposted from pebblewriter.com...

Everything is going according to plan this morning, with all currency pairs approaching their targets from last week.

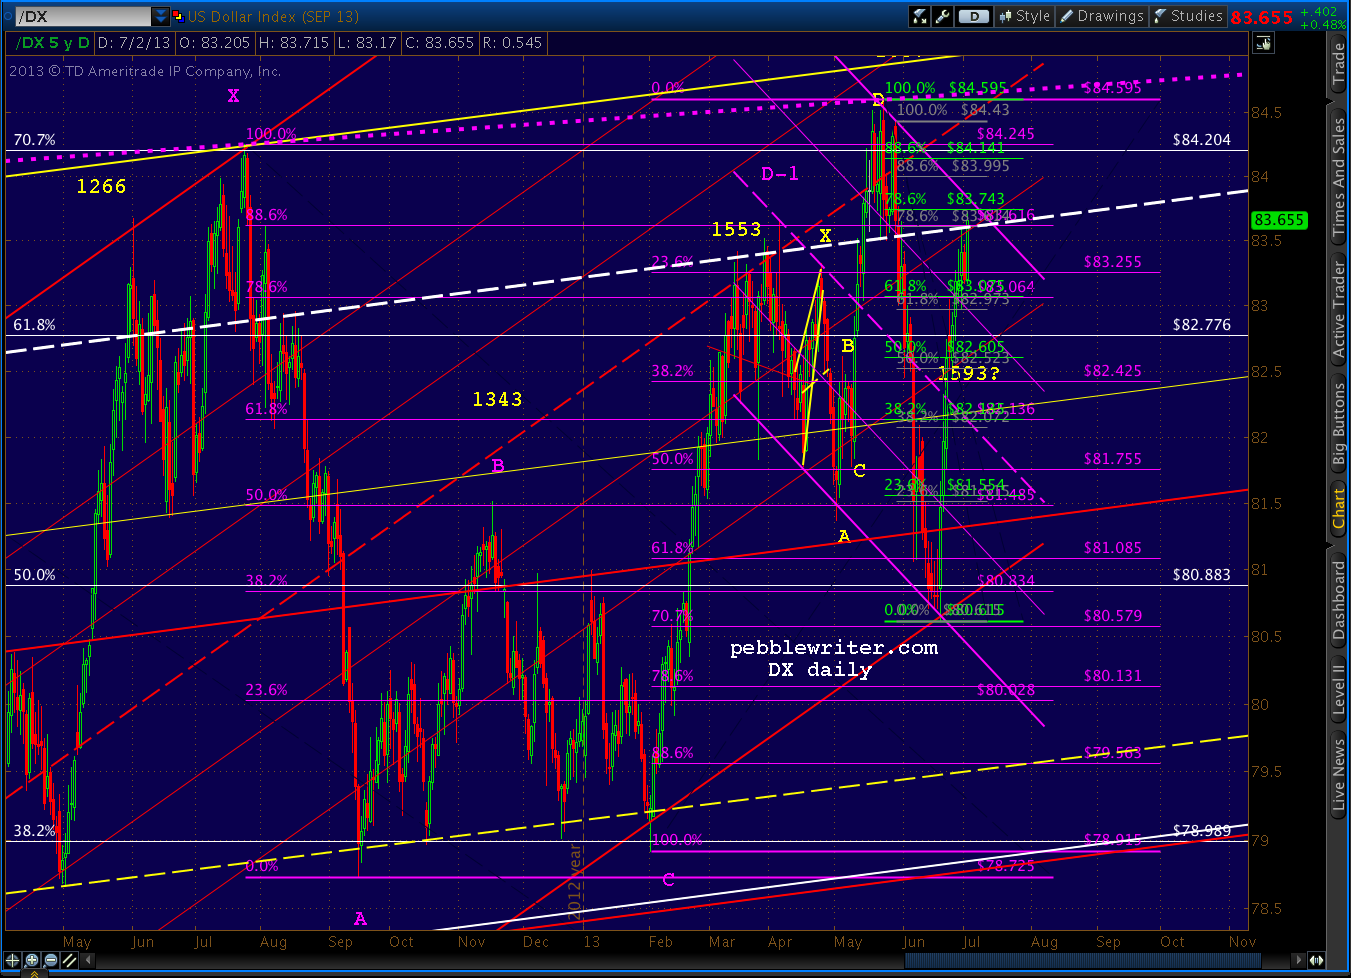
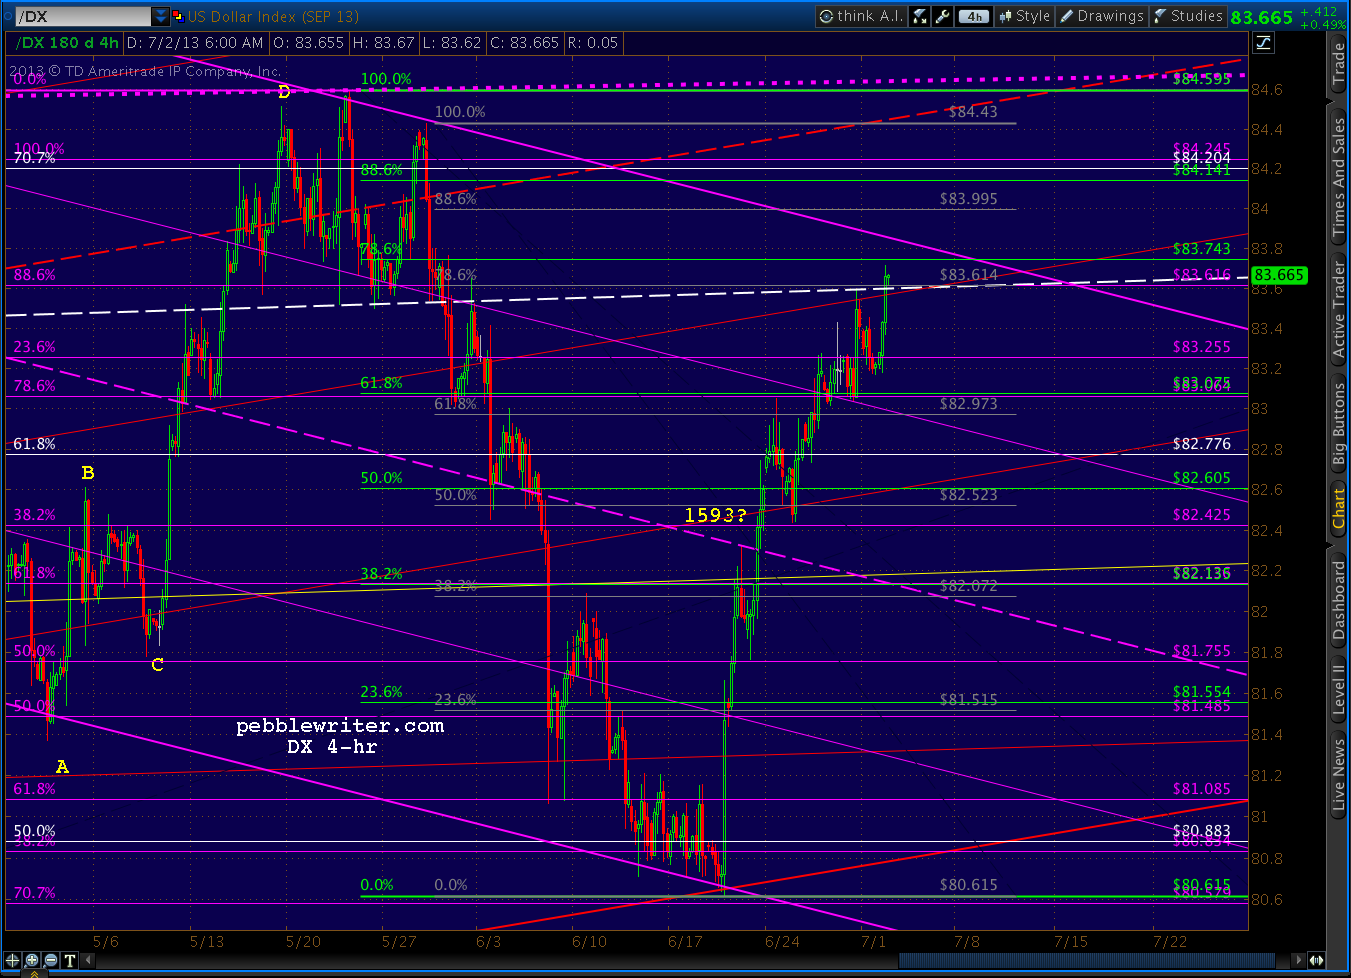
The dollar is back to the white channel midline where exciting things happen.  The last squirt higher led to 84.595 on May 23, the day after SPX topped out at 1687.

This time, however, there's a falling purple channel and the .786 Fib line to consider.


A close up reveals that DX is also pushing up through the red channel .382 line.


While the EURUSD is approaching the .786 retracement of its rally from the 1.2795 low, the red channel midline and the bottom of the light blue channel.


A close up...


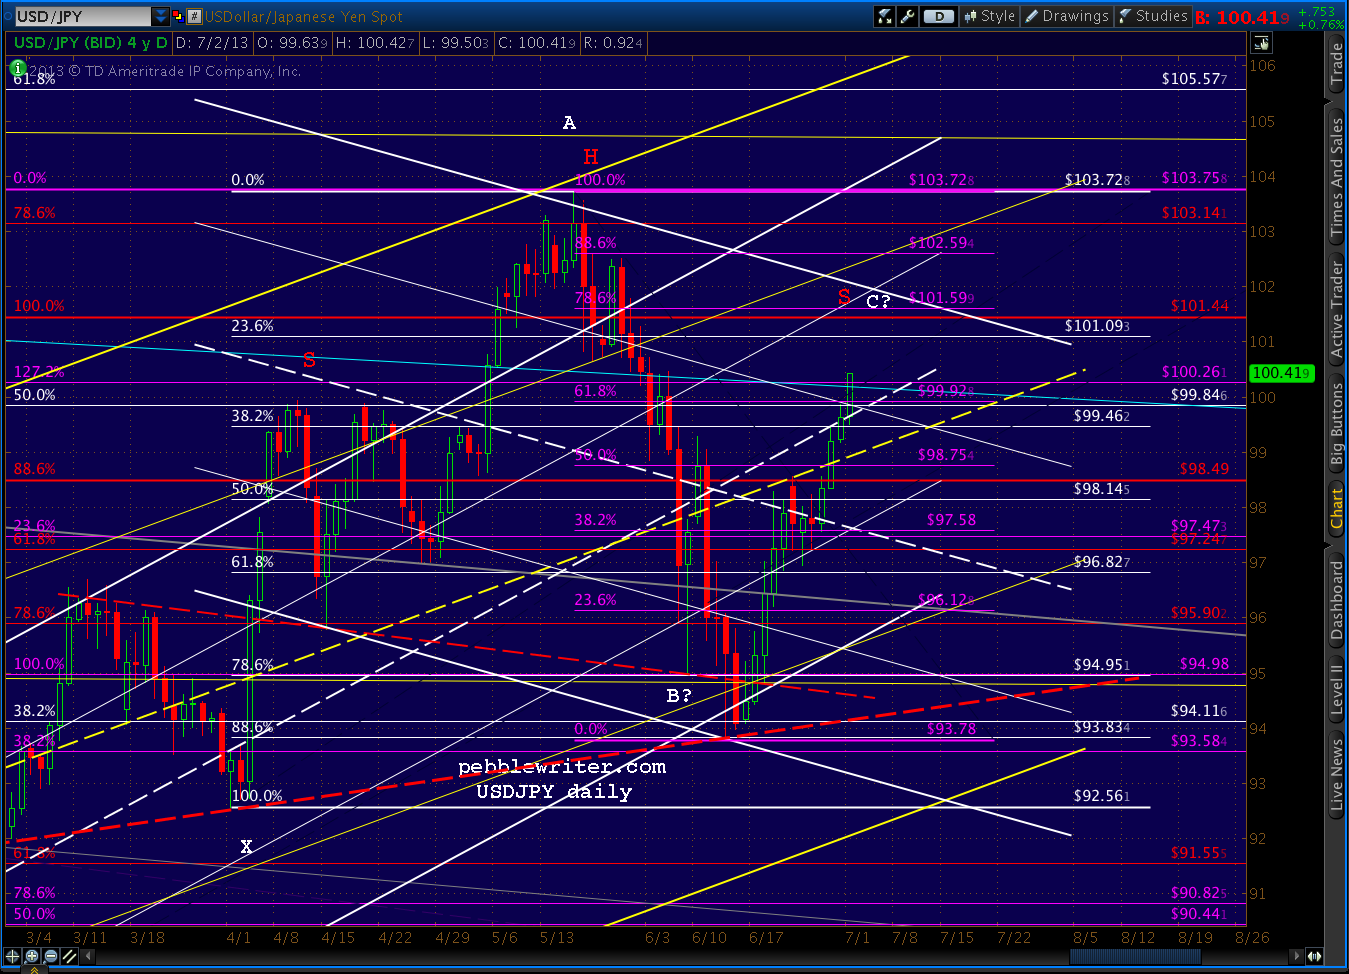
The USDJPY is closing in on our 101.59 target at the .786 Fib.


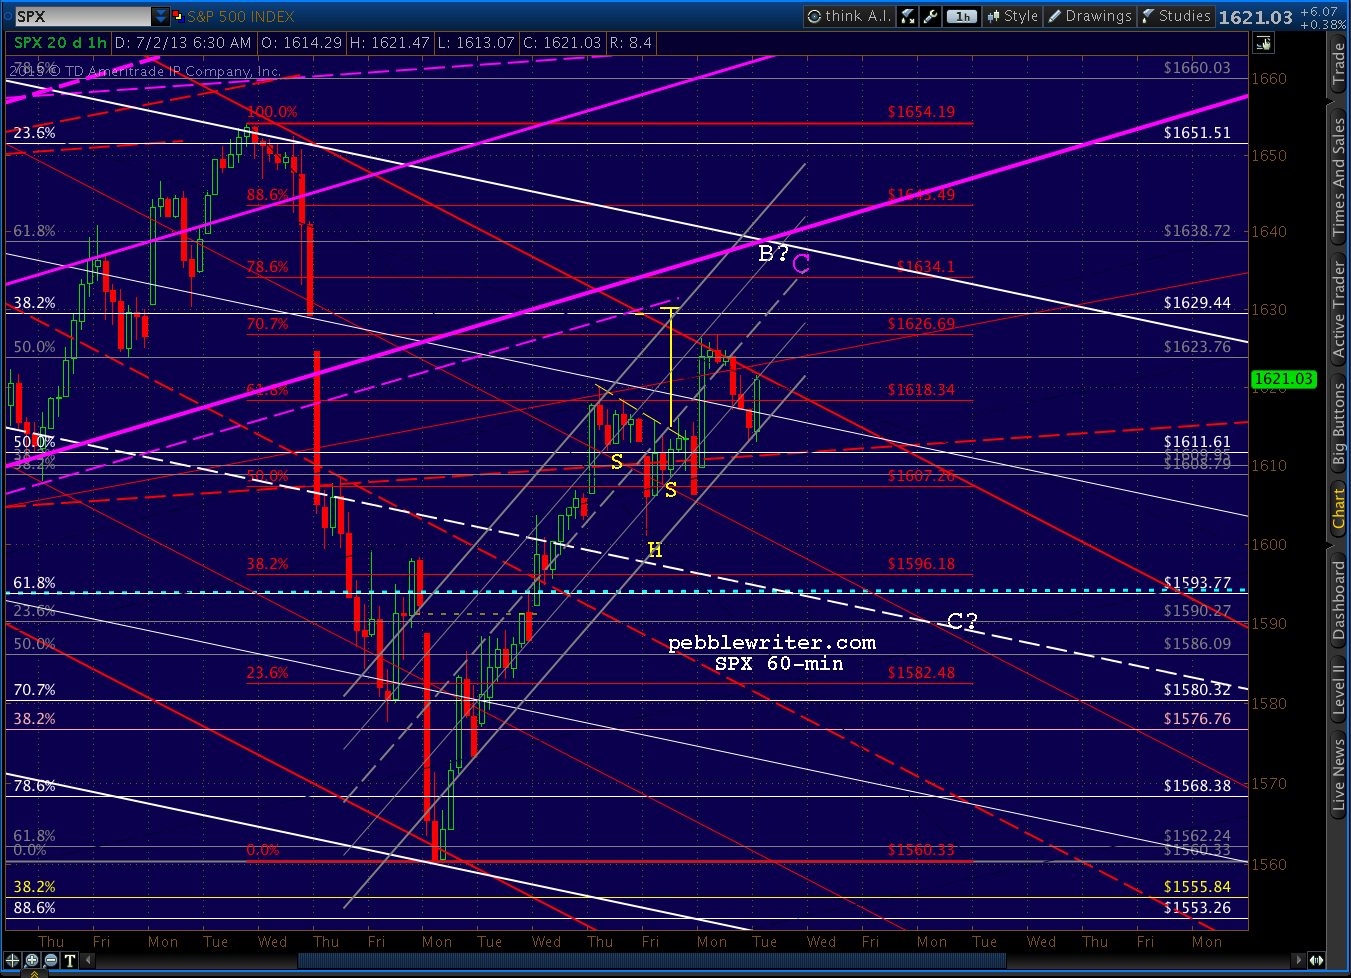
The e-minis, which back-tested the bottom of their purple channel at the white .500 Fib yesterday, took another run overnight but fell short -- reaching only the top of the falling red channel.


We'll see if SPX has enough juice left to take its own shot.  The first test this morning will be pushing through the top of the red channel -- at least intra-day -- at about 1621.50.

UPDATE:  9:52 AM

SPX reached the red channel and is debating whether to push through or take a breather.


Recall, the cluster of targets we discussed last week includes:
  • the gap fill at 1629.22
  • the IH&S target at 1631.67
  • the red .786 Fib at 1634.10
  • the grey .618 at 1638.72
SPX came within 3 points of filling the gap yesterday, but ran into the same channel top and fell back to close at the bottom of the grey channel in the 5th such stop-clearing exercise in a week and the 9th close at or near the daily low in a fortnight.

It also tagged the .500 grey Fib (of 1687-1560) yesterday, where it (so far) reacted less than it did at the red .618.

So, the red pattern is assumed to be the one in charge, with a Gartley Pattern completion at the red .786 (1634.10) the next major Fib target on the radar.

UPDATE:  10:15 AM

A close up shows two smaller patterns also pointing to the 1631-1635 range if SPX can poke through the red channel top.  Note also the presence of the pink .618 here -- contributing to the pause.


We've had a few pieces of economic news this morning.  First, the Fed is set to vote on Basel III this morning.  While significantly watered down, it could still be construed as a speed bump on the road to global financial domination.

Also, Census released the factory orders survey for May. The managed (a.k.a. seasonally adjusted) version came in slightly higher than expected, at +2.1% versus 2.0% consensus and 1.3% for April.


There is bound to be some concern that the slight beat undermines support for QE (does anything else matter?)

This explains why the less-managed, de-emphasized, and not seasonally adjusted number, at +5.4% month-over-month, is the better number for a change.  Remember the good old days when they massaged the numbers to make things look better?

Thursday, April 25, 2013

The Best Laid Plans

The best laid plans of mice and men
Go often awry,
And leave us nothing but grief and pain,
For promised joy!
Robert Burns, 1785


ORIGINAL POST:  6:45 AM EDT

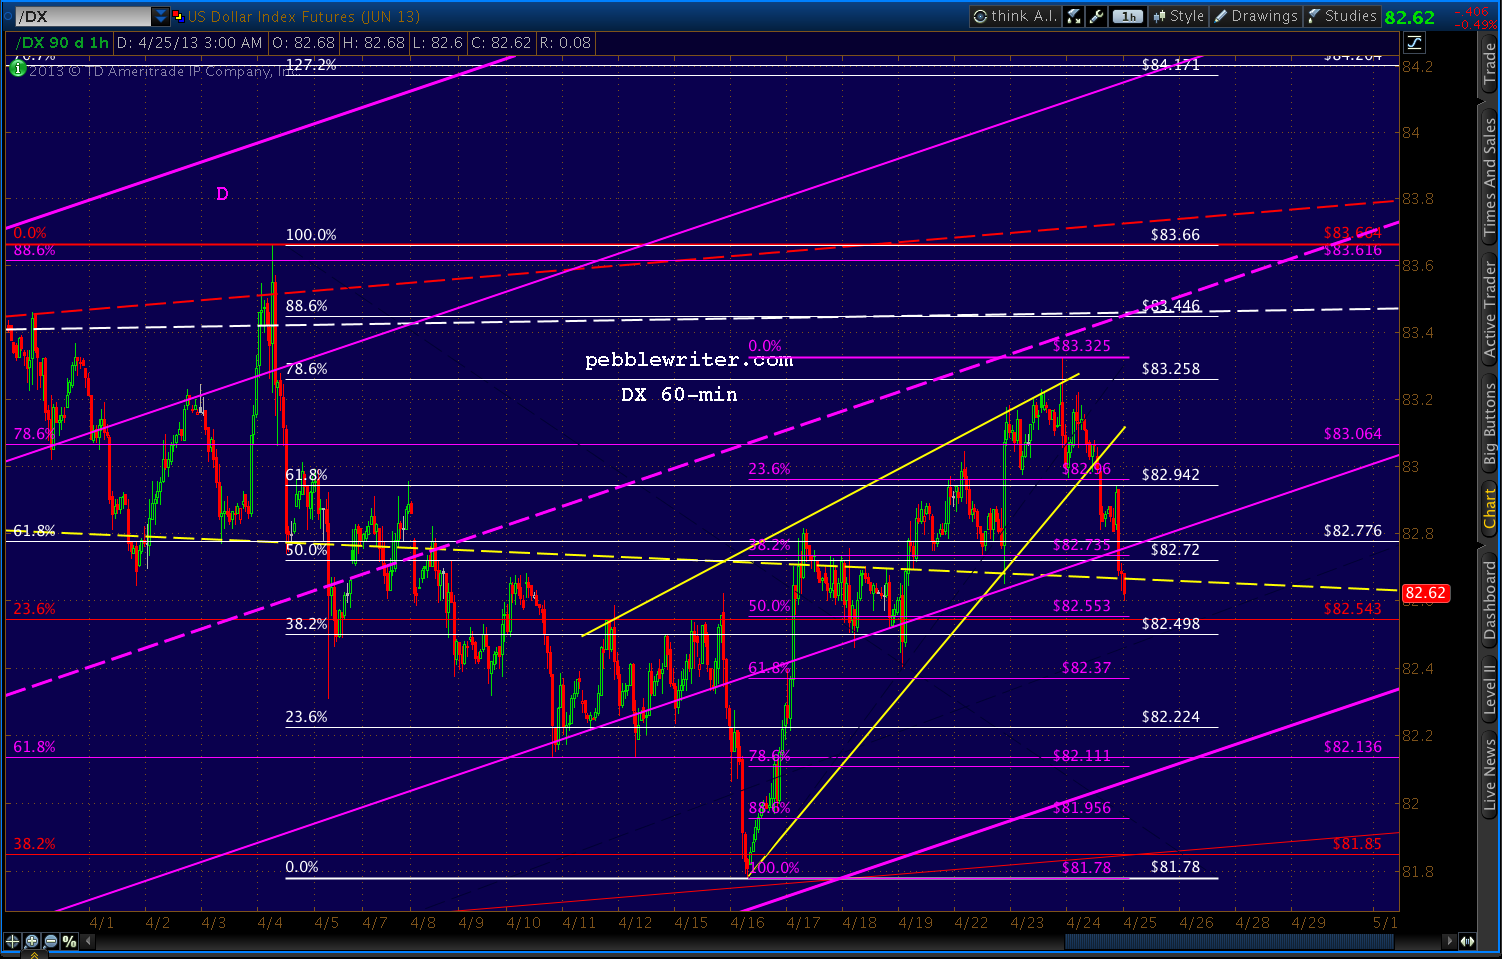
The wedges we've been watching on DX and EURUSD are playing out.  EURUSD has broken out...


...and DX has broken down.


But, it's the USDJPY that I'm watching especially closely this morning.  It still hasn't broken 100 since our Apr 8 observation [USDJPY update] that it was running out of steam:
"...there is growing risk of a downturn as it approaches 100... it appears the pair might have hit at least interim resistance at today’s high."
It topped out 3 sessions later at 99.94, and two weeks later is in danger of a larger pullback.


Remember, weakening the yen was a critical element of the BOJ's stimulus program that was supposed to generate inflation, boost Toyota sales and send Japanese investment funds flooding into foreign markets.


Instead, Japanese investors are repatriating their funds from abroad -- a net Y9.5 trillion ($95 billion) since the first of the year.  Why?  As any US investor could tell you, QE might not inflate economies, but it sure as hell inflates markets.

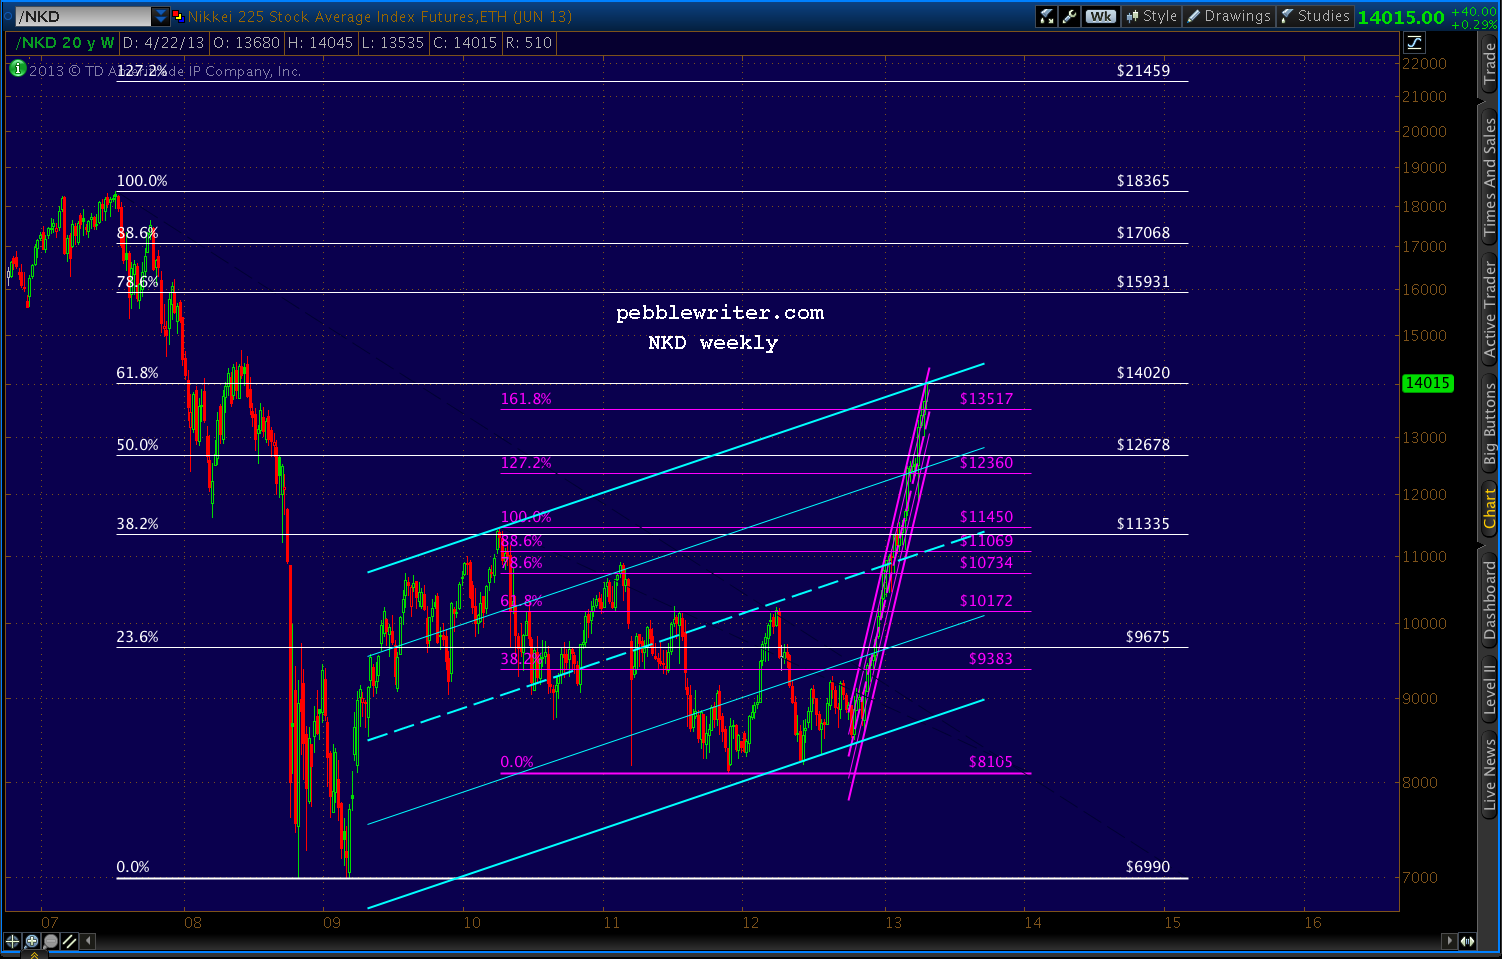
The Nikkei 225 is up 65% since last October's lows....


...and, still hasn't even recovered 2/3 of its losses from the 2007 crash.  The Dow and the S&P 500, by contrast, have recovered all of them -- and, then some.  So, to many, the Nikkei still seems the better value.  It's hard to argue with success.

But, I'll do it anyway.  In reaching 14,020 a few hours ago, NKD tagged the .618 Fibonacci retracement of its 2007-2009 crash from 18,365 to 6990.


To those not familiar with harmonics, this tends to be a big deal.  When SPX reached the equivalent point in April 2010, it plunged 17%.  The DJIA fell almost 15%.  The USD, represented by DX, soared 9.3%.

But, the yen positively soared.  USDJPY started a 17-month slide that took the pair down 20% from 94.98 to 75.78.  NKD, which had just reached its .382 Fib, shed 23% over the next 4 months, eventually reaching almost 30% in Nov 2011.

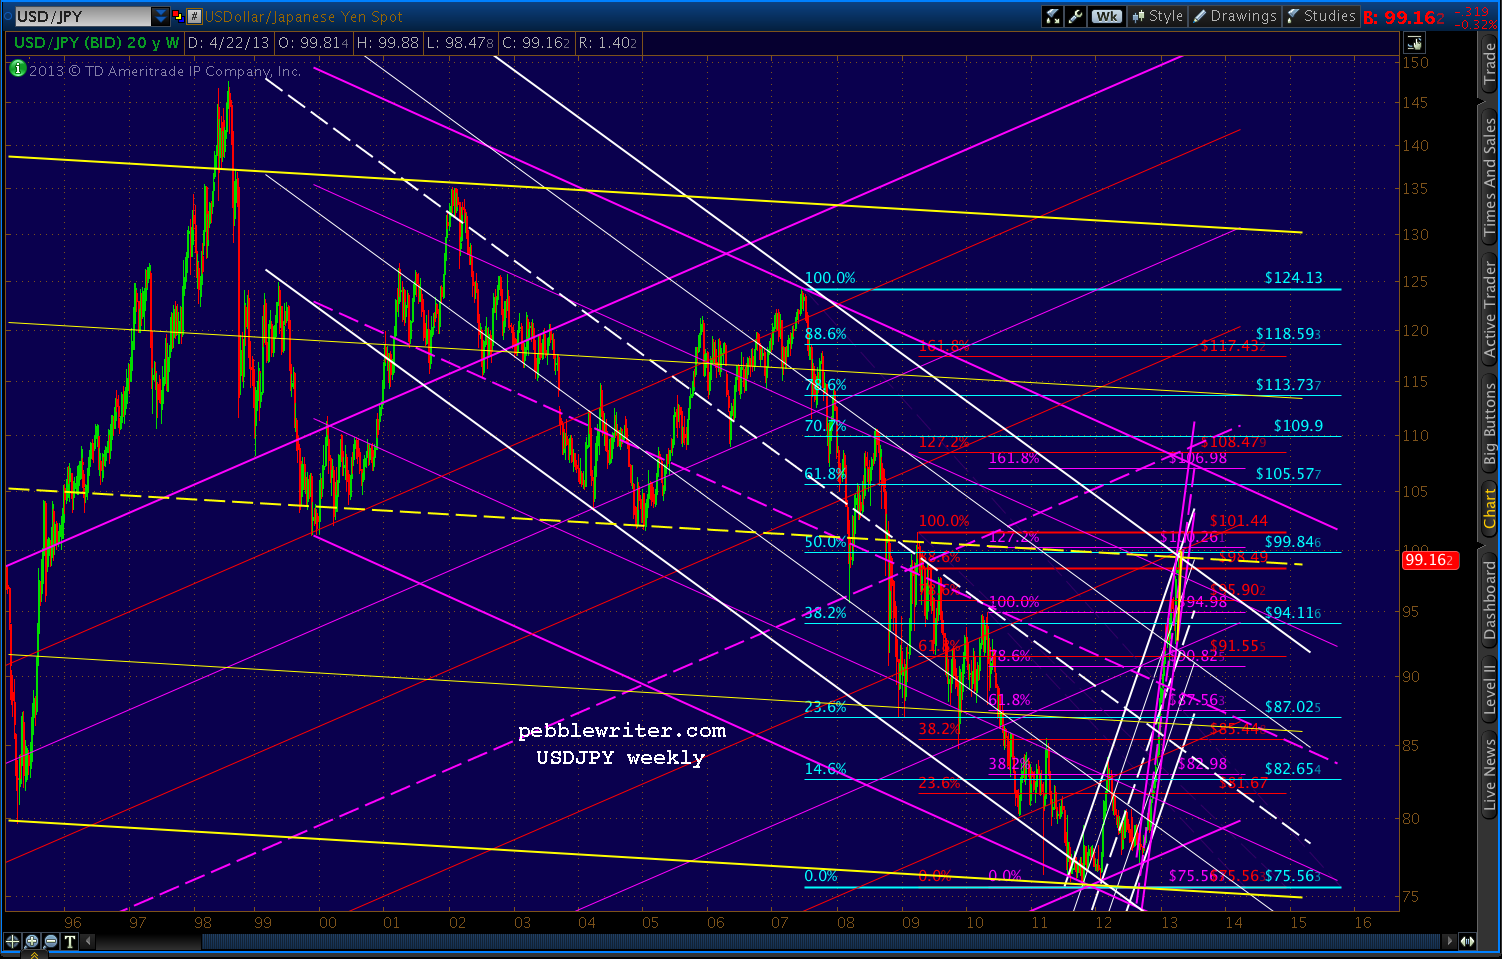
Could the USDJPY's failure to break 100 be telling us something?  You better believe it.  I called a top a few weeks ago because the pair had reached several important Fib levels as well as the midline of an important channel (in yellow, below)...


...that dates back to 1995.


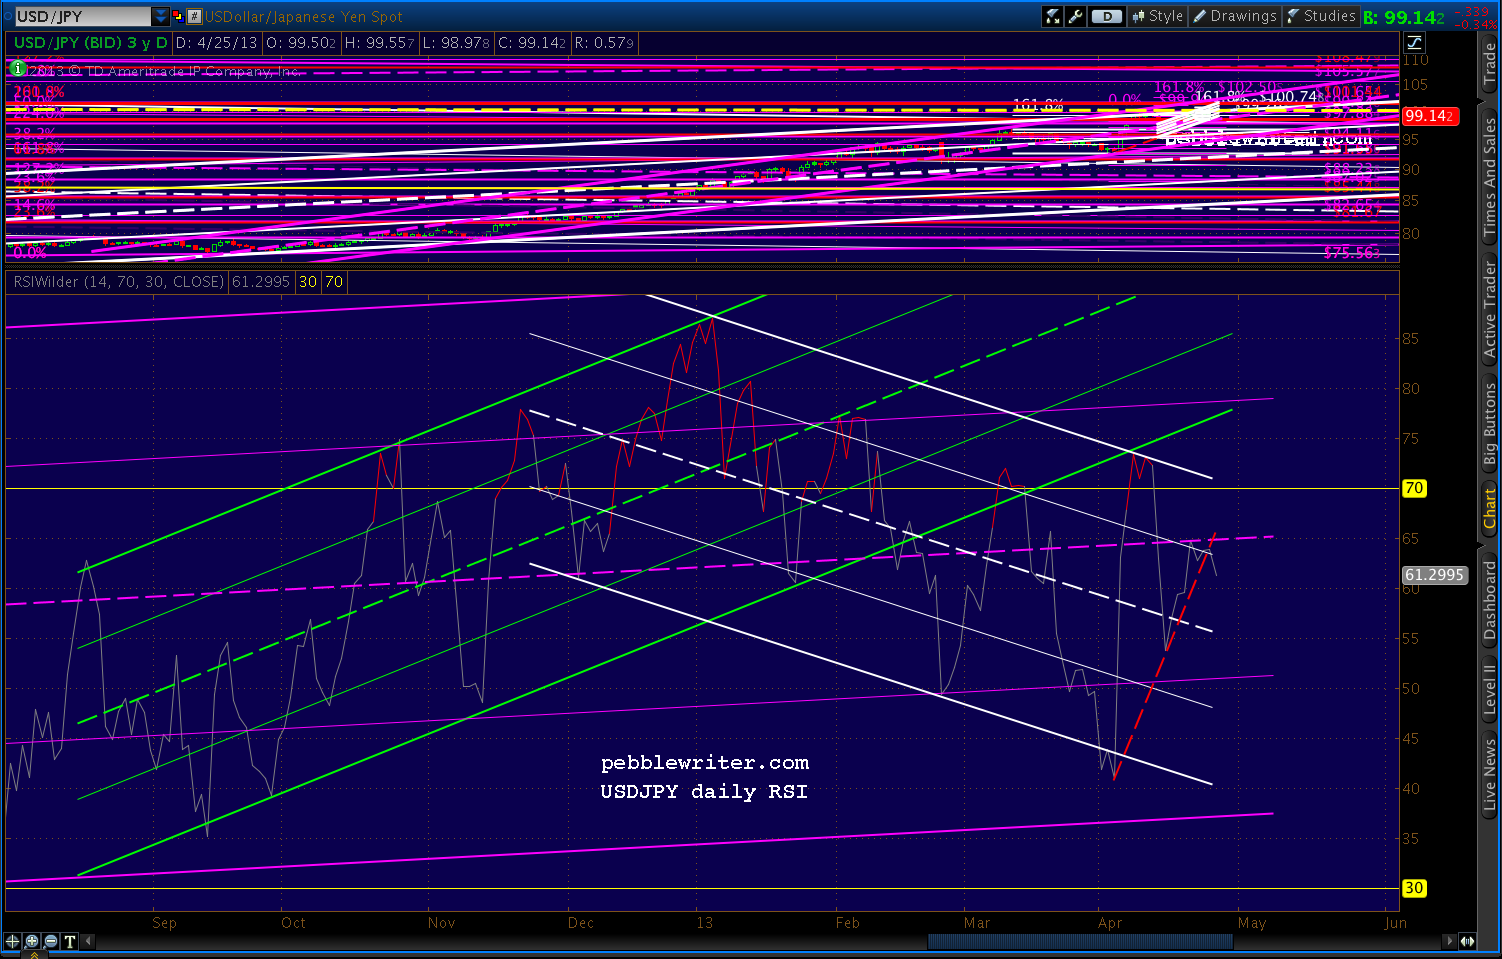
There's no guarantee it won't push through instead of retreating, but the RSI picture supports the danger of a significant retreat.

Daily RSI has backtested the broken yellow channel twice, but the trend is clearly down -- with the latest push being rebuffed by the purple midline.


And, a close-up reveals that a breakdown has already started.


Friday, March 22, 2013

Anatomy of a Market Top

reposted from pebblewriter.com~

The 2000 top shows just how "messy" tops can be.  Here's the finished picture in perfect hind-sight.  It's a very crowded chart, but every single pattern had a say in how the top unfolded.

SPX had zoomed from 442 to 1478 in about 5 years, a not-too-shabby 234% gain for an annually compounded 27%.


Once SPX broke out of the falling purple channel, it had "permission" to pursue several harmonic patterns in the works.  SPX shot up 66 points in that one day -- blowing through every Fib level between .618 and 1.000.

It finally came to rest at 1458, completing a Bat Pattern at the purple .886.  But, the small white 1.272 was just above at 1477, as was the rising purple channel midline and the 1.272 from a much larger pattern seen below.

An IH&S target waited at 1497 - tantalizingly close to a nice round number of 1500.  And, the all-time high of 1478 from two months earlier beckoned.


SPX got up to 1477.33 before reacting, falling to 1466 over the next two days.  Close, but not quite.  Someone watching closely might have noticed the Flag Pattern it constructed, targeting 1562.  Someone else probably pointed out the biggest Crab Pattern target of all -- the 1.618 extension of the 13% correction from 1420 to 1233 from Jul-Oct 1999.

On Mar 21, 2000 SPX shot up through the channel midline, the cluster of Fibs around 1477 and, importantly, the 1478 high and raced up toward those higher targets.

On Mar 24, it reached 1552.87, which cleared the IH&S target at 1497, the purple 1.272 at 1519 and the last remaining Crab Pattern at 1535.  What ultimately stopped it?  The .75 line from the big purple channel dating back to Jul 1999 -- almost to the penny.

Total move: 17% and 227 points in 20 sessions.  Could it happen again?  Stay tuned.

*   *   *   *   *   *   *   * 

 Join pebblewriter.com, one of the most successful [see: results] new investment blogs on the planet, for daily in-depth market coverage, analysis and forecasts.  For more information, CLICK HERE.


Thursday, March 21, 2013

Charts I'm Watching: Mar 20, 2013

~reposted from pebblewriter.com:

9:00 AM EDT

The ECB's vow to do "whatever it takes"apparently translates into strong-arming the Russians into bailing out Cyprus.  Still no break out on the EURUSD, though.


It makes sense to play along with the upside on SPX, but keep stops close.  Not sure whether this rally will have legs.  The dollar looks like it's finding support here.


UPDATE:  09:33 AM

Just reached the .786 of the move down from 1563.62 (purple) and the .886 of our proposed path to 1576 (white.)  Full short again, stops at 1561ish.  Revised charts in a few...


UPDATE:  09:55 AM

The daily chart tells the story.  The most prominent features include:
  • large 1474-1343 Crab Pattern completion at 1555.57 (yellow)
  • large 1370-1074 Crab Pattern completion at 1553.39 (red)
  • small 1530-1485 Crab Pattern completion at 1559.32 (white)
  • small broken rising wedge -- at 1563 top
  • long-term TL and channel top (white) at 1560


UPDATE:  11:10 AM

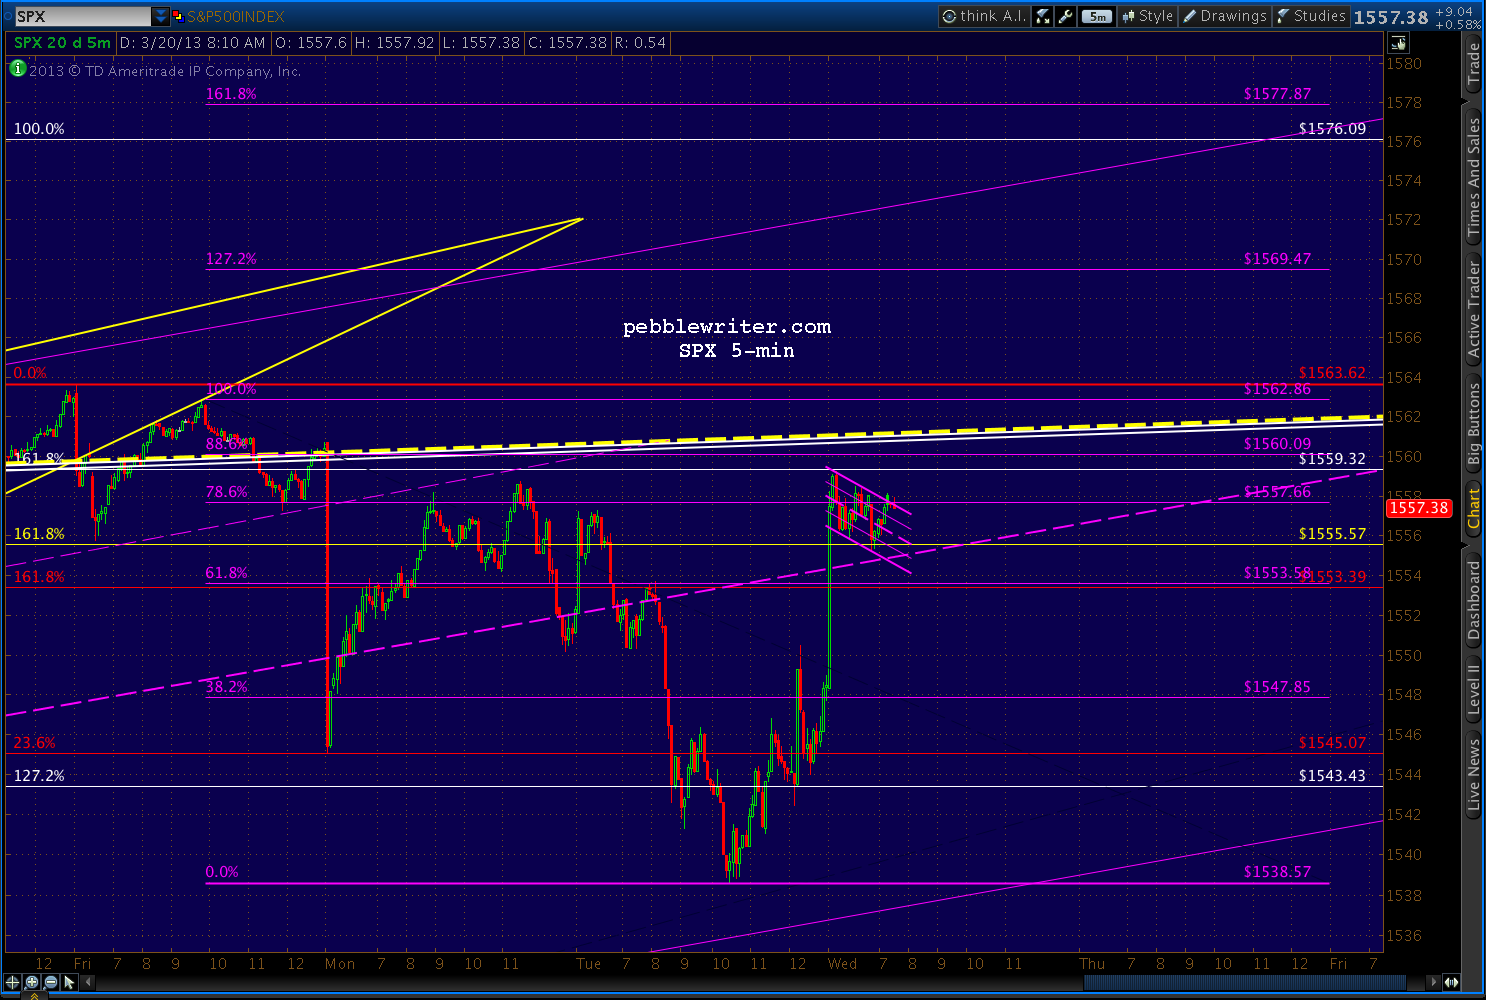
SPX continues to position itself for a run at 1576.  The 5-min chart shows a small potential Crab Pattern with a 1.618 at 1577 and a Flag Pattern targeting 1576.

It has broken back above and backtested the purple channel midline and retraced nearly .886 of its drop from 1562 and a little more than .786 of the drop from 1563.62.


While it's positioned for 1576, there is no more certainty than when we first broke 1555 on the Mar 14 overnight ramp job.  The large, bearish patterns listed above have still not produced the kind of sell-off they normally do.

And, it's all because of the Fed's media's cheerleaders' TPTB's determination to be able to tout a swell new all-time high for the S&P 500.

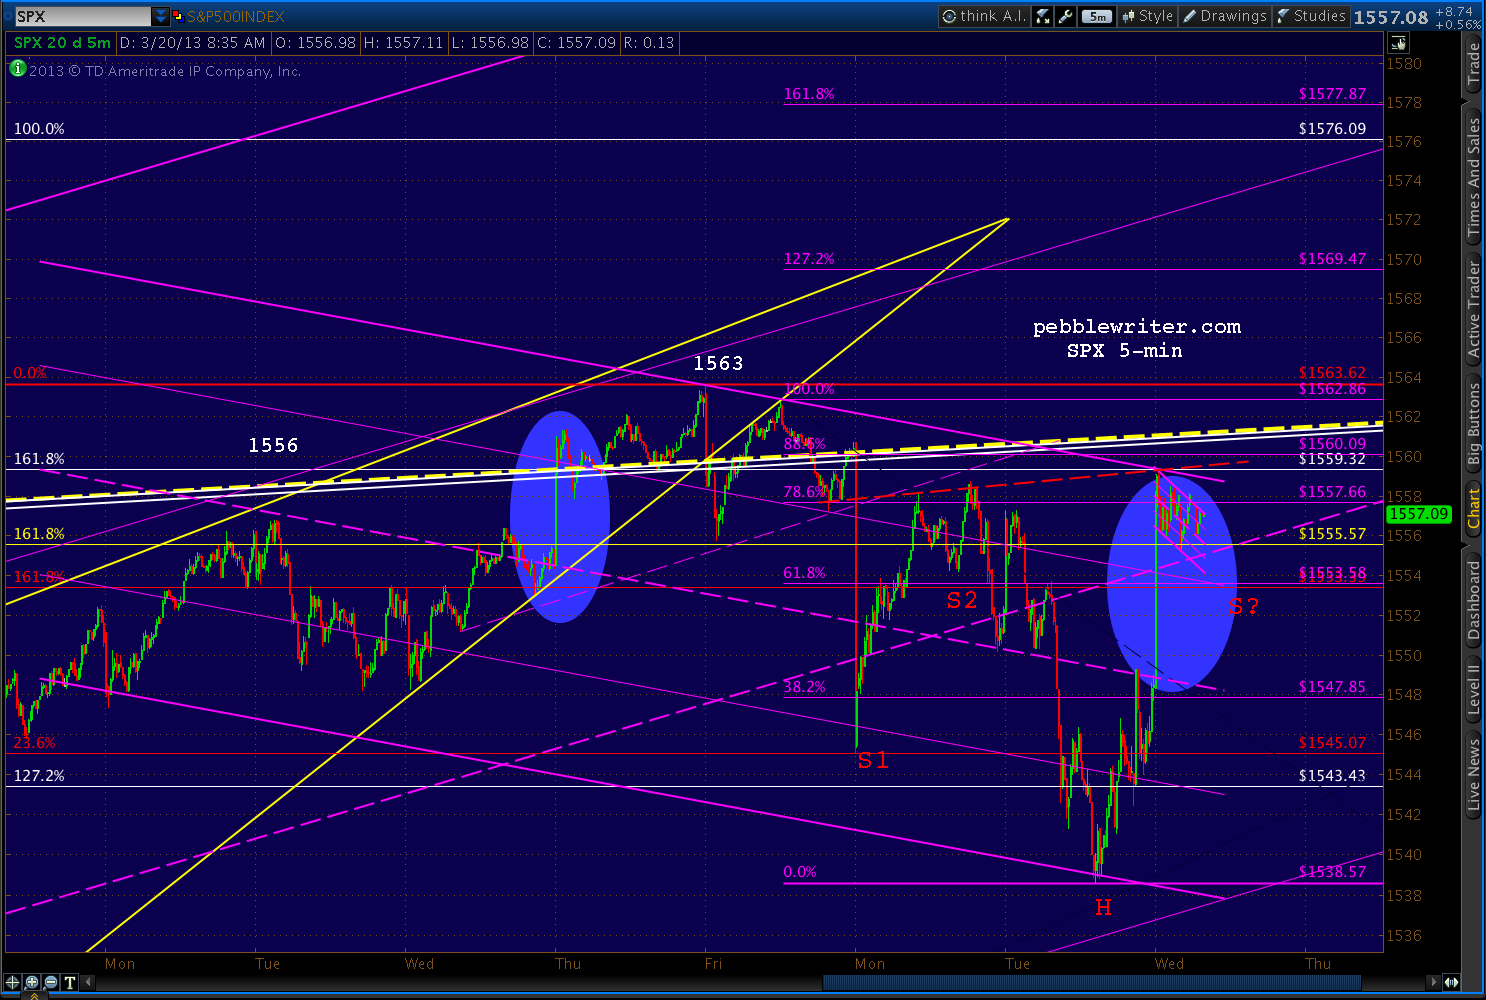
In addition to the little Crab Pattern (purple) that targets 1577 and the flag pattern targeting 1576, there's an obvious effort to construct an IH&S pattern targeting 1580.  It could benefit from a lower right shoulder, but bulls must beware of crossing back beneath the purple channel midline.


The S2 shoulder isn't quite legit, BTW, as the neckline doesn't quite connect on the left side.  But, the S1 shoulder is quite a ways down there.  So, if the pattern plays out, be prepared for some serious chop.

UPDATE:  1:00 PM

With the FOMC announcement a little over an hour away, let's resume our chat about the big picture.  If it seems like we're "lost in the reeds" as one reader so aptly put it, it's because we are.

The large Crab Pattern completions promised a good-sized dump last week at 1553/1555.  Instead we've inched higher.  Why?  These patterns completed in the middle of harmonic no-man's land: the gap between an .886 retracement and a double-top.

The .886 retracement (of the 1576-666 crash) produced a 9% reversal back on Sep 14.  Since then, SPX came screaming back to retake the 1576 all-time high -- but slammed into the Crab Patterns and a very important channel line along the way.

Now, it doesn't know what to do.

Double tops usually produce reversals, too -- sometimes meaningful ones as we found out on October 11, 2007, when SPX scooted up past the 1552 top from 2000 by a whopping 24 points before dropping 58%. 

The 2000 top itself shows just how "messy" tops can be.  Here's the finished picture in perfect hind-sight.  It's a very crowded chart, but every pattern on there had a say in how the top unfolded.


Once SPX broke out of the falling purple channel, it had "permission" to pursue several harmonic patterns in the works.  SPX shot up 66 points in that one day -- blowing through every Fib level between .618 and 1.000.

It finally came to rest at 1458, completing a Bat Pattern at the purple .886.  But, the small white 1.272 was just above at 1477, as was the rising purple channel midline and the 1.272 from a much larger pattern seen below.  An IH&S target waited at 1497 - tantalizingly close to the nice round number of 1500.  The all-time high of 1478 from two months earlier beckoned.


SPX got up to 1477.33 before reacting, falling to 1466 over the next two days.  Close, but not quite.  Someone watching closely might have noticed the Flag Pattern it constructed, targeting 1562.  Someone else probably pointed out the biggest Crab Pattern target of all -- the 1.618 extension of the 13% correction from 1420 to 1233 from Jul-Oct 1999.

I don't know what the catalyst was, but on Mar 21, 2000 (that date sounds awfully familiar) SPX shot up through the channel midline, the cluster of Fibs around 1477 and, importantly, the 1478 high and raced up toward those higher targets.

On Mar 24, it reached 1552.87, which cleared the IH&S target at 1497, the purple 1.272 at 1519 and the last remaining Crab Pattern at 1535.  What ultimately stopped it?  The .75 line from the big purple channel dating back to Jul 1999 -- almost to the penny.

Total move: 17% and 227 points in 20 sessions.  Could it happen again?

continued for members...

*   *   *   *   *   *   *   *

For full access to live market commentary throughout every trading day, subscribe to pebblewriter.com. 


Monday, March 18, 2013

Mad Men, Liars & Thieves

reposted from pebblewriter.com

It's hard to believe the numb nuts running the big show in the euro zone could be so stark-raving mad.  Raising taxes on countries with 25% unemployment seems positively brilliant compared to the idea of confiscating 10% of bank deposits -- especially those that are supposedly insured.

Get ready for the media interpreters who assure us "it's only Cyprus" --  which reminds me an awful lot of "it's only Bear Stearns" or "it's only Lehman."

The issue, of course, isn't the size of the depositor base in Cyprus banks.  It's the effect this action will have on depositors in Portugal, Spain and Italy.

 By now, even the most clueless depositors have to be wondering just how safe their deposits are.  The smart ones already know.  And, the brilliant ones moved their money a long time ago.

This bone-headed action also calls into question the ECB's willingness and/or ability to support troubled nations/banks.  If they can't float a lousy $13 billion to bail out Cyprus, how will they react when other, larger systemic risks pop back up?

And, last but certainly not least, what effect will this action have on the $700+ trillion derivatives market?  It's a spiders nest of complicated agreements whereby one party guarantees another that credit quality/interest rates/etc. won't slip past a certain level.

These private contracts are bought and sold countless times, to the point where no one usually knows the true exposure of any given player until it's too late.  When a bank fails, it's very difficult to discern how many counterparties will be affected.  It quite rightly shakes confidence in the entire system.

Cyprus is a reminder that the euro zone is not "fixed."  It's a reminder that much more is needed to fulfill the promise of "whatever it takes."  And, it's a reminder that the Fed and the ECB either don't have as much control as they'd like us to think, or are losing interest in preventing every little hiccup along the way.

*  *  *  *  *  *  *  *

The dollar may have just completed the transformation we discussed at length Friday -- reverting back to the risk-off safe haven to which we're accustomed.


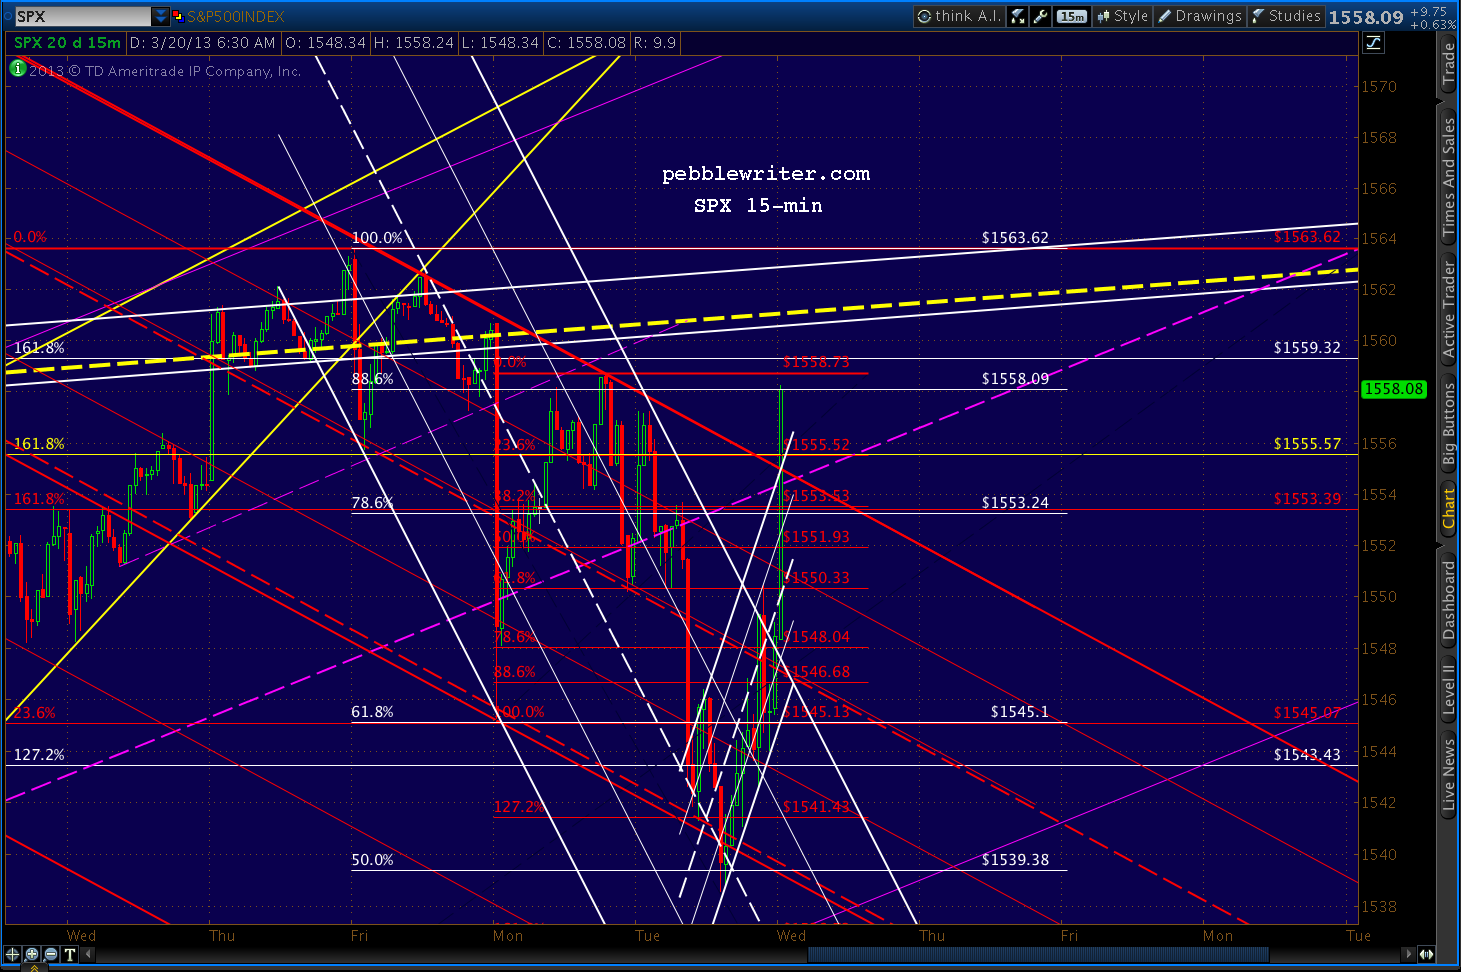
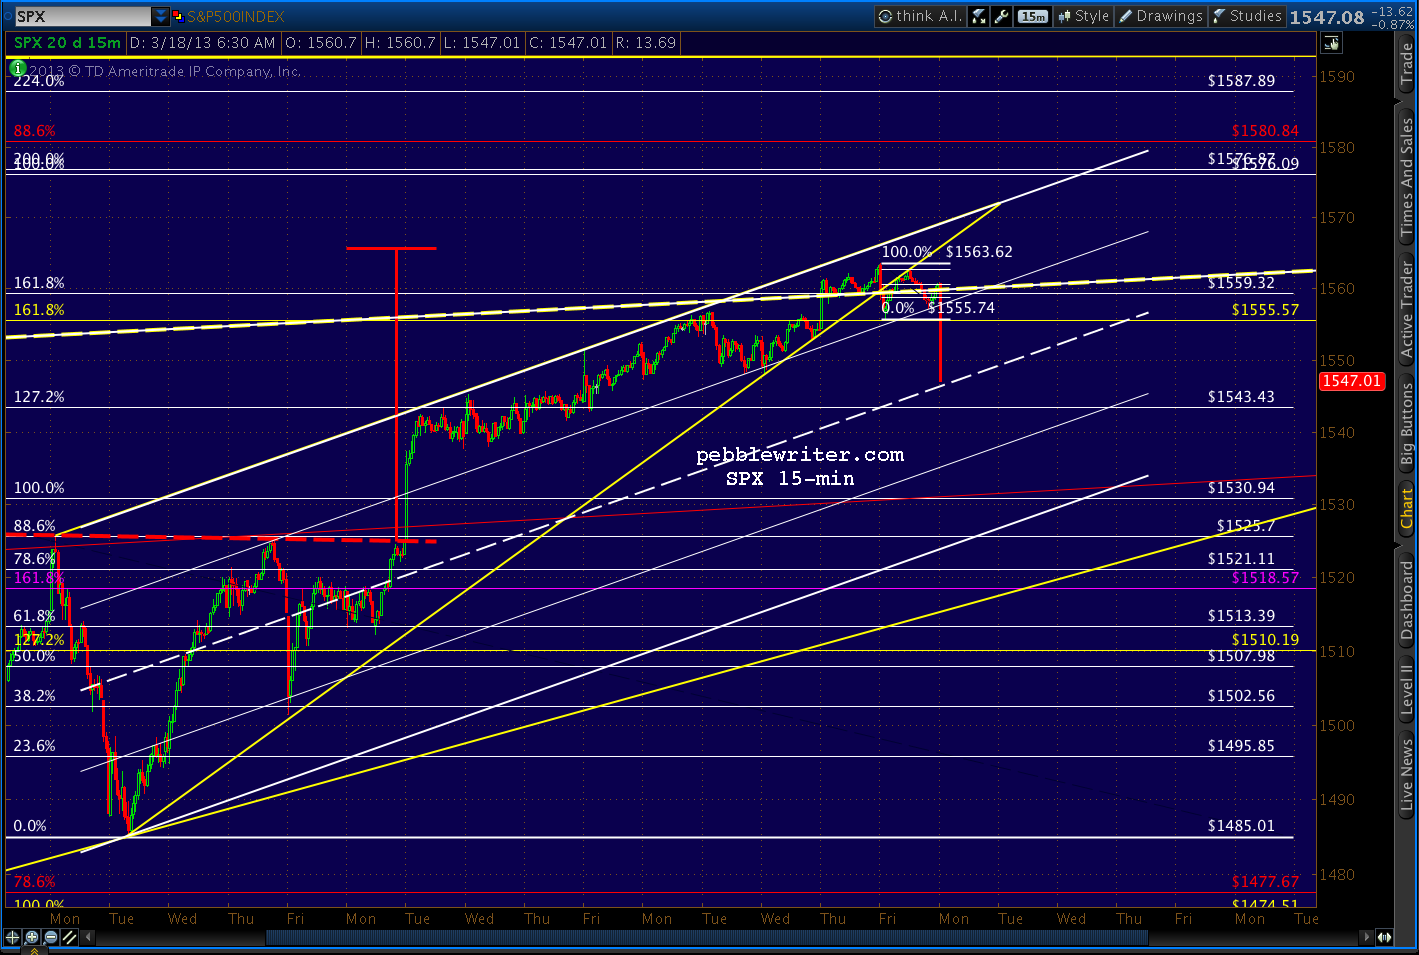
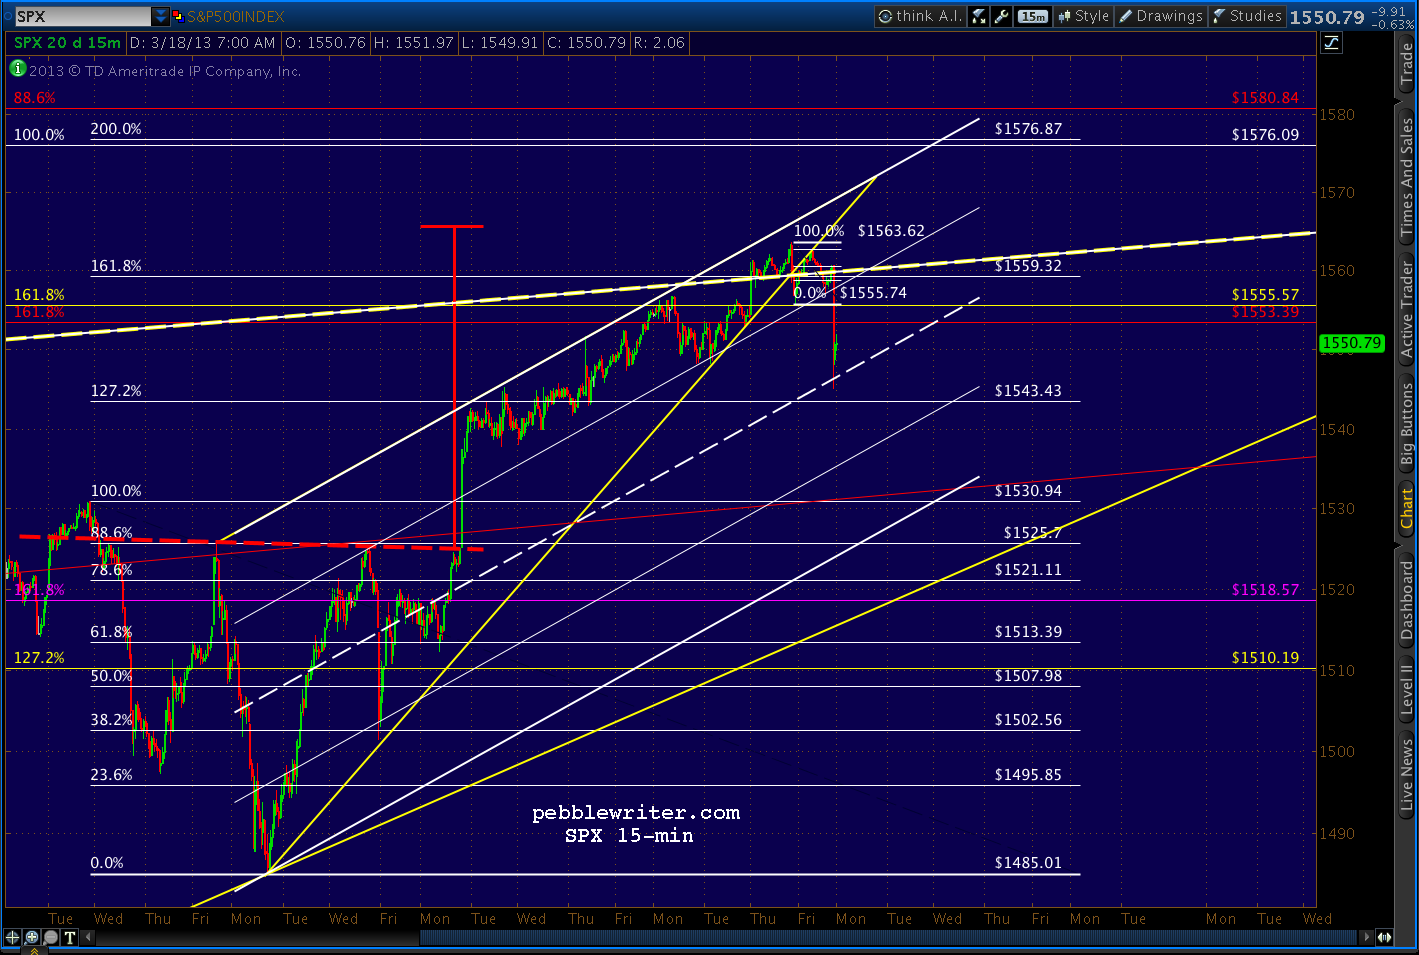
The smallest rising wedge on SPX has clearly broken down and should now try to establish a channel something like the one drawn below. Look for a playable bounce here around the midline between 1543.43 and 1546.


UPDATE:  10:10 AM

We got the expected bounce at 1545.13.  If the bears can keep the trend going, it should fail before the next higher channel line -- currently around 1558 -- or the yellow TL up at 1560.  But, of course, there's no reason it has to be more than 1553.39 (the 1.618 extension of the 1370-1074 correction in 2011) or 1552.19 (the .382 retracement of the move down from 1563.32.)


As legitimate as the little white channel above appears, it's merely a conjecture.  A pitch.  If Cramer & Co. can convince the average small investor to ignore the implications of Cyprus and embrace a market selling near all-time highs, the channel is proof of the absence of risk in the markets.

It coincides nicely with the midline of the larger purple channel that's guided SPX's upside since November.  To bulls, this morning's dip looks like nothing more than a successful test of the midline.


Here's a close-up, showing the tag of the .236 Fib (red) and slight push below the purple midline.  Important for the bullish case: (1)  the white 1.272 is even still intact, and (2) prices are re-testing the 1.618 Fib at 1553.39.

If SPX pushes higher than 1553.39, it reinforces the idea that the Crab Pattern set up by 2011's plunge from 1370 to 1074 is going to fail (8 points would be a failure.)  If it drops below, then the push up to 1563 can be characterized as a momentary blip of irrational exuberance.


The technical elephant in the room, of course, is whether or not SPX will continue to take a run at the previous high of 1576.  It's not as though bulls will throw in the towel over Cyprus.  Take the move down from 1563, for instance.


If this bounce from 1545 retraces all the way to the .786 at 1559.66, it will have set up a potential Butterfly Pattern that targets 1575.   Look for the little white channel to turn by the .500 (1554.38)  in order to construct another leg up.

UPDATE:  1:25 PM

Where does this morning's dump fit in with yesterday's LT charts from the last post [see: Do or Die]?

continued on pebblewriter.com...

Thursday, March 7, 2013

RUT: End of the Line?

RUT has reached the upper bound of a well-defined channel that dates back to 1998.


It could leak a few points higher in reaching for the top of the large rising wedge and one potential Butterfly Pattern target, but I suspect RUT has reached a turning point.

continued on pebblewriter.com...

Tuesday, March 5, 2013

After the Funding's Gone

~reposted from pebblewriter.com

After a scary drop in equity futures overnight, the market looks to open soft...but not exactly panicked. I remain short since 1525.34 on the 28th, but will continue to play any significant bounces that come our way.

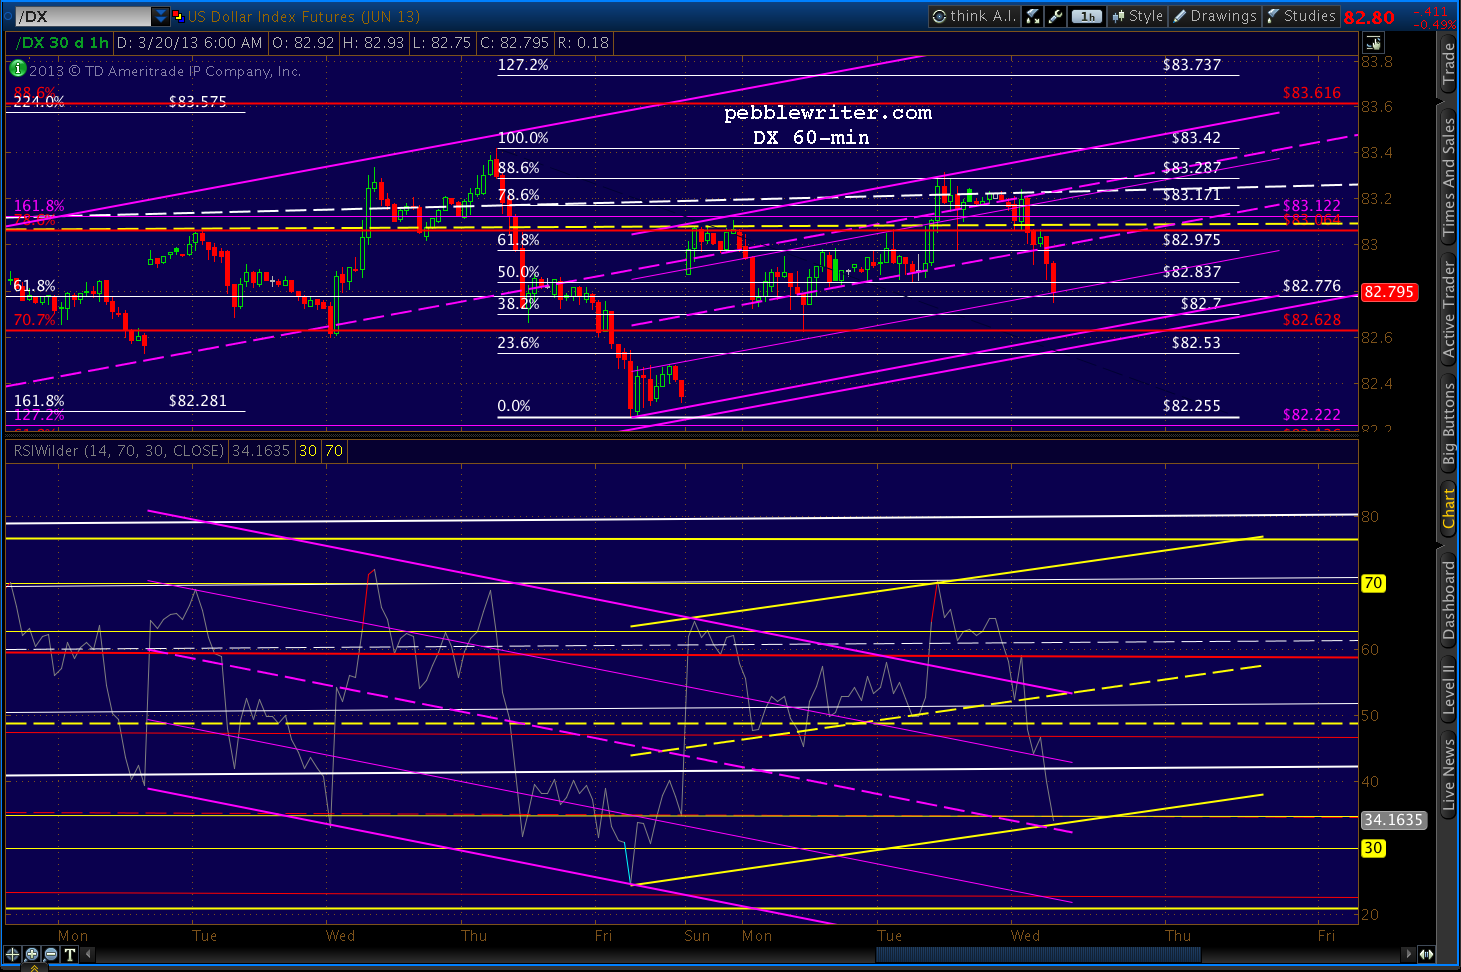
The dollar is still looking strong, reflecting both plenty of fear and euro weakness.  Note, DX reached our intermediate target range from last month (the red .618 @ 82.22 & white 1.618 at 82.28.)


The next level of resistance is the red .786 at 83.064 where it intersects with the purple 1.618 at 83.122.  The acceleration channel that's carried prices skyward since Feb 1 intersects that nexus this week.

Also intersecting there are two channel lines -- the large white midline and the much larger yellow midline -- seen here on the weekly chart.


Daily RSI still shows plenty of upside potential, though we've also seen some negative divergence start to creep into the picture.


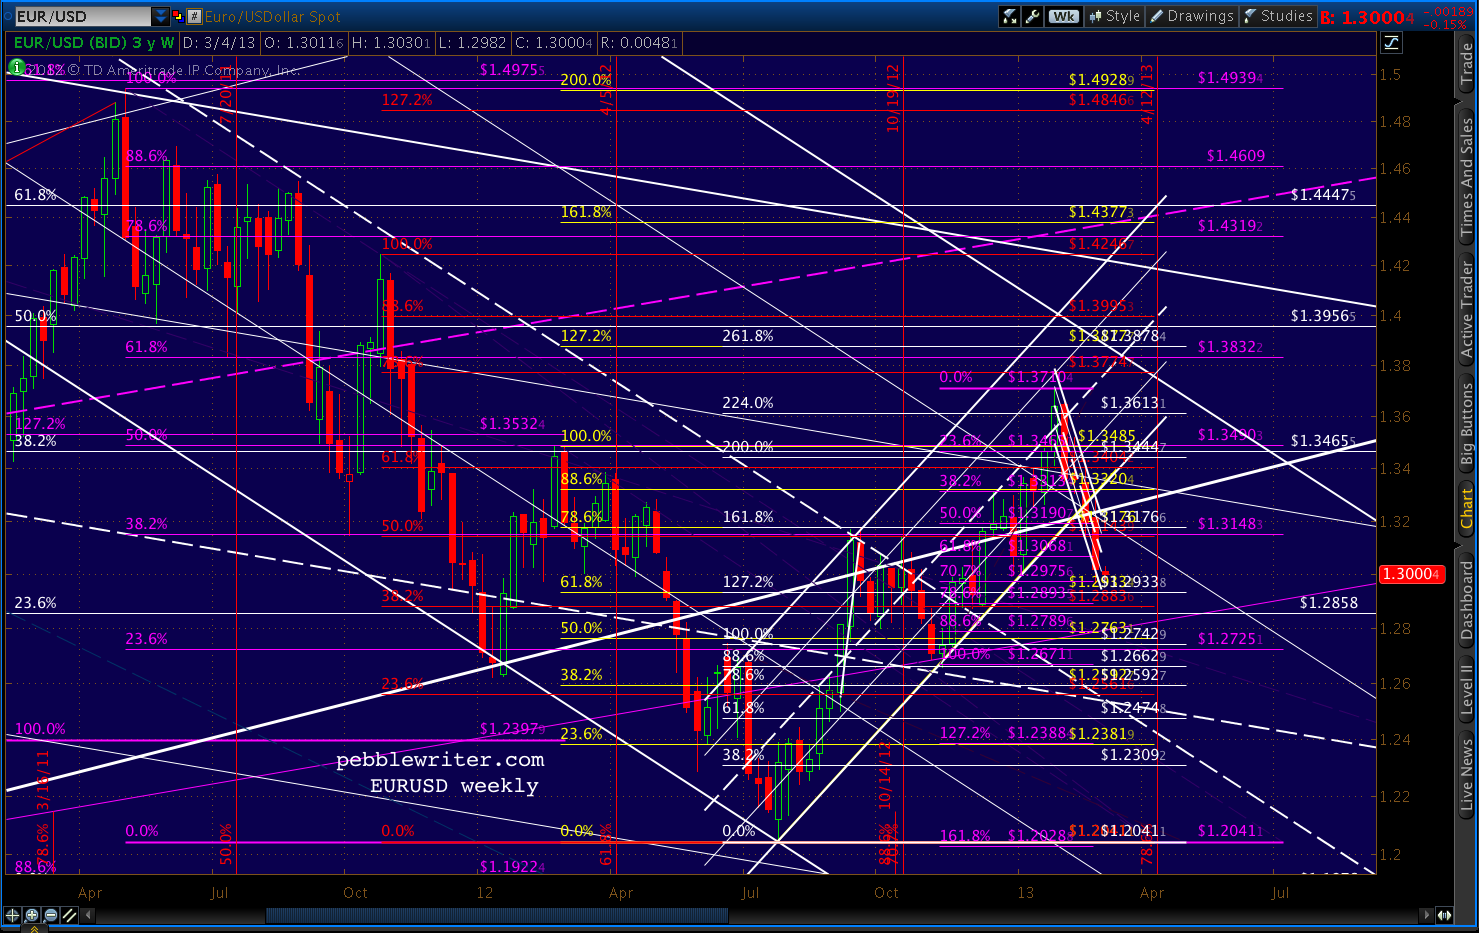
As noted back on Feb 21, the EURUSD has broken down from its rising channel (white) and has accelerated to the downside, breaking the Jan 4 1.2996 low and the psychologically important 1.30 level.


The intersection of the purple .618 and two white channels at 1.38 will have to wait (until my next visit across The Pond, no doubt.)


Losing the rising white channel hurts momentum quite a bit, but it's the drop back through the 75% line on the falling white channel that represents the bigger problem for the pair.

This channel dates all the way back to Dec 06. Reaching the top for the third time is still possible, of course, but it's that much harder now that the pair needs to retake the higher channel line and mount a fresh attack.

I've redrawn the falling white channel as red and will lower its top (for now) to reflect the brick wall it ran into.  I've also sketched in a more relaxed rising channel (light blue) that reflects potential channel support at current prices (the intersection of the falling red .75 and the rising light blue .25.)


I don't know whether the pair needs to retest the falling white midline or not.  The bottom of the new light blue channel intersects with the red .75 in mid-March.  Also there is the .25 of the very large rising purple channel, which provided a huge bounce in Jun 2010.  It's easier to see in the LT chart below.


Recall that we closed a long position and last went short at 1525.34.  From there, SPX fell nearly to our initial target (1496-1500), reaching 1501.48 Friday morning before the bounce to 1519.99.

As we discussed last week, the reversal at the red .786 could be the full extent of a corrective wave on the way lower (the B wave in an A-B-C)  that is meant to test the bottom of the white or purple channels.  But, it could also be the Point B in a Butterfly Pattern targeting 1531 or 1540.


continued on pebblewriter.com...