PEBBLEWRITER.COM IS LIVE!


*************** PEBBLEWRITER.COM IS LIVE! TO SIGN UP, CLICK HERE ***************


Showing posts with label DJIA. Show all posts

Thursday, April 25, 2013

The Best Laid Plans

The best laid plans of mice and men
Go often awry,
And leave us nothing but grief and pain,
For promised joy!
Robert Burns, 1785


ORIGINAL POST:  6:45 AM EDT

The wedges we've been watching on DX and EURUSD are playing out.  EURUSD has broken out...


...and DX has broken down.
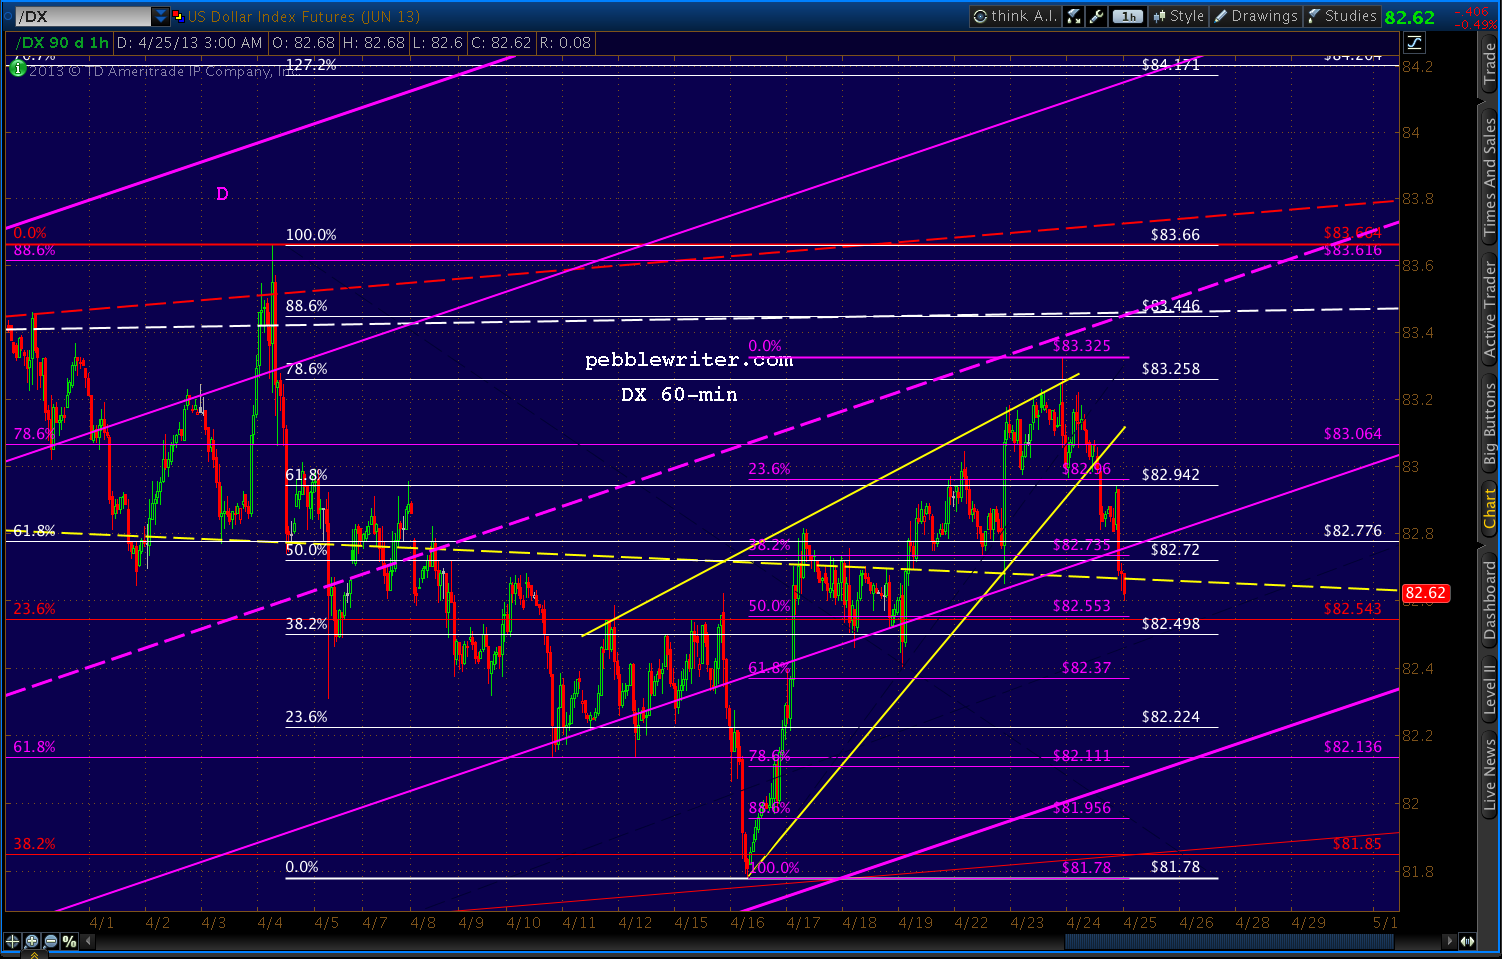

But, it's the USDJPY that I'm watching especially closely this morning.  It still hasn't broken 100 since our Apr 8 observation [USDJPY update] that it was running out of steam:
"...there is growing risk of a downturn as it approaches 100... it appears the pair might have hit at least interim resistance at today’s high."
It topped out 3 sessions later at 99.94, and two weeks later is in danger of a larger pullback.


Remember, weakening the yen was a critical element of the BOJ's stimulus program that was supposed to generate inflation, boost Toyota sales and send Japanese investment funds flooding into foreign markets.


Instead, Japanese investors are repatriating their funds from abroad -- a net Y9.5 trillion ($95 billion) since the first of the year.  Why?  As any US investor could tell you, QE might not inflate economies, but it sure as hell inflates markets.

The Nikkei 225 is up 65% since last October's lows....


...and, still hasn't even recovered 2/3 of its losses from the 2007 crash.  The Dow and the S&P 500, by contrast, have recovered all of them -- and, then some.  So, to many, the Nikkei still seems the better value.  It's hard to argue with success.

But, I'll do it anyway.  In reaching 14,020 a few hours ago, NKD tagged the .618 Fibonacci retracement of its 2007-2009 crash from 18,365 to 6990.
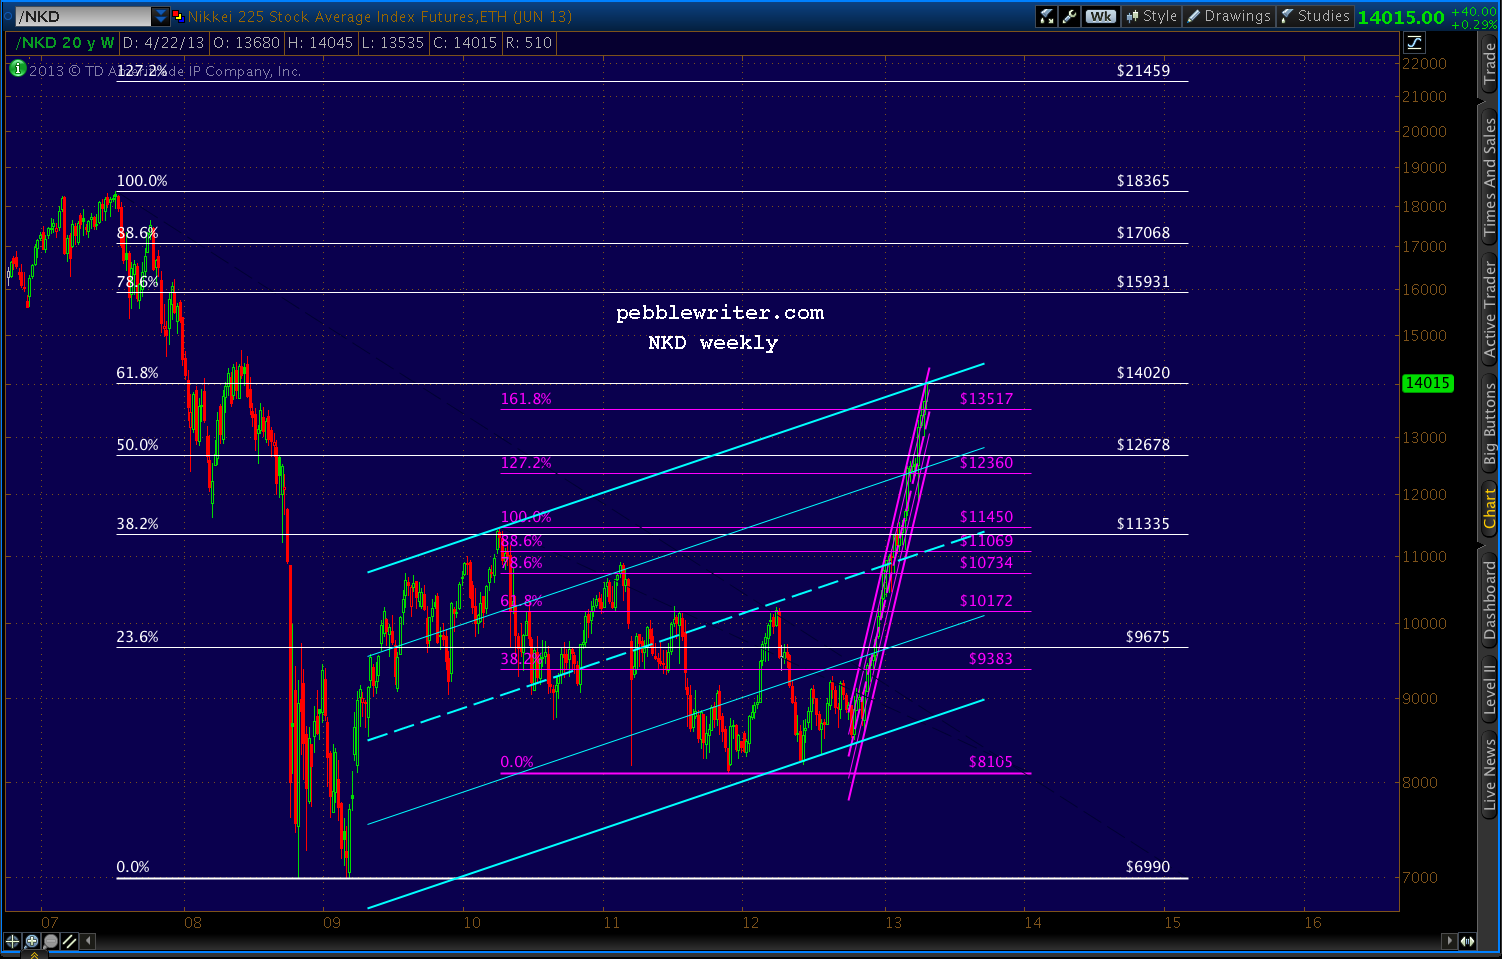

To those not familiar with harmonics, this tends to be a big deal.  When SPX reached the equivalent point in April 2010, it plunged 17%.  The DJIA fell almost 15%.  The USD, represented by DX, soared 9.3%.

But, the yen positively soared.  USDJPY started a 17-month slide that took the pair down 20% from 94.98 to 75.78.  NKD, which had just reached its .382 Fib, shed 23% over the next 4 months, eventually reaching almost 30% in Nov 2011.

Could the USDJPY's failure to break 100 be telling us something?  You better believe it.  I called a top a few weeks ago because the pair had reached several important Fib levels as well as the midline of an important channel (in yellow, below)...


...that dates back to 1995.
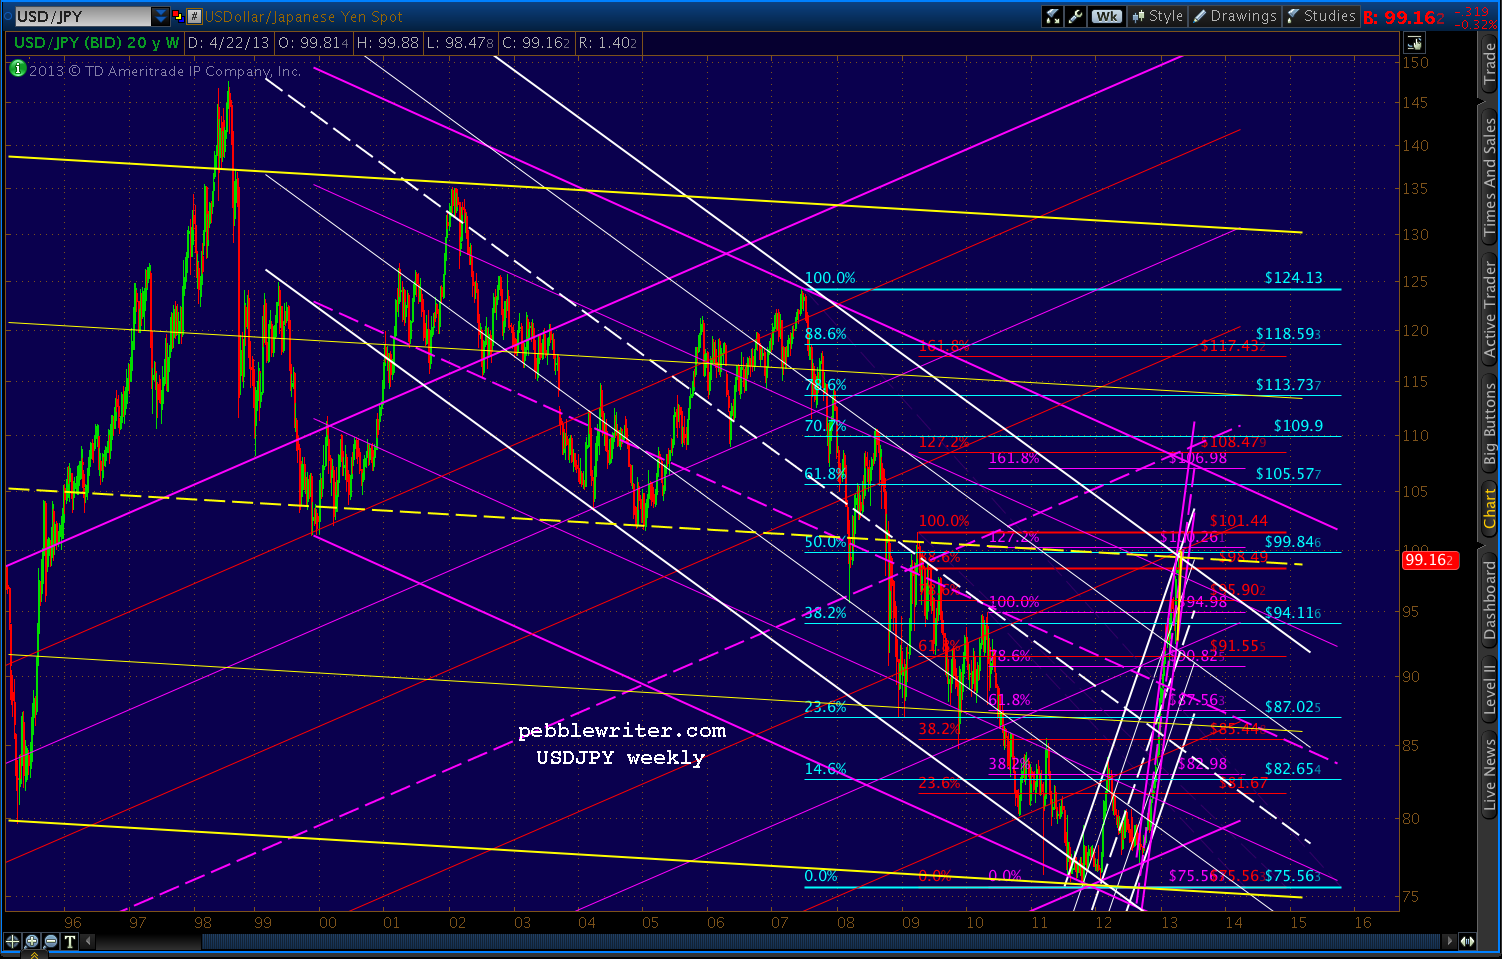

There's no guarantee it won't push through instead of retreating, but the RSI picture supports the danger of a significant retreat.

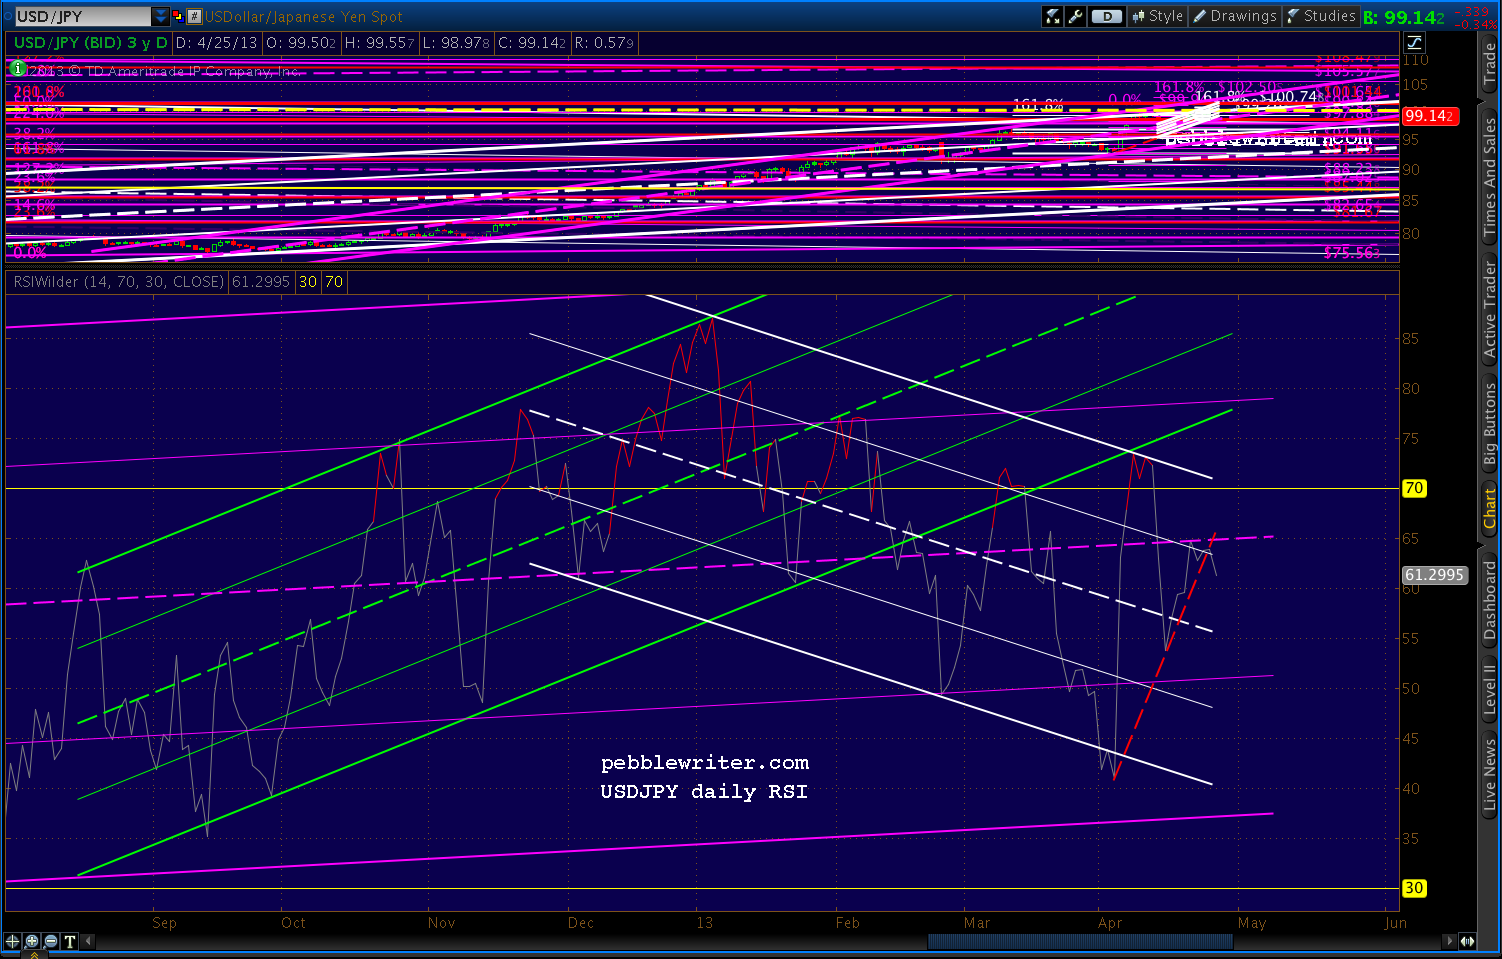
Daily RSI has backtested the broken yellow channel twice, but the trend is clearly down -- with the latest push being rebuffed by the purple midline.


And, a close-up reveals that a breakdown has already started.


Friday, March 22, 2013

Anatomy of a Market Top

reposted from pebblewriter.com~

The 2000 top shows just how "messy" tops can be.  Here's the finished picture in perfect hind-sight.  It's a very crowded chart, but every single pattern had a say in how the top unfolded.

SPX had zoomed from 442 to 1478 in about 5 years, a not-too-shabby 234% gain for an annually compounded 27%.


Once SPX broke out of the falling purple channel, it had "permission" to pursue several harmonic patterns in the works.  SPX shot up 66 points in that one day -- blowing through every Fib level between .618 and 1.000.

It finally came to rest at 1458, completing a Bat Pattern at the purple .886.  But, the small white 1.272 was just above at 1477, as was the rising purple channel midline and the 1.272 from a much larger pattern seen below.

An IH&S target waited at 1497 - tantalizingly close to a nice round number of 1500.  And, the all-time high of 1478 from two months earlier beckoned.


SPX got up to 1477.33 before reacting, falling to 1466 over the next two days.  Close, but not quite.  Someone watching closely might have noticed the Flag Pattern it constructed, targeting 1562.  Someone else probably pointed out the biggest Crab Pattern target of all -- the 1.618 extension of the 13% correction from 1420 to 1233 from Jul-Oct 1999.

On Mar 21, 2000 SPX shot up through the channel midline, the cluster of Fibs around 1477 and, importantly, the 1478 high and raced up toward those higher targets.

On Mar 24, it reached 1552.87, which cleared the IH&S target at 1497, the purple 1.272 at 1519 and the last remaining Crab Pattern at 1535.  What ultimately stopped it?  The .75 line from the big purple channel dating back to Jul 1999 -- almost to the penny.

Total move: 17% and 227 points in 20 sessions.  Could it happen again?  Stay tuned.

*   *   *   *   *   *   *   * 

 Join pebblewriter.com, one of the most successful [see: results] new investment blogs on the planet, for daily in-depth market coverage, analysis and forecasts.  For more information, CLICK HERE.


Tuesday, January 29, 2013

DJIA: Any Time Now

Last week, with the DJIA at 13,866, we took a look at the potential for a double-top and a Dow Theory non-confirmation with the Transports [see: The Dow - Time to Double Down.]

Critical levels included the rising wedge upper bound, not to mention a whole slew of approaching Harmonic targets.


Don't look now, but DJIA is only a few points away from tagging the upper bound of the rising wedge, the 2.24 of a Crab Pattern (in white below), and the 1.272 of a Butterfly Pattern (red.)

The double-top up at 14,198 and some larger Harmonic patterns (14,145-14,201) are still a possibility, but this balloon looks ready to pop.


Pebblewriter.com combines Harmonic Patterns with traditional chart patterns and technical analysis.  For more on our process and results, visit pebblewriter.com.


Friday, January 25, 2013

The Dow: Time to Double Down?

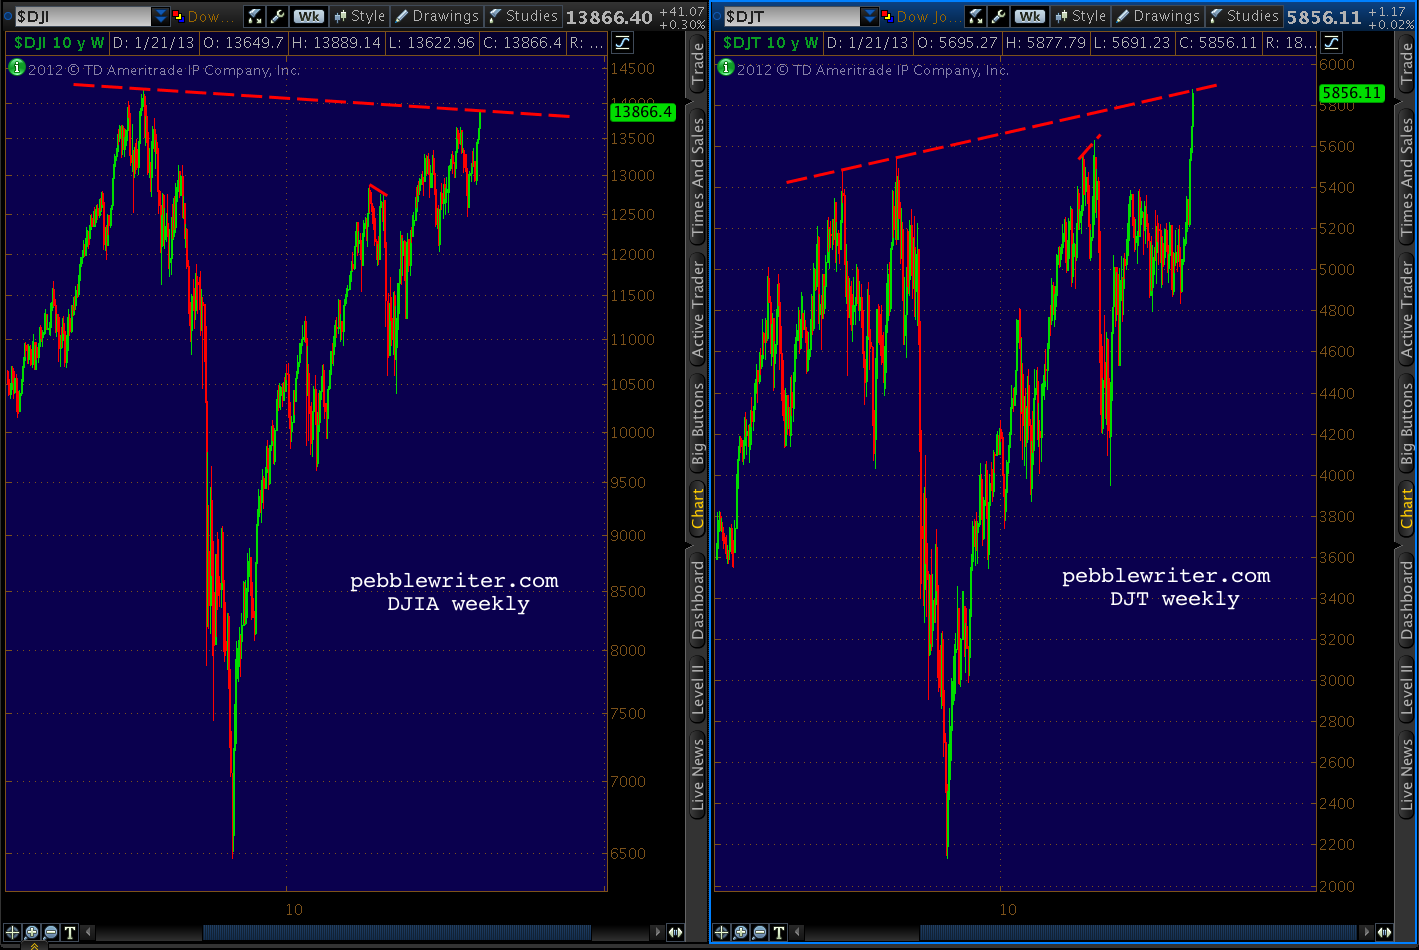
Many are watching the Dow Transports' recent all-time highs, wondering if Dow Theory suggests new highs for the DJIA as well.

Without wading into the debate over which interpretation of the theory holds water and which are all wet, I think it's important to recognize that the DJIA is one of those indices not making new all-time highs lately.

Should the Industrials not break above 14,198.10, this would be considered a Dow Theory non-confirmation, at least on a larger scale.  The last time this happened was in July of 2011, when the Transports made a new high of 5627.85 and the DJIA failed to best its May 2 12,876 high.

We can argue about cause and effect, but there's no argument about what happened next.


Eighteen months later, the DJT has again broken out to new all-time highs.  DJIA has not.  Here's the current visual, which shows the current degree of divergence is much larger than back then.


The Industrials, in fact, are a great candidate for a double-top.


Drilling down, we can see DJIA has nearly completed a Crab Pattern at the Fibonacci 161.8% extension (14,201.84) of the July-October 2011 crash (the white pattern.)


It intersects nearly perfectly with the previous 2007 high of 14,198.10 at the very point where the purple channel top and white 25% channel line also intersect.  But, it need not even reach that level to be considered a double top (within 1%.)

And, only a few points away we find a Butterfly Pattern target (small red pattern) at 13,985.65 and a Crab Pattern target (in white) of 13,963.50.


The last leg up in the move since October 2011 has been 1424 points -- roughly 87% of the leg 3 rally between June and September of 2012.  A Fibonacci 88.6% of the leg 3 rally would register at 13,912 -- well within the margin of error for any of the harmonic patterns mentioned above, and only 16 points above today's high.


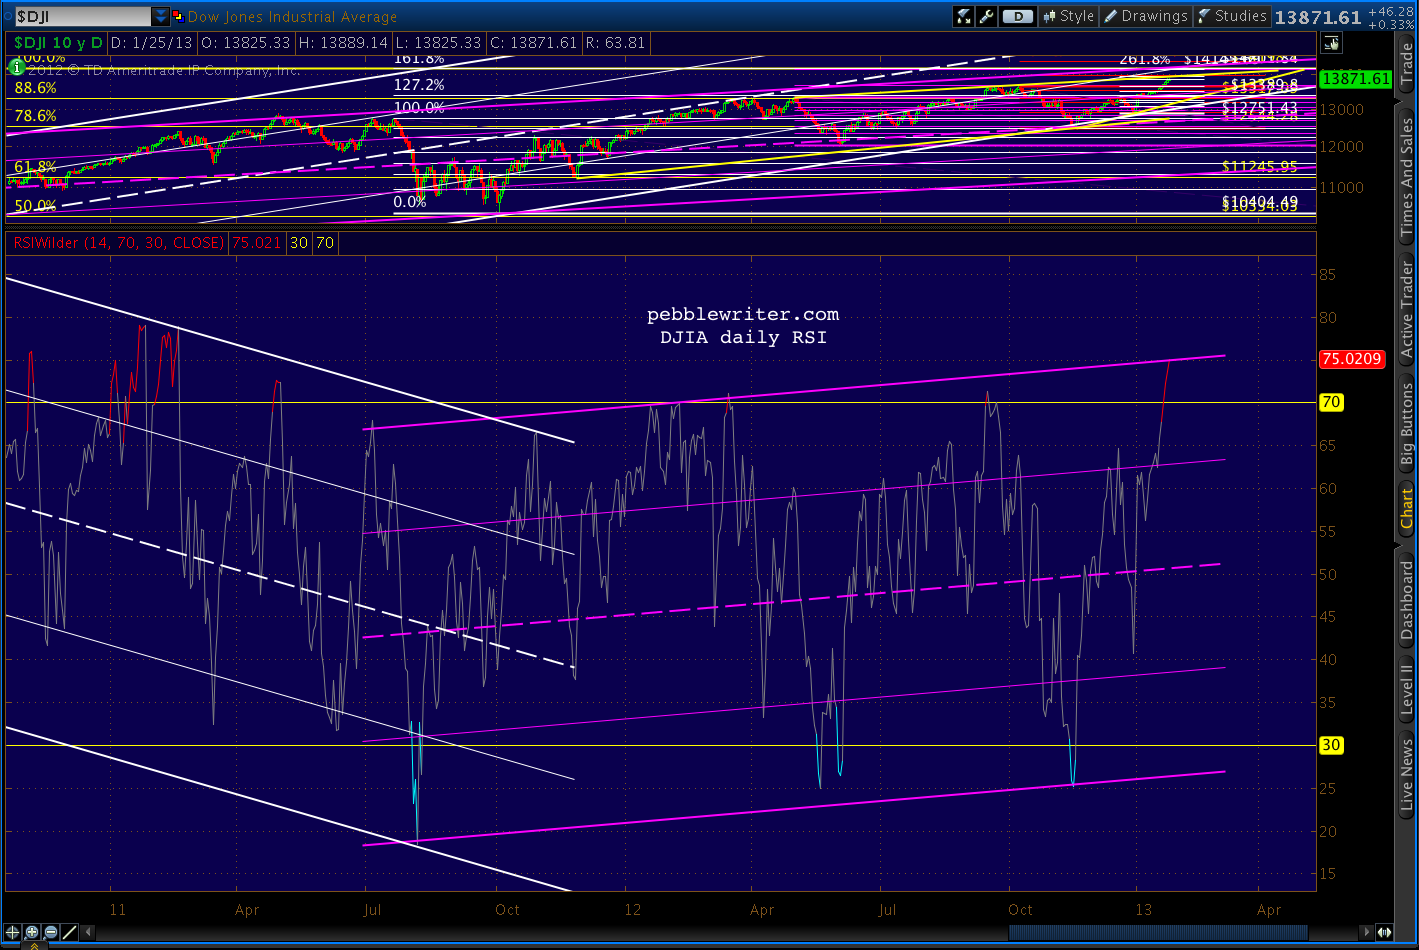
And, for those who, like me, love to channel stuff, the DJIA's daily RSI has its own bearish tale to tell.


Could DJIA blow through 14,200 confirm the Transports' all-time high and spoil the bears' party?  Of course.  There are still plenty of earnings reports to sift through, including AMZN, CAT, FB, YHOO, IP, PFE and F in the next few days.  We could get great Durable Goods numbers Monday, Case-Shiller Home Price Index on Tuesday, or a bullish FOMC outcome on Wednesday.

But, anyone counting on new all-time highs should remember July 2011 and consider protecting their downside.