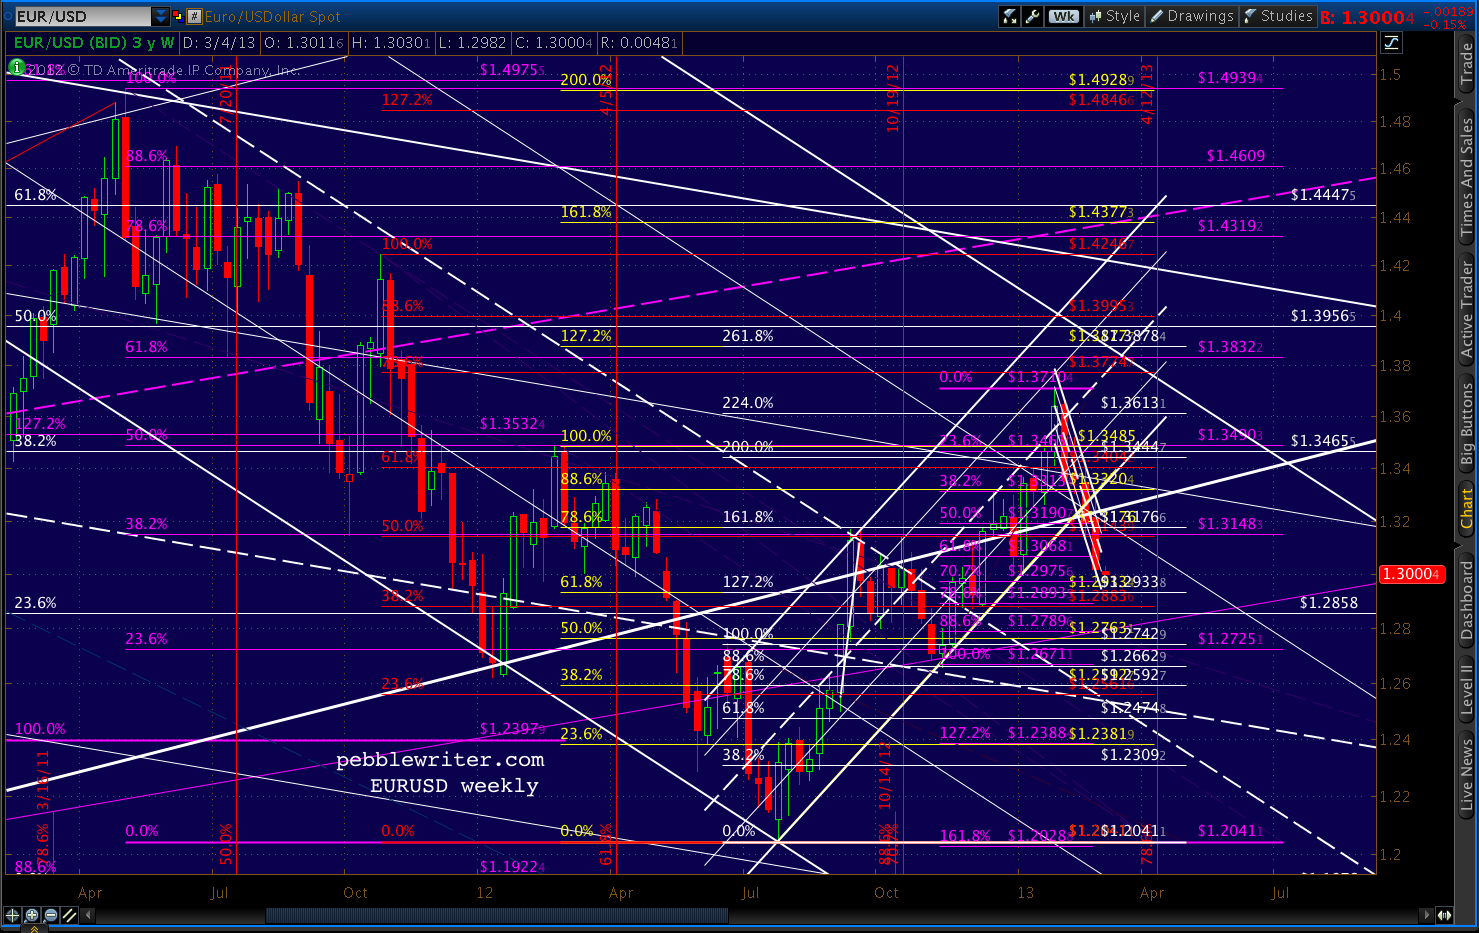
~reposted from pebblewriter.com
After a scary drop in equity futures overnight, the market looks to open soft...but not exactly panicked. I remain short since 1525.34 on the 28th, but will continue to play any significant bounces that come our way.
The
dollar is still looking strong, reflecting both plenty of fear and euro
weakness. Note, DX reached our intermediate target range from last
month (the red .618 @ 82.22 & white 1.618 at 82.28.)
The
next level of resistance is the red .786 at 83.064 where it intersects
with the purple 1.618 at 83.122. The acceleration channel that's
carried prices skyward since Feb 1 intersects that nexus this week.
Also
intersecting there are two channel lines -- the large white midline and
the much larger yellow midline -- seen here on the weekly chart.
Daily
RSI still shows plenty of upside potential, though we've also seen some
negative divergence start to creep into the picture.
As
noted back on Feb 21, the EURUSD has broken down from its rising
channel (white) and has accelerated to the downside, breaking the Jan 4
1.2996 low and the psychologically important 1.30 level.
The
intersection of the purple .618 and two white channels at 1.38 will
have to wait (until my next visit across The Pond, no doubt.)
Losing
the rising white channel hurts momentum quite a bit, but it's the drop
back through the 75% line on the falling white channel that represents
the bigger problem for the pair.
This
channel dates all the way back to Dec 06. Reaching the top for the
third time is still possible, of course, but it's that much harder now
that the pair needs to retake the higher channel line and mount a fresh
attack.
I've
redrawn the falling white channel as red and will lower its top (for
now) to reflect the brick wall it ran into. I've also sketched in a
more relaxed rising channel (light blue) that reflects potential channel
support at current prices (the intersection of the falling red .75 and
the rising light blue .25.)
I
don't know whether the pair needs to retest the falling white midline
or not. The bottom of the new light blue channel intersects with the
red .75 in mid-March. Also there is the .25 of the very large rising
purple channel, which provided a huge bounce in Jun 2010. It's easier
to see in the LT chart below.
Recall
that we closed a long position and last went short at 1525.34. From
there, SPX fell nearly to our initial target (1496-1500), reaching
1501.48 Friday morning before the bounce to 1519.99.
As
we discussed last week, the reversal at the red .786 could be the full
extent of a corrective wave on the way lower (the B wave in an A-B-C)
that is meant to test the bottom of the white or purple channels. But,
it could also be the Point B in a Butterfly Pattern targeting 1531 or
1540.


