PEBBLEWRITER.COM IS LIVE!


*************** PEBBLEWRITER.COM IS LIVE! TO SIGN UP, CLICK HERE ***************


Thursday, April 25, 2013

The Best Laid Plans

The best laid plans of mice and men
Go often awry,
And leave us nothing but grief and pain,
For promised joy!
Robert Burns, 1785


ORIGINAL POST:  6:45 AM EDT

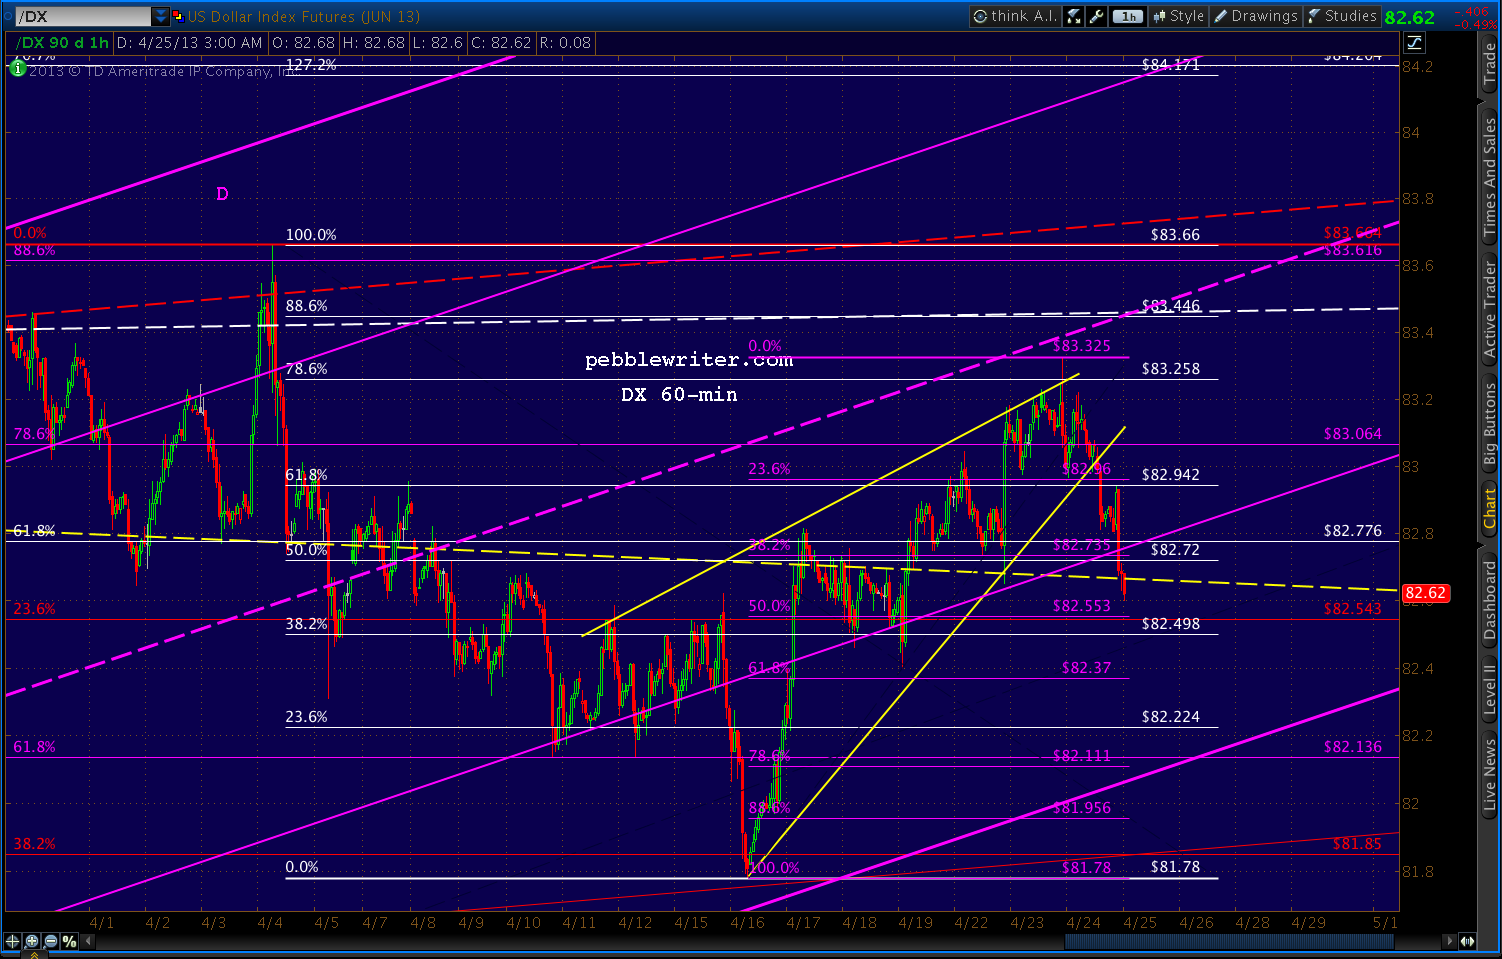
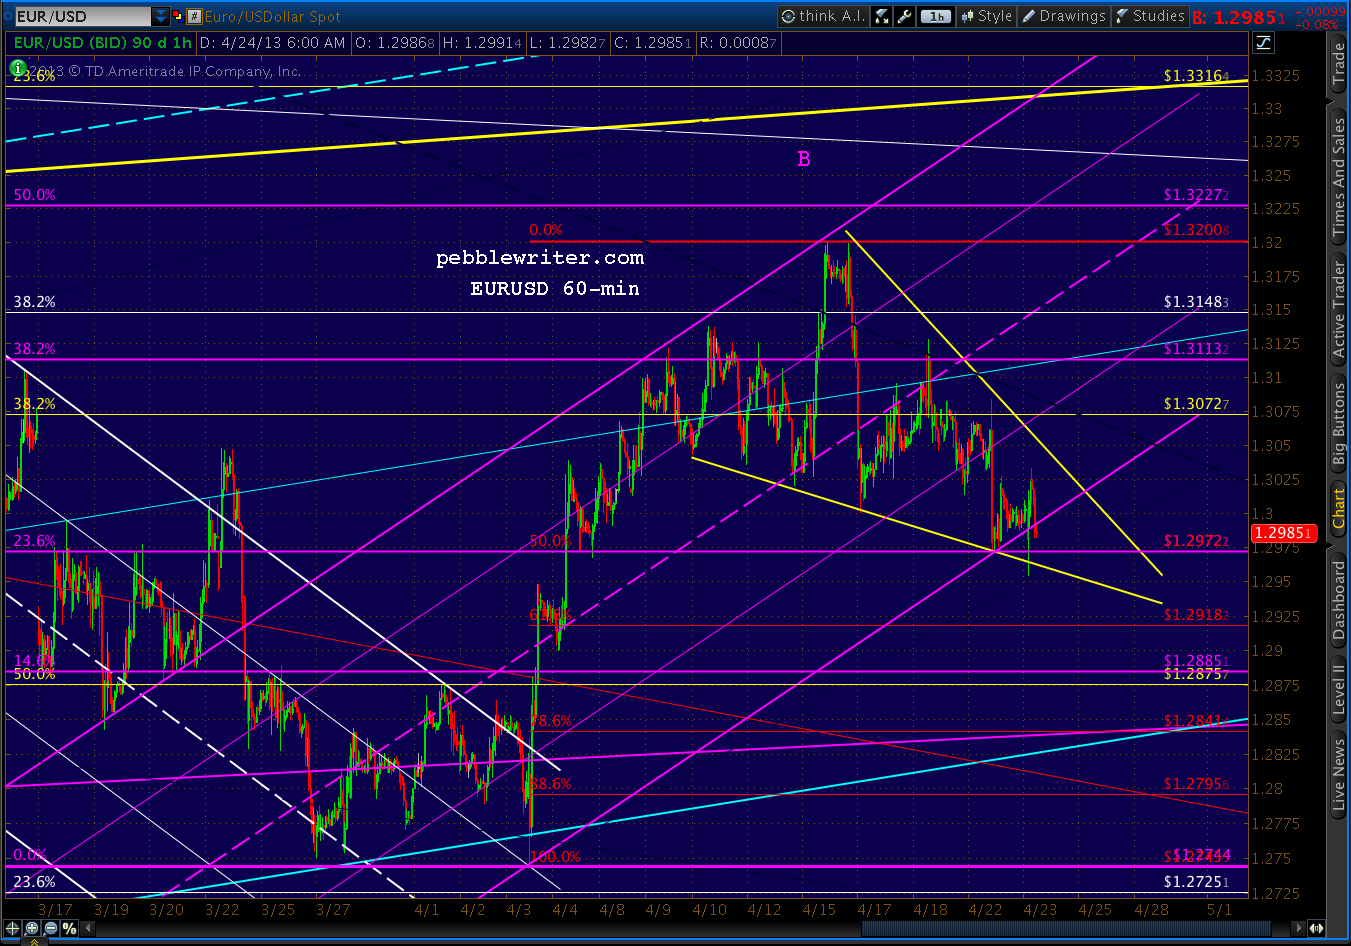
The wedges we've been watching on DX and EURUSD are playing out.  EURUSD has broken out...


...and DX has broken down.


But, it's the USDJPY that I'm watching especially closely this morning.  It still hasn't broken 100 since our Apr 8 observation [USDJPY update] that it was running out of steam:
"...there is growing risk of a downturn as it approaches 100... it appears the pair might have hit at least interim resistance at today’s high."
It topped out 3 sessions later at 99.94, and two weeks later is in danger of a larger pullback.


Remember, weakening the yen was a critical element of the BOJ's stimulus program that was supposed to generate inflation, boost Toyota sales and send Japanese investment funds flooding into foreign markets.


Instead, Japanese investors are repatriating their funds from abroad -- a net Y9.5 trillion ($95 billion) since the first of the year.  Why?  As any US investor could tell you, QE might not inflate economies, but it sure as hell inflates markets.

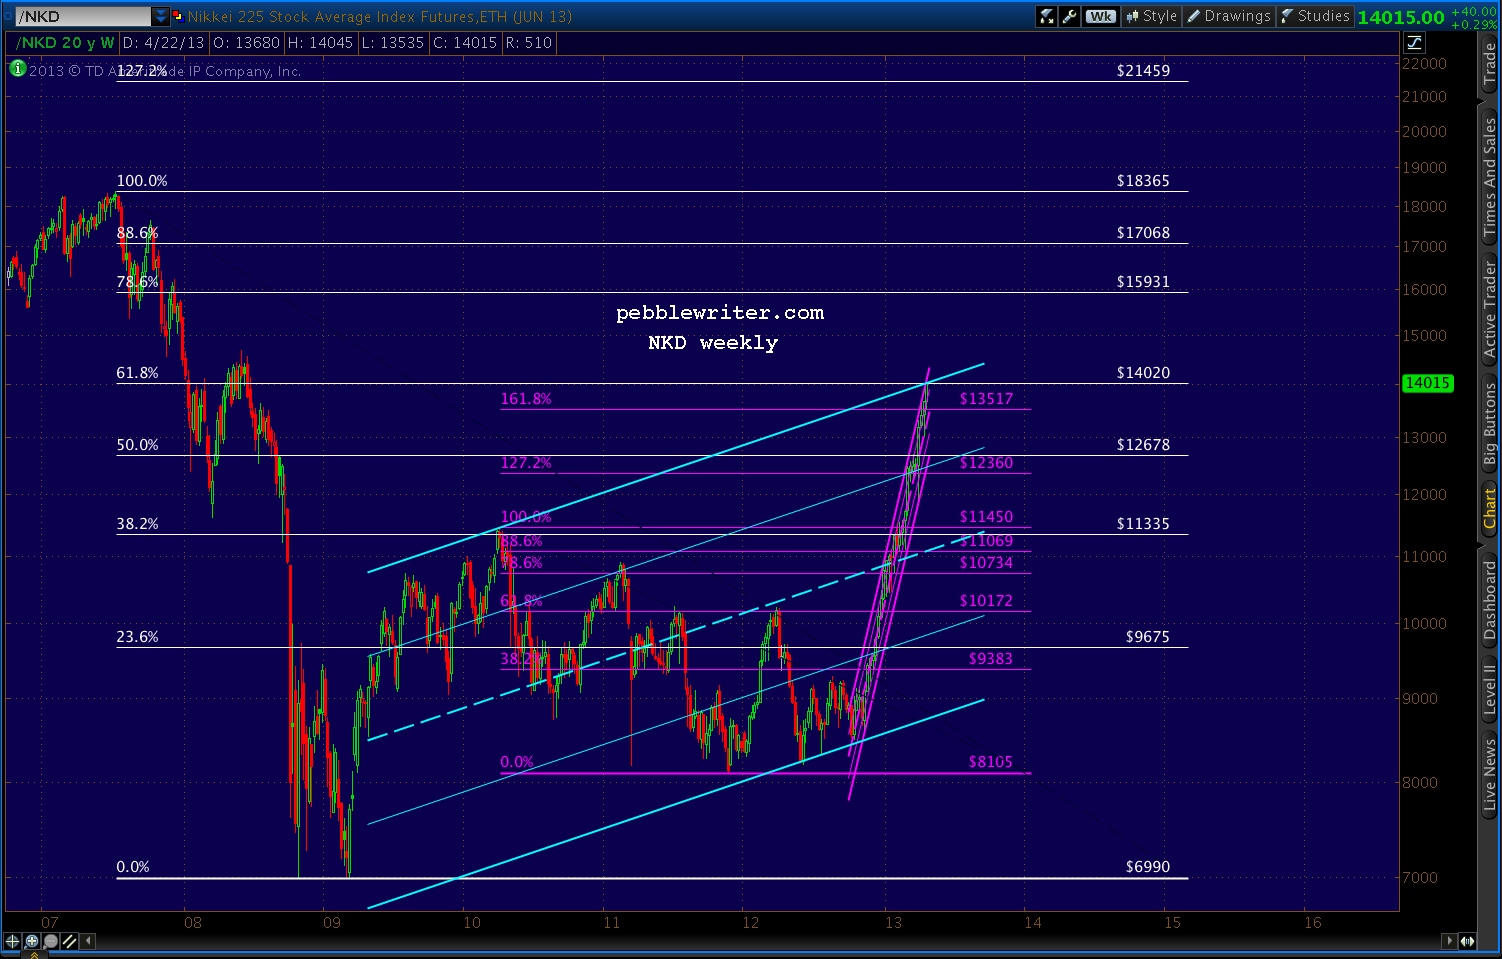
The Nikkei 225 is up 65% since last October's lows....


...and, still hasn't even recovered 2/3 of its losses from the 2007 crash.  The Dow and the S&P 500, by contrast, have recovered all of them -- and, then some.  So, to many, the Nikkei still seems the better value.  It's hard to argue with success.

But, I'll do it anyway.  In reaching 14,020 a few hours ago, NKD tagged the .618 Fibonacci retracement of its 2007-2009 crash from 18,365 to 6990.


To those not familiar with harmonics, this tends to be a big deal.  When SPX reached the equivalent point in April 2010, it plunged 17%.  The DJIA fell almost 15%.  The USD, represented by DX, soared 9.3%.

But, the yen positively soared.  USDJPY started a 17-month slide that took the pair down 20% from 94.98 to 75.78.  NKD, which had just reached its .382 Fib, shed 23% over the next 4 months, eventually reaching almost 30% in Nov 2011.

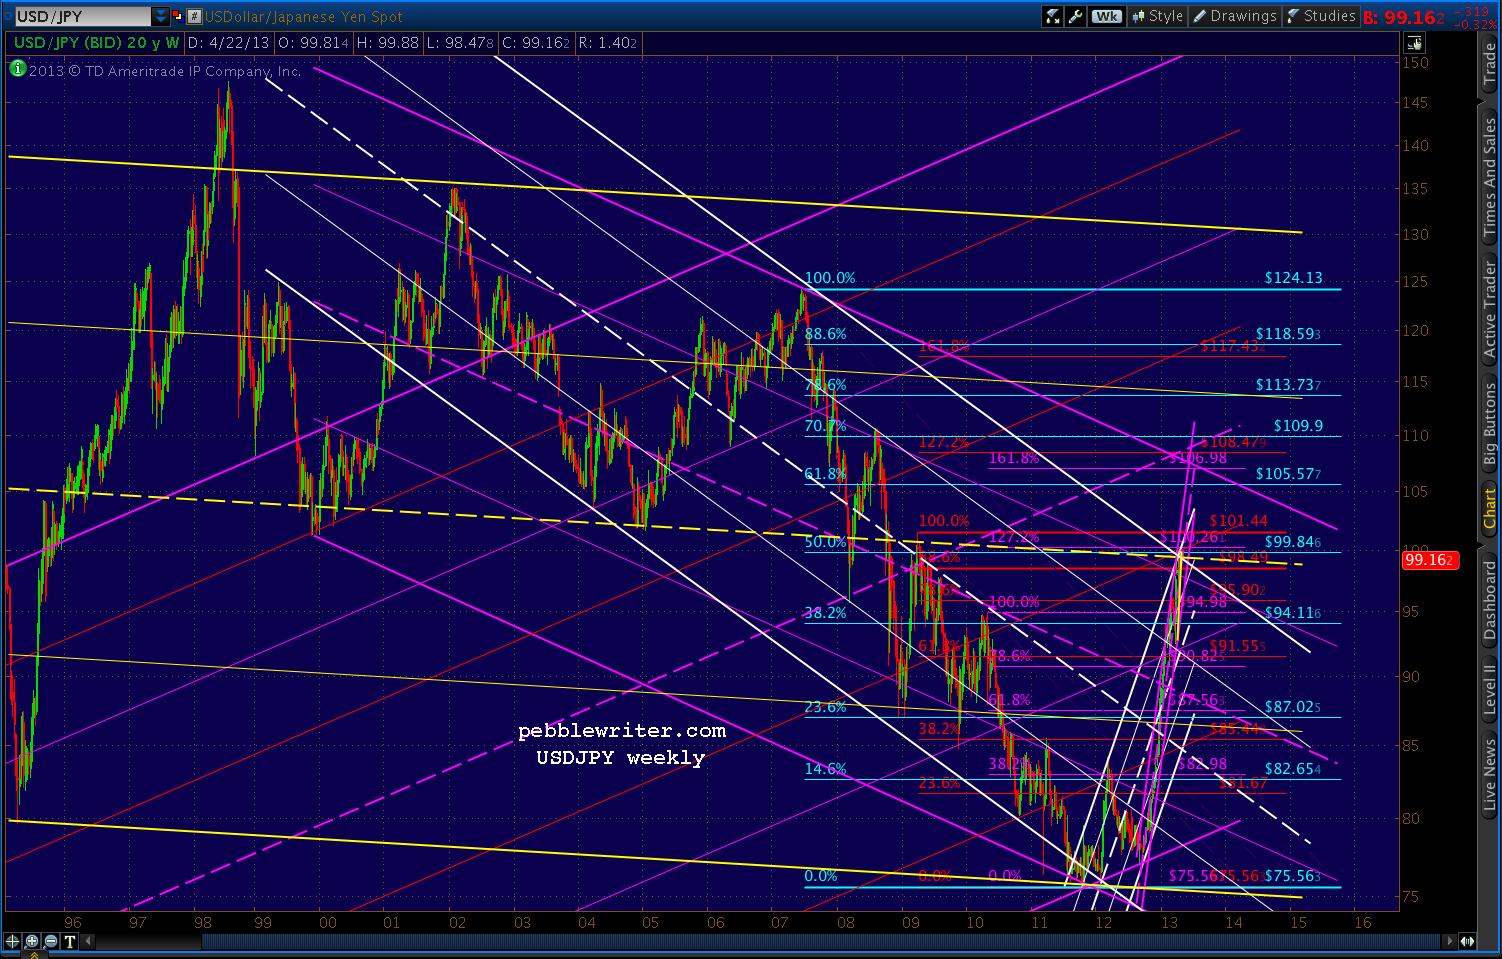
Could the USDJPY's failure to break 100 be telling us something?  You better believe it.  I called a top a few weeks ago because the pair had reached several important Fib levels as well as the midline of an important channel (in yellow, below)...


...that dates back to 1995.


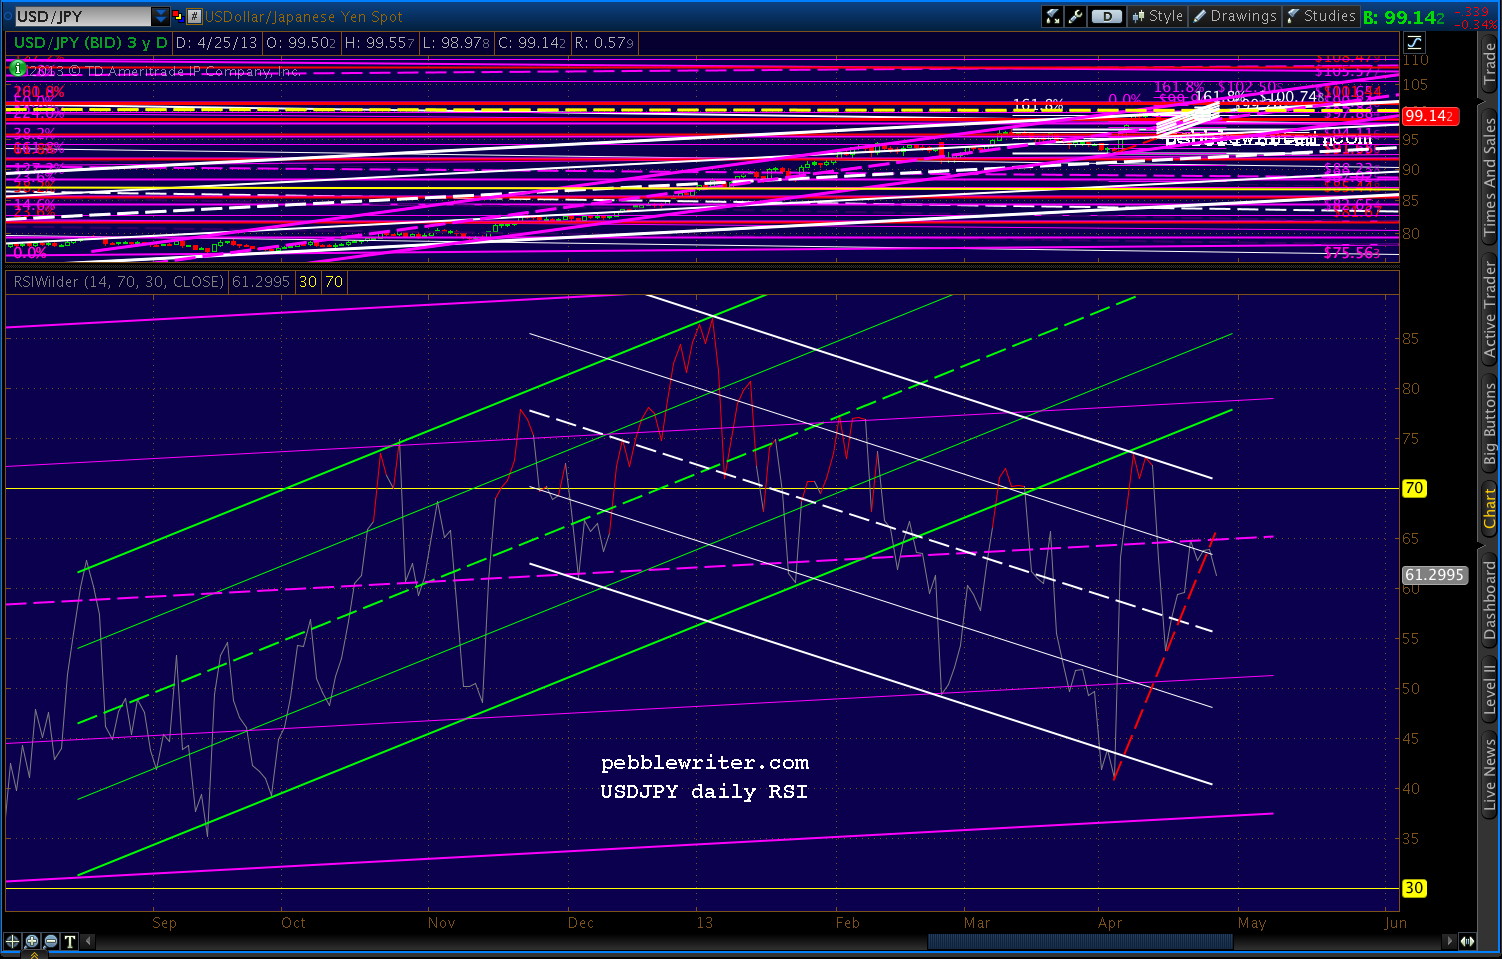
There's no guarantee it won't push through instead of retreating, but the RSI picture supports the danger of a significant retreat.

Daily RSI has backtested the broken yellow channel twice, but the trend is clearly down -- with the latest push being rebuffed by the purple midline.


And, a close-up reveals that a breakdown has already started.


Wednesday, April 24, 2013

Chart Patterns and You

ORIGINAL POST:  9:15 AM EST

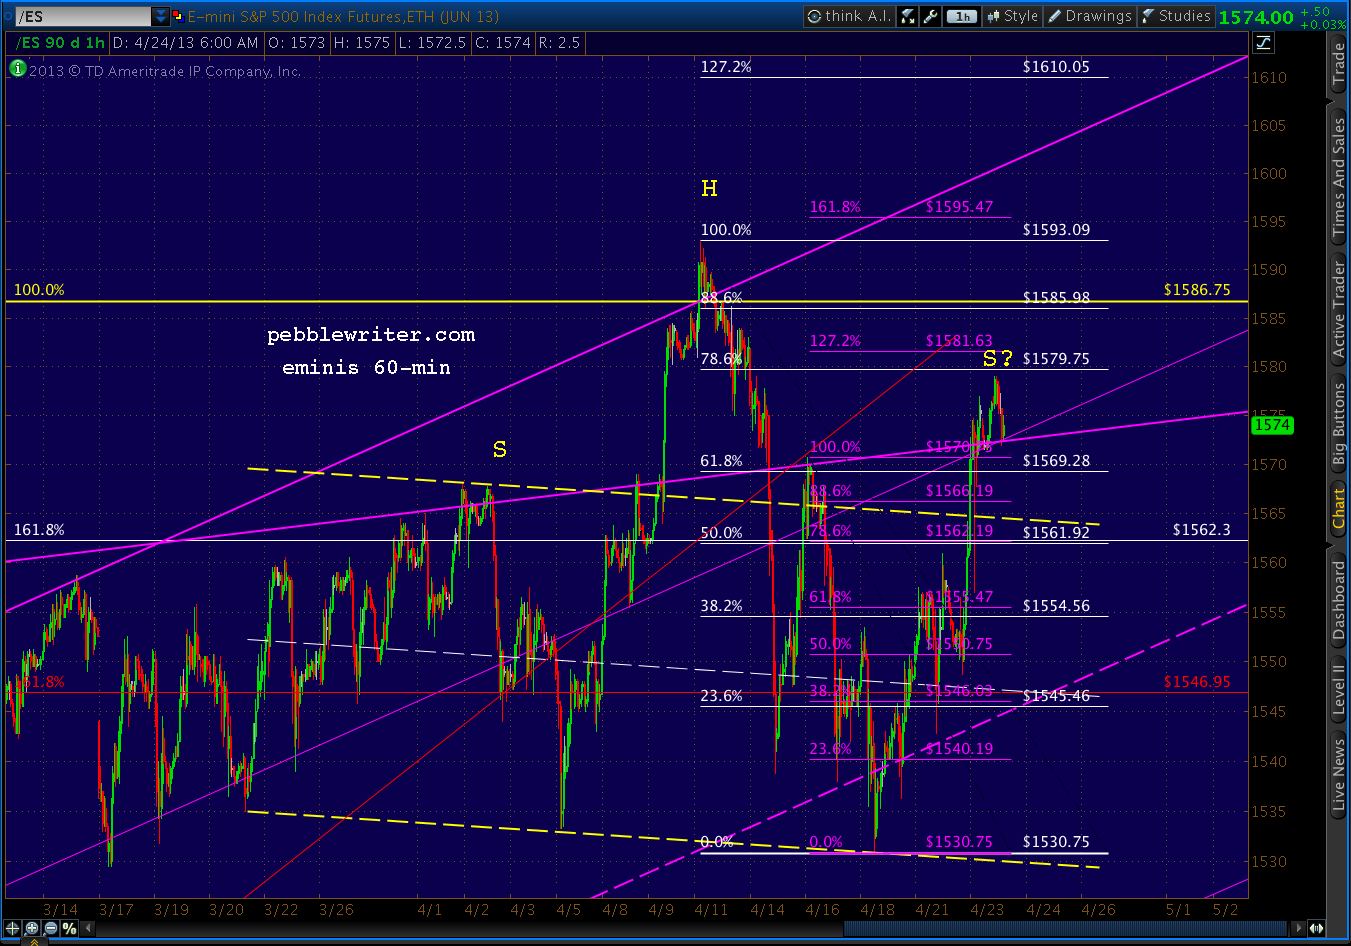
Last night, the dollar tagged the .786 Fib retracement of its decline from Apr 4.  It subsequently sold off almost to the .618 but, so far, is hanging in a rising wedge.


The EURUSD re-tested the .500 Fib of its rise from Apr 3, and snapped back into its falling wedge and the (purple) channel that's guided prices since then.


The e-minis tacked on a few points overnight -- almost reaching the .786, only to give them all back with this morning's underwhelming Durable Goods report.  The Head & Shoulders Pattern that was looking pretty good at yesterday's open is now looking a little iffy, with a right shoulder that's already 15 points higher than the left.


UPDATE:  9:45 AM

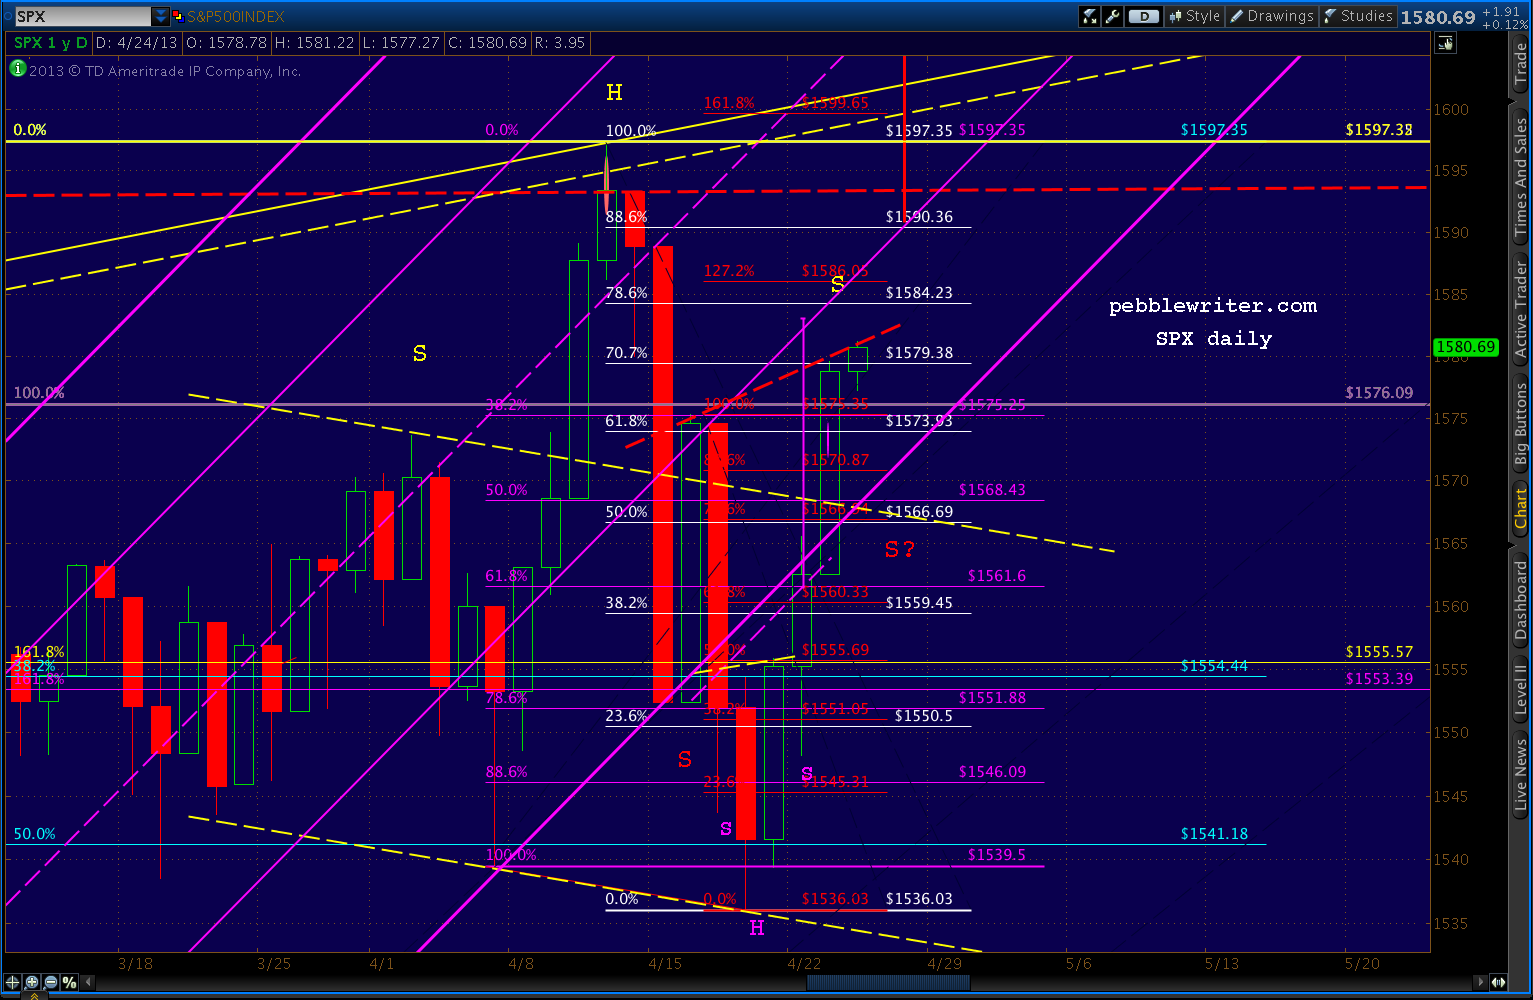
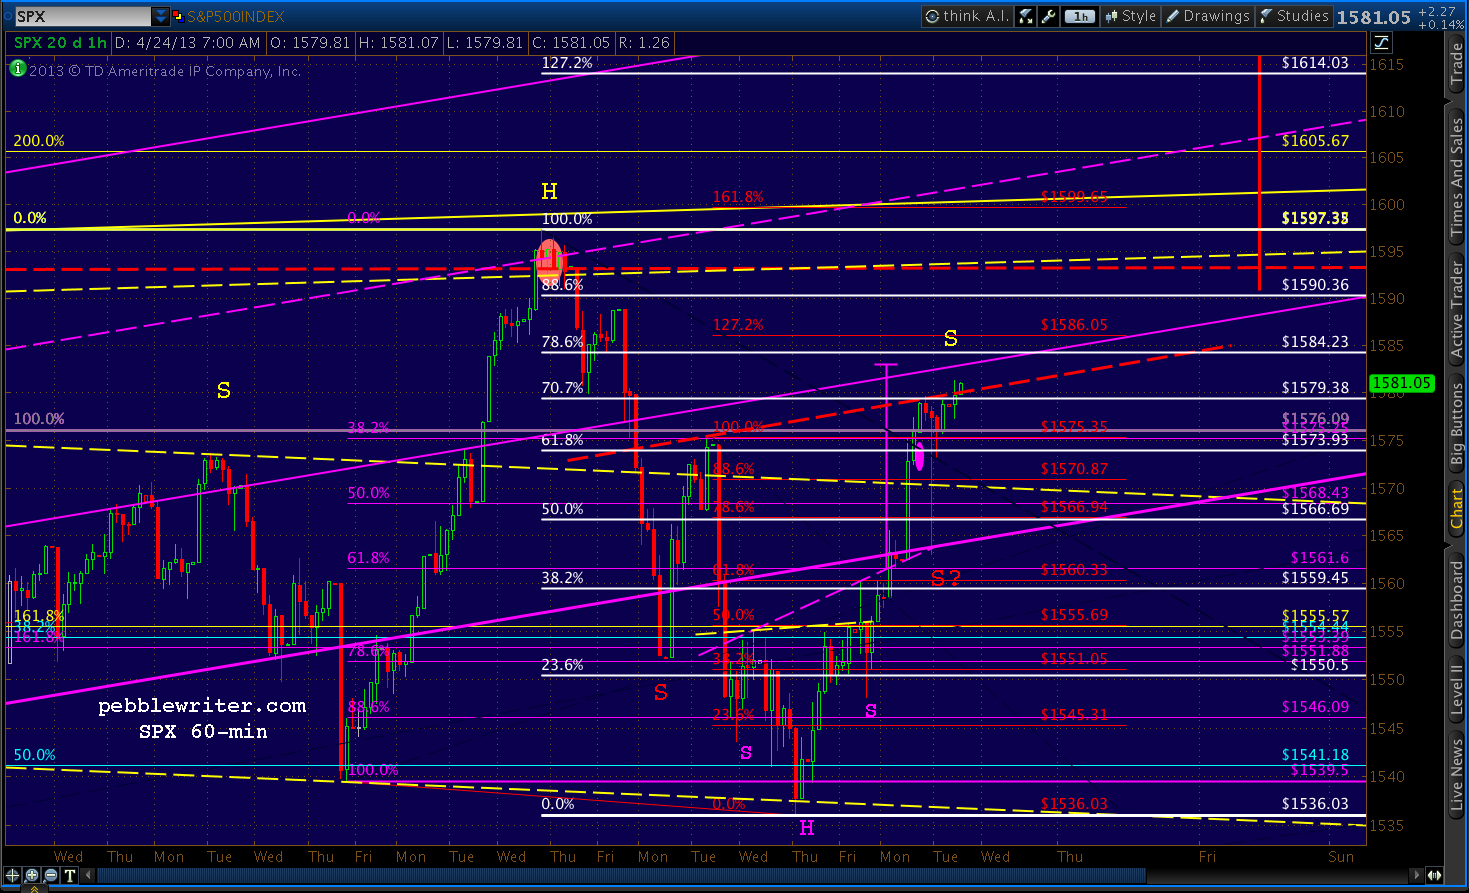
SPX continues trudging toward the .786 retracement (1584.23) of its decline from 1597 to 1536.


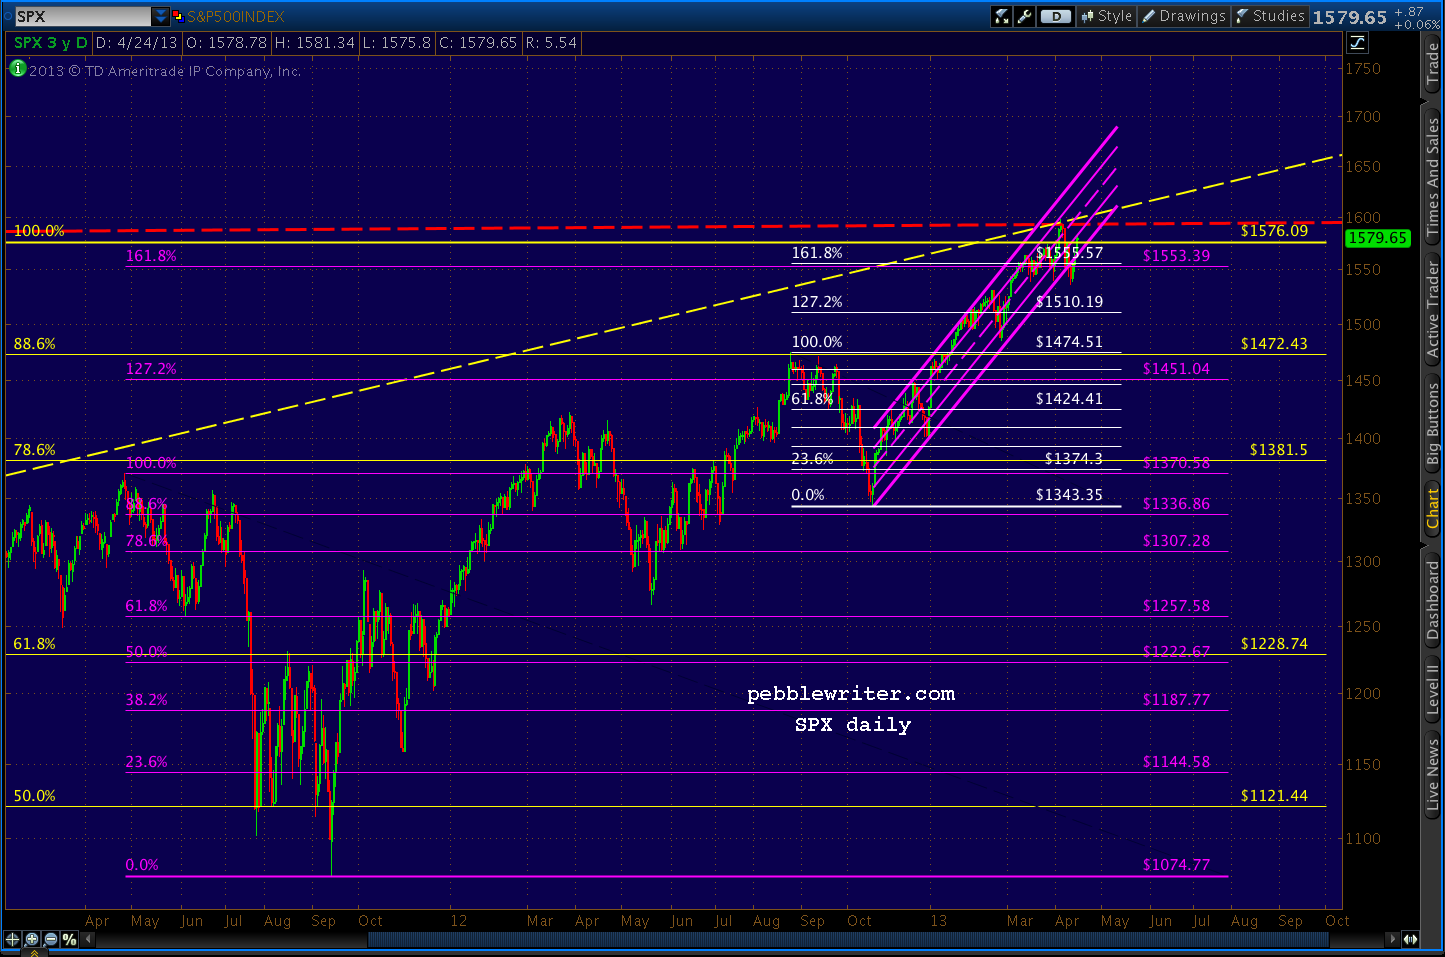
After plunging beneath the channel that's guided it from 1343 to 1597 on Apr 17, SPX rallied and re-joined the channel yesterday.  This was a very bullish development, as long as SPX remained in the channel all the way to the closing bell.

Despite a five minute thrill ride from 1578 to 1563 (the channel bottom) and back, SPX managed to regain and hold the 2007 high of 1576.09 into the close.

It now sits perched on the neckline of an Inverted H&S Pattern which has either completed or not, depending on whether a 5-minute plunge qualifies as a shoulder.  Short answer -- I have no clue.


Here's what we do know:
  1. Prior to Apr 17, SPX had been locked into that purple channel below since 1343 on Nov 16 -- an 18.9% gain in five months
  2. SPX barely paused when it completed two big Crab Patterns -- the 1.618 extensions of the 1370-1074 decline and the 1474-1343 decline (purple and white below)
  3. Instead, SPX exceeded the Oct 2007 high of 1576.09 (yellow)
  4. SPX reversed at 1597.35, almost precisely at a trend line drawn between the 2000 and 2007 highs
  5. SPX fell 3.8%, making a lower low, dropping out of the channel mentioned above and suggesting a H&S pattern that targets 1474 -- the Sep 2012 high (white pattern)
  6. It roared back into the channel, retracing almost 78.6% of its drop
  7. In the process, it topped the 1576.09 high and the 1553 and 1555 Fib levels and almost reaching the 1583 target of an IH&S Pattern
  8. Depending on your interpretation, it might also have completed an IH&S that targets 1621.


What Does It All Mean?

When I forecast markets, I look for lines in the sand.  I try to determine price levels that, if crossed, would signal a change in trend.  When that trend switches from bullish to bearish, I want to be short.  When it switches from bearish to bullish, I want to be long.

A channel is one such method that features boundaries rather than absolute price levels.
As long as prices remain in a rising (or falling) channel, we can expect prices to continue to rise (or fall.)  It's rather simplistic, but it usually works.  We can make educated guesses as to future price targets based on where the channels point.

Of course, even well-formed channels (multiple tags on the top and bottom and over a sufficient time period) can't go on forever.  I look for moments when prices must choose whether to remain in or leave the channel.  A tag of a top or bottom bound or midline usually create opportunities, though other lines can as well.

The Real World

Recall that we shorted SPX at the 1597 high on the 11th [see: Big Picture], riding down to the channel bottom where I went long at 1554, expecting at least a bounce.  We got one on the 16th with SPX rallying up to 1575 -- the channel .25 line.

We closed our long position, going short the following morning for the trip back to the channel bottom at 1555.  We tried another long position there, but were quickly stopped out as the channel was broken -- signalling a bearish trend change.

So, we shorted again, playing quite a few bounces down to 1540 where we eventually went long in anticipation of establishing a H&S Pattern neckline [see: Dollar Daze.]

At that point, I expected a back-test of the broken channel.  We got it, reaching 1565 on the 22nd but closing beneath the channel's lower bound.  Note that this move completed 5/6 of a H&S, but the right shoulder was underdeveloped relative to the left.

Anticipating an intra-day retracement to 1567 (the .500 Fib) or 1574 (the .618) the next day (yesterday), I stayed long -- trying without much success to anticipate the top.  Since SPX topped the .618, the next up on the chart is today's target: the .786 at 1584.23.

Going Forward

With all that as preamble, here's what I expect going forward.

...continued on pebblewriter.com...

Monday, April 15, 2013

Gold Melting Down

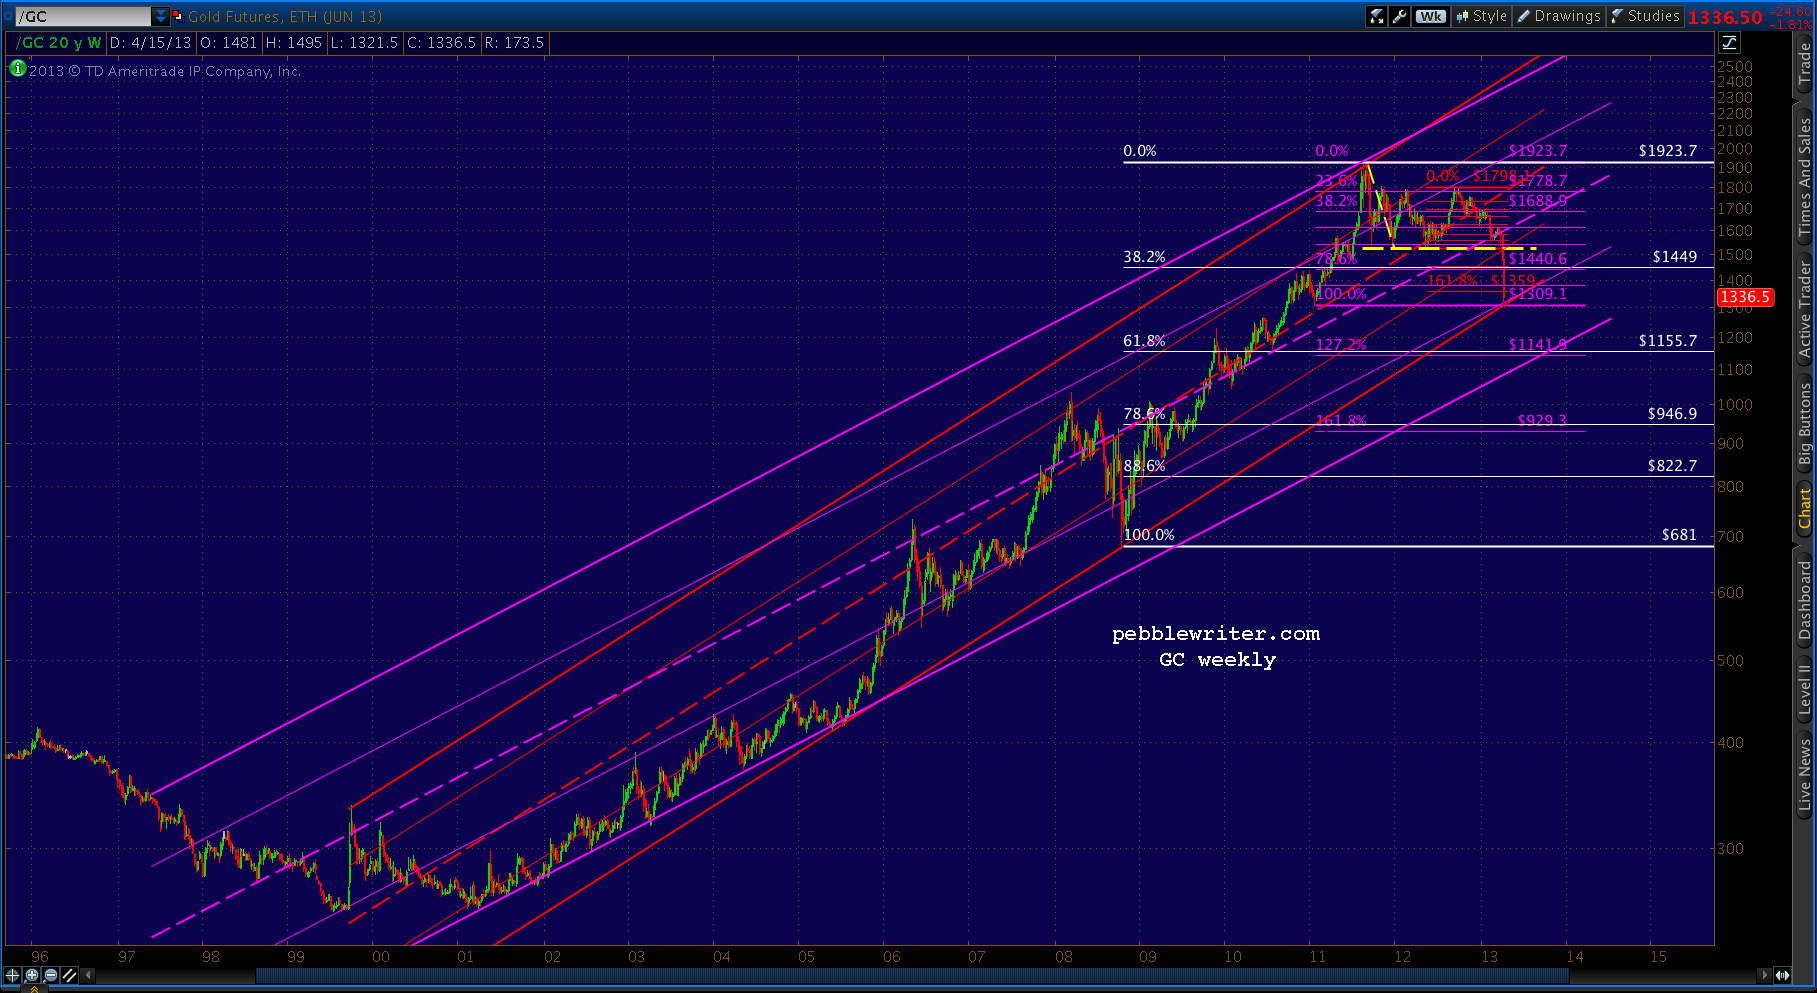
Gold continued to melt down today, shedding another $126 and continuing the plunge that started on Friday with the critical loss of the LT channel we discussed last week, the horizontal support at 1520-1535, and the psychologically important 1500 level.


Gold had a nice bounce from 1539 to 1590 after reaching the bottom of the channel and the horizontal support of several prior bounces on Apr 4.  In a dramatic demonstration of what can happen when channel support is lost, it has since shed almost $270/oz.

The red channel below represents my best shot at the new operative channel.  It supports the idea of a bounce at the Jan 2011 low of 1309 -- 3rd on our list of potential bounce spots during today's onslaught.
The next best available channel is well below the current one, but supports the idea of a bounce at 1379 or 1359 -- the Bat Pattern and Crab Pattern completions shown in the first chart above.  If those levels should fail to hold, the next major support levels are 1309 and 1155.
We got good bounces earlier today at the first two: the Fib retracements at 1359 and 1379  But, along came the CME with announcements of increased margins and that was the end of that.


Please note, I am not a gold bug.  I don't advocate the purchase of gold. I shy away from most assets that increase exponentially in price -- especially those backed with the kind of religious fervor as is gold.  They can drop with just as much enthusiasm.

The time may come when inflation is taking hold and it makes sense to switch everything you own into the metal... but, we're not there yet.  It's a crowded trade, and IMO, today's price action underscores the risk.

So, the following is offered in the same spirit as my picks for NCAA champion, Best Picture, and  Westminster Best in Show (the affenpinscher, really!?)

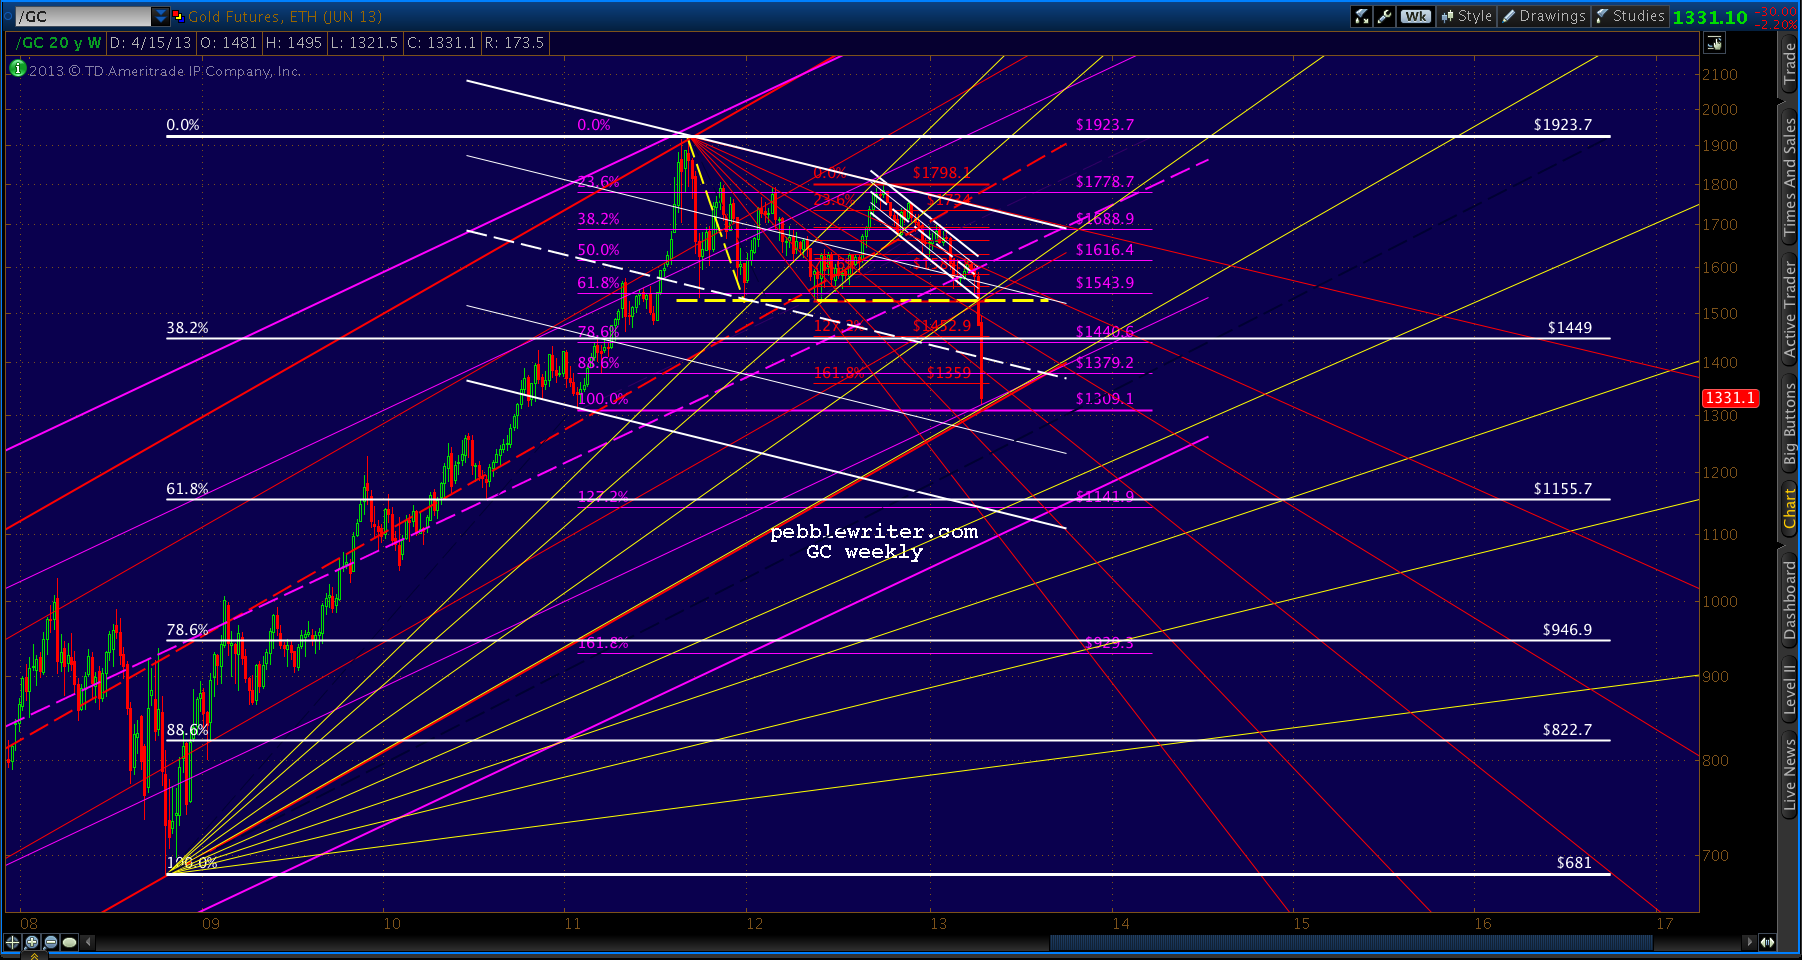
There's another channel (below, in purple) that kinda sorta supports the first, but shows the potential downside in the event that 1300 can't handle the pressure.


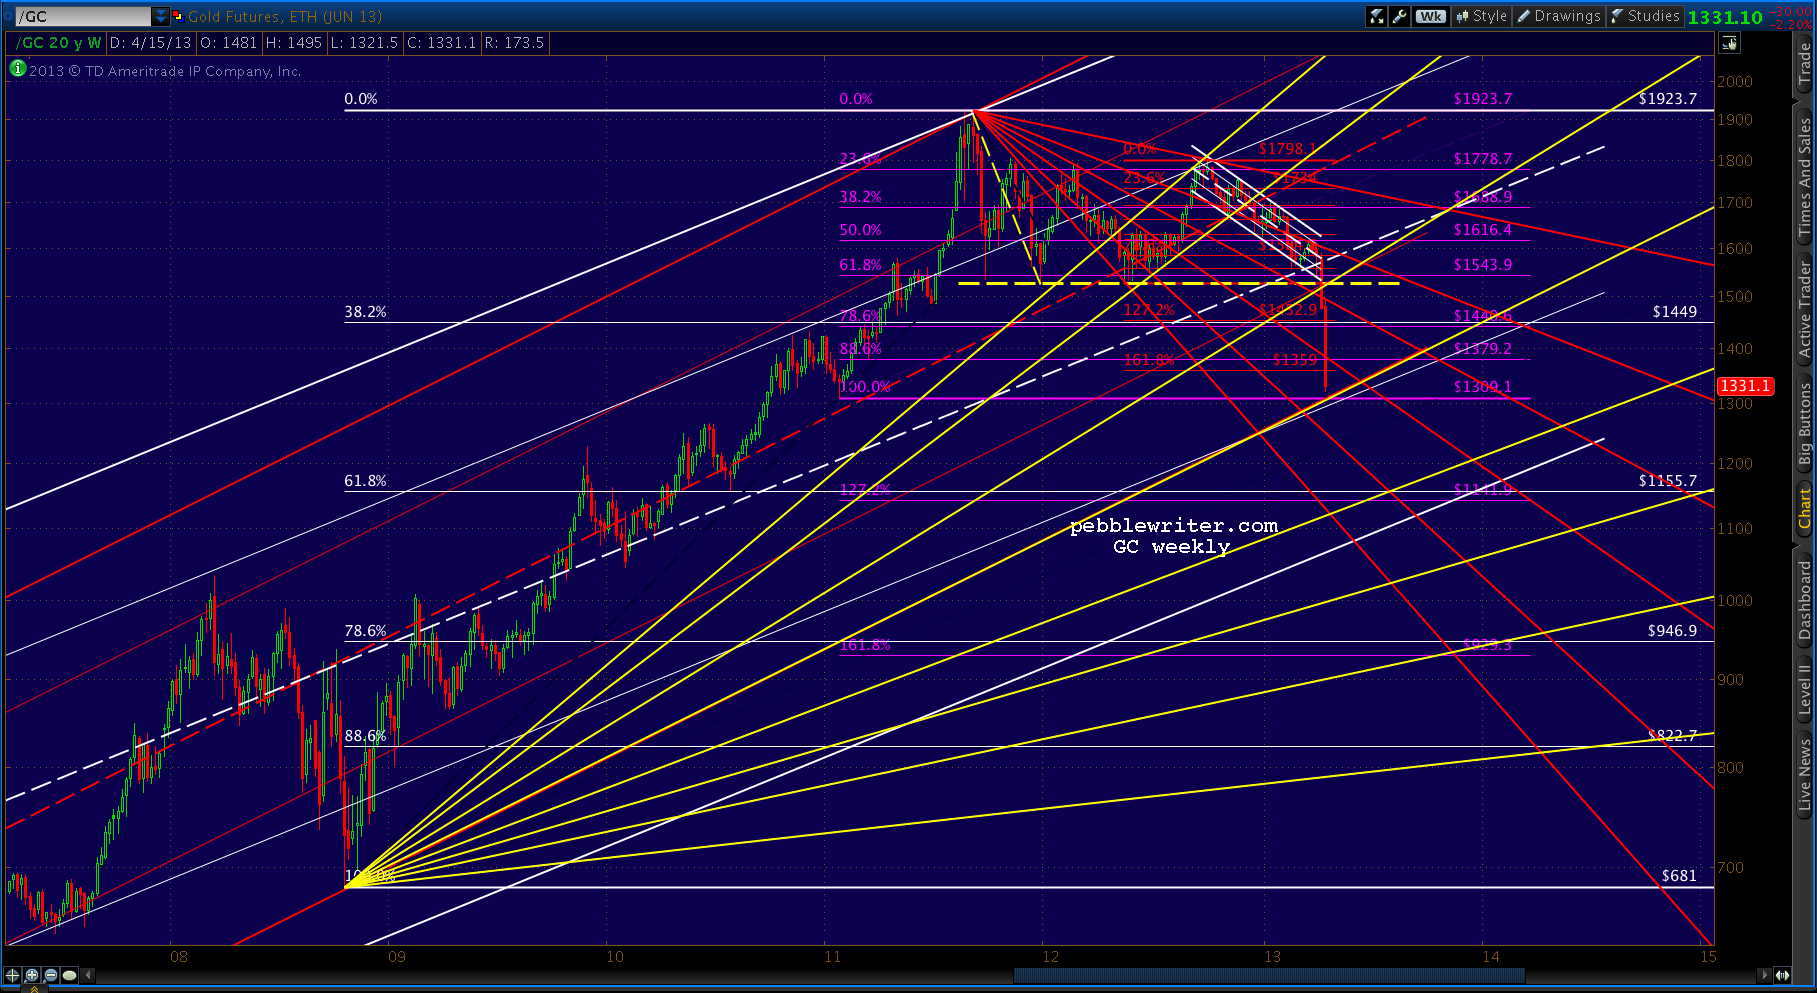
It's speculative, for sure.  But, I like the fact that it crosses the white .618 at a key point in time, so I'll leave it up for now.What's interesting to me is the Fibonacci Fans that can be drawn on this chart.  The ones from 681 low (yellow) have done a pretty decent job of guiding the bounces on the way down.


And, the ones from the 1923 high (red) have done well at halting several attempts at a breakout.


I could almost believe we've seen the worst of the drop, but I wonder about this potential channel...


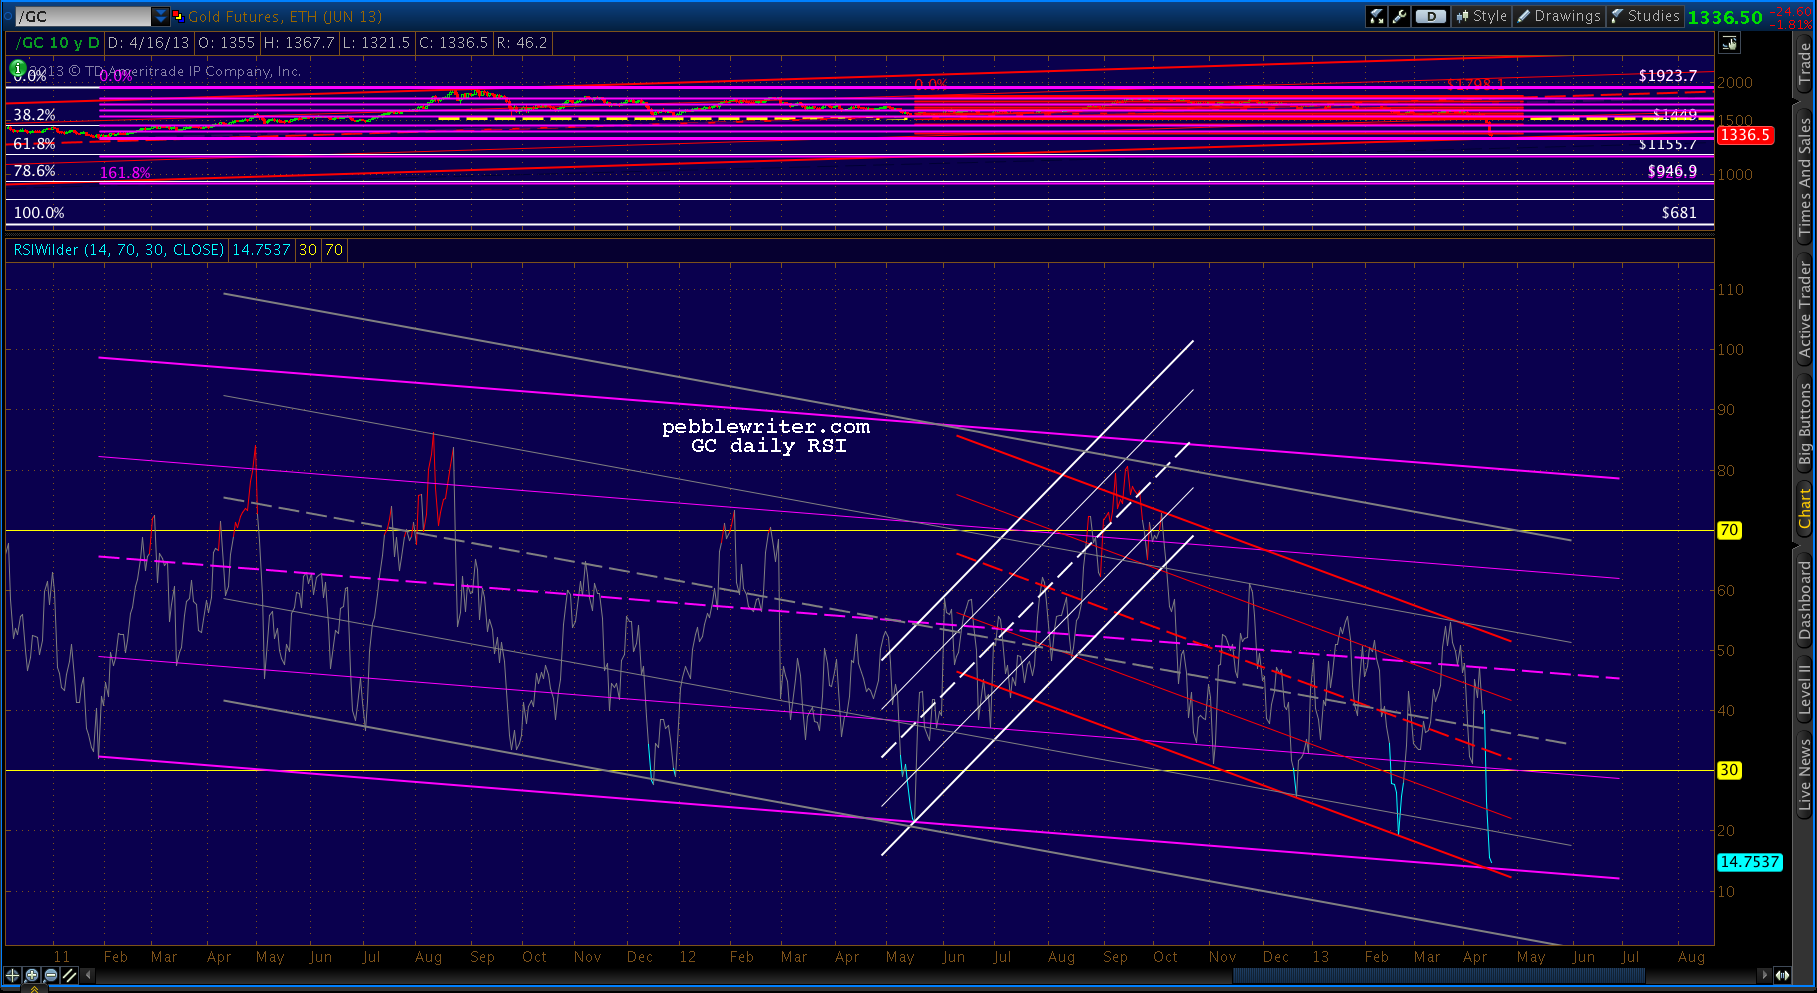
...and, the daily RSI -- which suggests at least a little more potential downside any way you slice it.  The bottom of the purple and red channels probably correlates to 1309, while the bottom of the gray channel represents something much more ominous.


So, where do we go from here?

continued on pebblewriter.com...

Friday, April 5, 2013

Catching a Falling Knife

~reposted from pebblewriter.com...

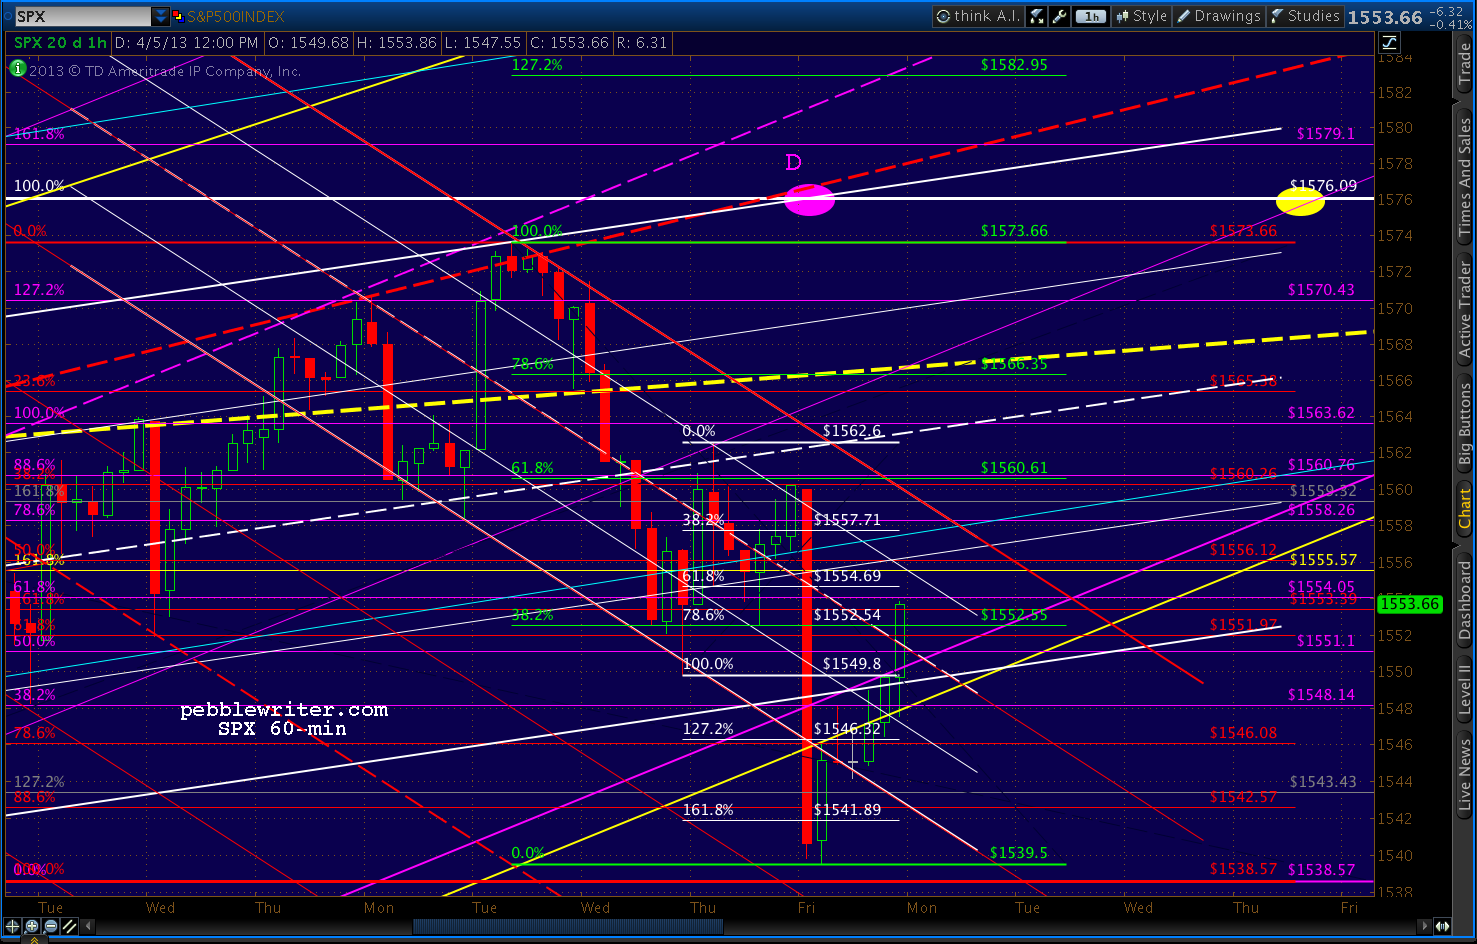
Looks like we're going to hit our downside target after all, thanks to a dismal payroll number.  I've had 1546.08 as my top choice [CIW Apr 3, 2:25 update for members.]
I’m inclined to stay short for the purple channel bottom at 1546.08 or the 1.618 at 1549.09, with stops at 1558.47ish.  But, anyone who doesn’t mind the extra trading might consider going long here — with the understanding we might run into trouble at the channel top (small falling white) at 1558 or so.
But, if the downside momentum builds, 1542.57 is definitely in reach.


I'll play the downside on the opening, but be ready to bail at those levels.

A drop through 1538 opens up much lower prices and essentially busts the channel that dates all the way back to November's 1343.

UPDATE:  9:33 AM

I think it's worth taking a shot on any loss of momentum just shy of 1538.57 (lower really damages the bullish case.)

So I'll take a stab here at 1539.86.  Going long again with stops at 1538.


 Note that at these prices, SPX has completed a Head & Shoulders pattern, albeit with a very steep slope.  But, it's not verified unless we close below 1545 or so.   Even then, we've had two such (normally very reliable) bust in the past several weeks.

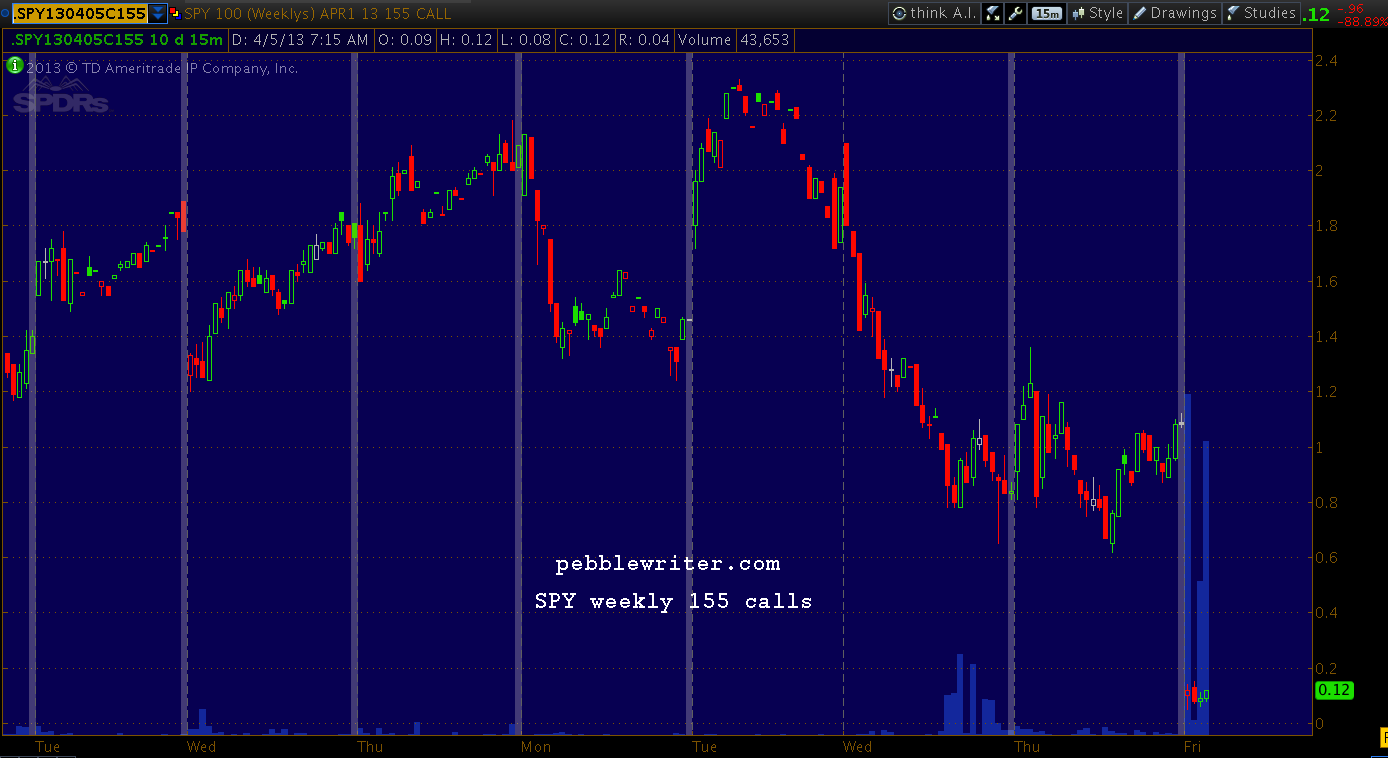
If drops like this morning's make you nervous, the market makers have done their jobs.  Remember, this morning's plunge is by design. The open interest on the SPY 155 weekly calls that expire today, for instance, is 97,000 contracts.


Each contract gives you the right to buy 100 shares of SPY at 155 through today.   It's the equivalent of SPX 1550. They're currently trading at 12 cents (probably a good deal.)  But, three days ago -- when SPX nudged into the 1570's -- market makers would have been happy to sell you all you wanted at 2.33.

A $23,300 "investment" in 100 contracts at the high would be worth $1,200 -- a 95% loss in 3 days.  This is an example of the typical game played by market makers who just love optimists.
They love pessimists, too, and just sold a boat load of puts this morning to those expecting this morning's plunge to keep going to 1500.

It's taken me a couple of years to come to the conclusion:  if you can get the kind of results we do without leverage and without options, why take the risk?  It's hard enough to be right on the direction and magnitude of a move, without having to be right on timing too.

Even if we had held long instead of shorting at 1573 on Tuesday, we'd be down a whopping 1.7%.  Beats the heck out of -95%.  By shorting, we actually made money.

*  *  *
I met an old friend for coffee yesterday, and we talked about pebblewriter.com and my investment strategy.  He asked if the results we got this past year weren't simply attributable to a great market.  The question took me by surprise.

The S&P 500 was up 8.75% between Mar 22, 2012 (our inception) and Feb 28, 2013 (without dividends.)  That includes a 12.8% gain from Nov 16 - Feb 28.  I guess the MSM has done a bang-up job of selling this as a "great market."

But, the question did get me to thinking.  As of Feb 28, just shy of a year since inception, we were up about 113% in a theoretical portfolio where we bought SPX at called bottoms and shorted at called tops.

Forty-eight percent of our gains came from long positions and 52% from short positions. In other words, we benefited slightly more from declines than from rallies.  Unlike almost all long-short funds, we did it by being either long or short, depending on my outlook.

The major moves during that period were:
  • Apr 2 - June 4, 2012 (1422 to 1266, an 11% decline)
  • June 4 - Sep 14, 2012 (1266 to 1474, a 16.4% rally)
  • Sep 14 - Nov 16, 2012 (1474 to 1343, an 8.9% decline)
  • Nov 16, 2012 - Feb 28, 2013 (1343 to 1515, a 12.8% rally)
So, anyone who captured all of those major moves earned about 49% -- much better than the buy-and-hold approach of 8.75%. They would have had short-term rather than long-term capital gains; but, anyone with a marginal tax rate below 85% wouldn't have minded.


My objective is simply to capture most of the moves most of the time.  If 49% represents the most we might have earned by capturing all the major moves all of the time, we apparently earned about 64% by playing interim moves -- going long and short.

Shorting the market scares some people.  When I was a shiny new broker back in the Middle Ages, all they had to say was "when shorting, you have unlimited losses."  It sure scared me -- which was the point.

But, by using stops this past year, we limited our single biggest losing trade to 1.5%.  There's always the possibility of a 10% gap down, but by using e-minis rather than cash markets and going to cash in precarious situations, that risk can be greatly reduced.

What I find really risky is buy-and-hold investing, where investors hold long through 10-20% declines.  If your name's Buffett, no big.  But, if you need money for a wedding/college education/vacation house in a few months, and that 10% decline turns into 58% (2007-2009), 51% (2000-2003) or even 22% (May-Nov 2011)?

Everyone's talking about whether the S&P 500 will make a new all-time high, topping 2007's 1576.09.  But, after inflation, it's still down about 25% from its 2000 peak.  The real Nasdaq is down over 50%.  For someone planning to retire, that's risk.

One final thought...the beauty of our strategy is it provides concrete decision points.  If you buy AAPL at 500 based on the hype around the new iWatch and the stock falls the following day to 490, should you hold?  What if it falls to 460?

What if the iWatch is released and the stock only recovers to 485?  Do you sell?  Double down?  Wait for the sales numbers? Wait for the next quarterly report?  At what point do you pull the plug?

Between Harmonics and chart patterns, we're rarely left without a sense of whether our investment thesis is correct or not. Even a simple channel will usually tell you if you're on the right track.

In early December 2012, we had been following an analog that had earned us over 10% per month -- forecasting all the major moves since the previous March. The analog called for a reversal and move lower from either at 1424 or 1446.

I tried shorting both times, giving up a few points before it became apparent the market wasn't going to tumble.  The same thing happened a few weeks later, when the Fiscal Cliff "solution" sent the market gapping higher after New Years Day.

There were multiple potential targets to the upside, so I have tested the short waters many times on the way up from 1474 to 1573.  It's always fun (and more profitable) to be right for a big score, but by managing my exposure and paying attention to the trends, I've still pulled in decent returns without taking undue risks (March update coming this afternoon.)

I will continue refining the strategy and trading techniques in anticipation of our new fund that I anticipate coming out next month.  I have developed a distribution list for those who have expressed interest in getting more info.  If you'd like to be on it but haven't yet contacted me, please CLICK HERE.

*  *  *
UPDATE:  3:50 PM

The market has rebounded nicely since this morning's 1539.50 low.  Anyone too wigged out about Cyprus, the NFP number, Korea, etc. should take the money and run.  Forget about the market and enjoy your weekend.


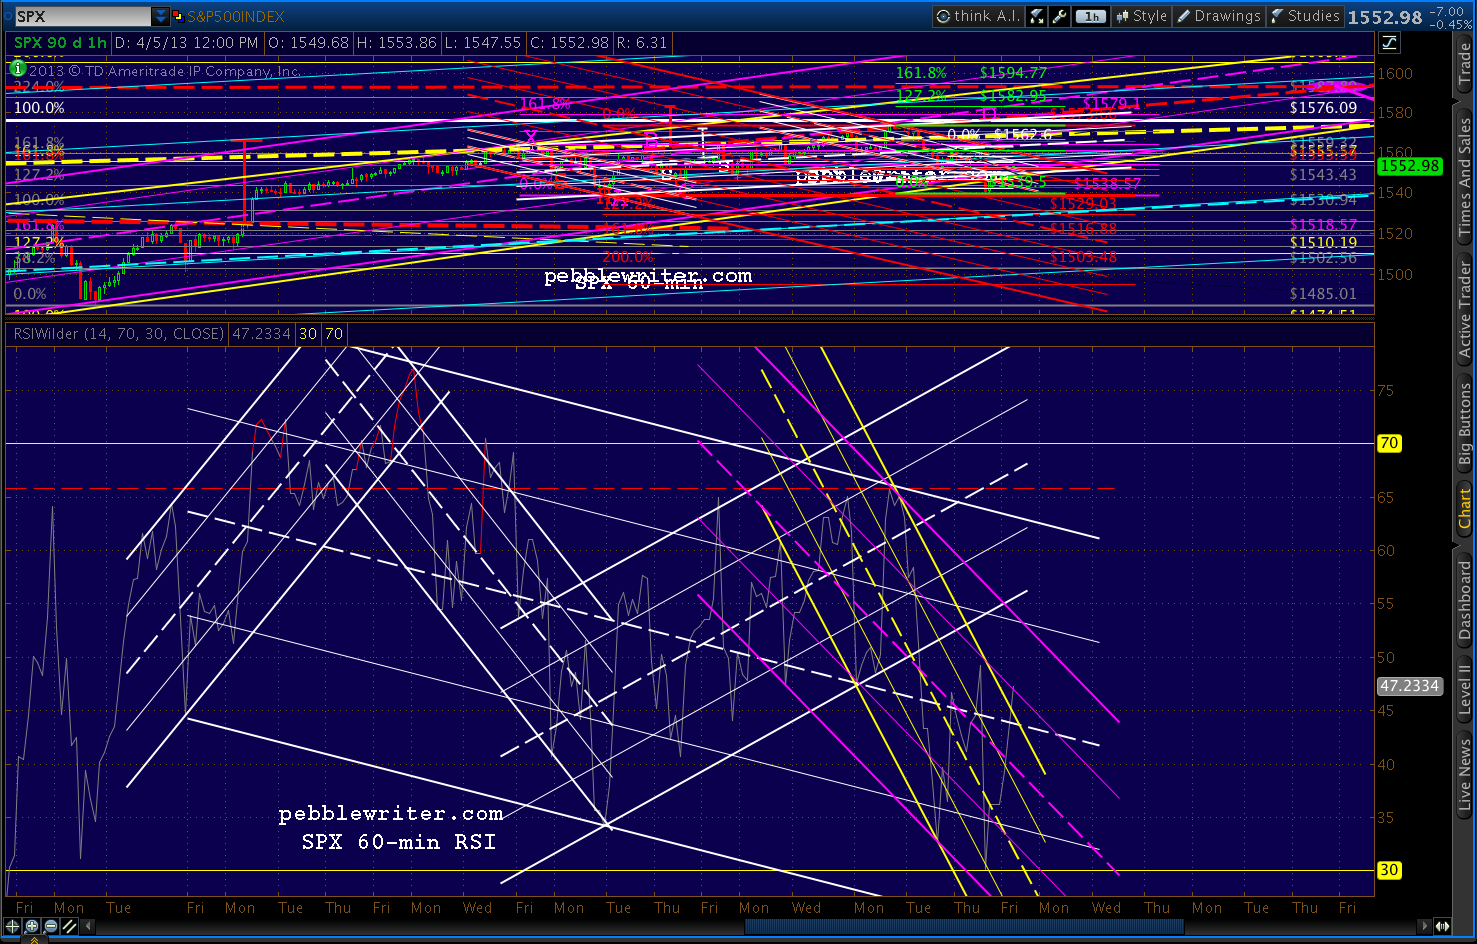
But, 60-min RSI just broke out of the most severe of the bearish channels and SPX should have no trouble reaching 1560 either today or Monday.  What it does then matters a lot, but I suspect our forecast is still intact.


I'll hold long unless we reach 1560 today, at which point I'd probably go to cash.  Stay tuned.

UPDATE:  4:05 PM

Nice safe close, back in the loving arms of both the purple channel and the white channel.  I'll update the forecast later this afternoon, but I believe we're in good shape re the forecast.

Oh... and congratulations to anyone who bought SPY 155 calls at 12 cents earlier (they traded up to .38 shortly before the close.)  Take the money and do something nice for somebody deserving.  Karma and all that...

More later.