reposted from pebblewriter.com~
It's been over a month since I last focused on gold. The equities markets have kept me working overtime, and I assumed our May 15 forecast had long since jumped the tracks.
At the time, gold had plunged 270 to 1321 per ounce in only 4 sessions, bounced at 1321 (the day after our bottom call) to within 13 of our upside target, and was returning for a second bounce -- or not. From that post [Update on Gold: May 15, 2013]:
When the big red channel from 1999 broke down on Jun 20, GC plunged again. It failed to catch a bid at the first support level, but is approaching the second one this morning: the yellow 1.618 that completes the Crab Pattern at 1219.10.

This seems like an opportune time to update the forecast, as gold's price action continues to provide valuable clues as to investors' expectations about QE, the value of the dollar and inflation. Are the many calls for gold to fall below $1000 per ounce well-founded?
Probably not. We should get a decent bounce beginning at or near 1219 today that could take prices as high as 1320 or so by July 5-8. A continued rally through the red midline would mean additional gains to 1357-1385 by mid-July.
But, there's a better chance of a plunge to 1155 instead -- and it need not respect the Crab Pattern about to complete, especially if today's equity rally falters (gold certainly isn't buying the More QE! snake oil.)
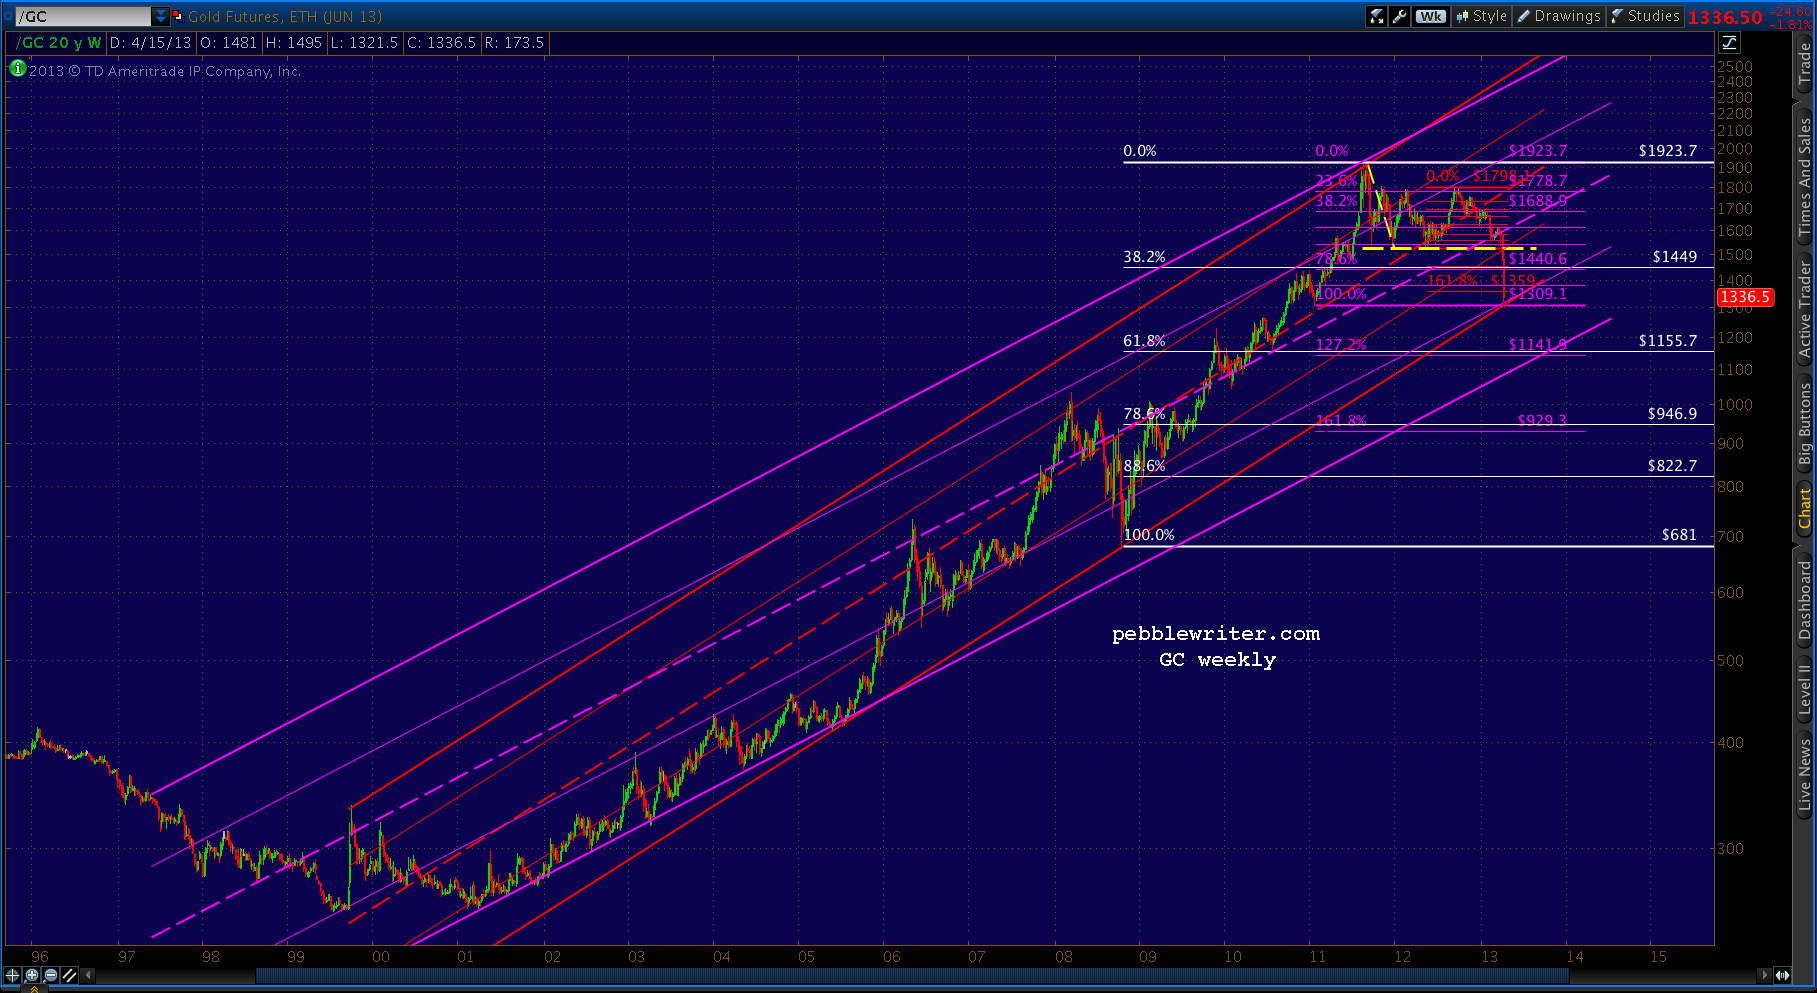
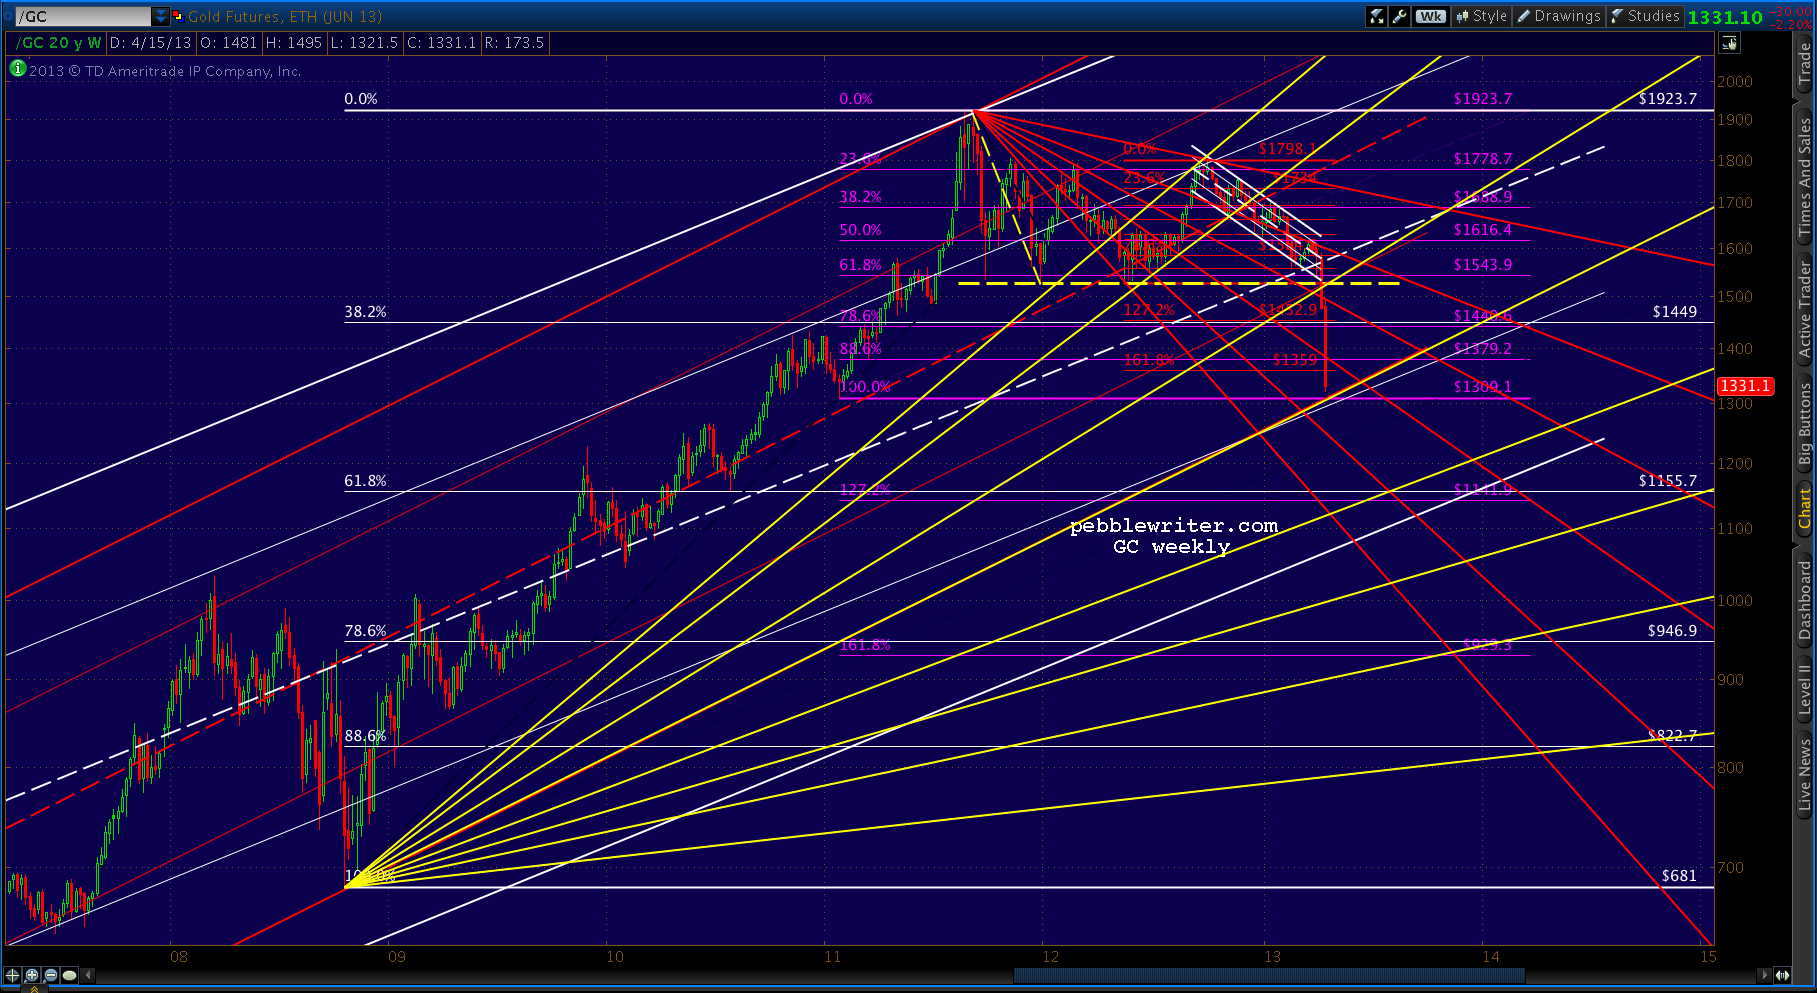
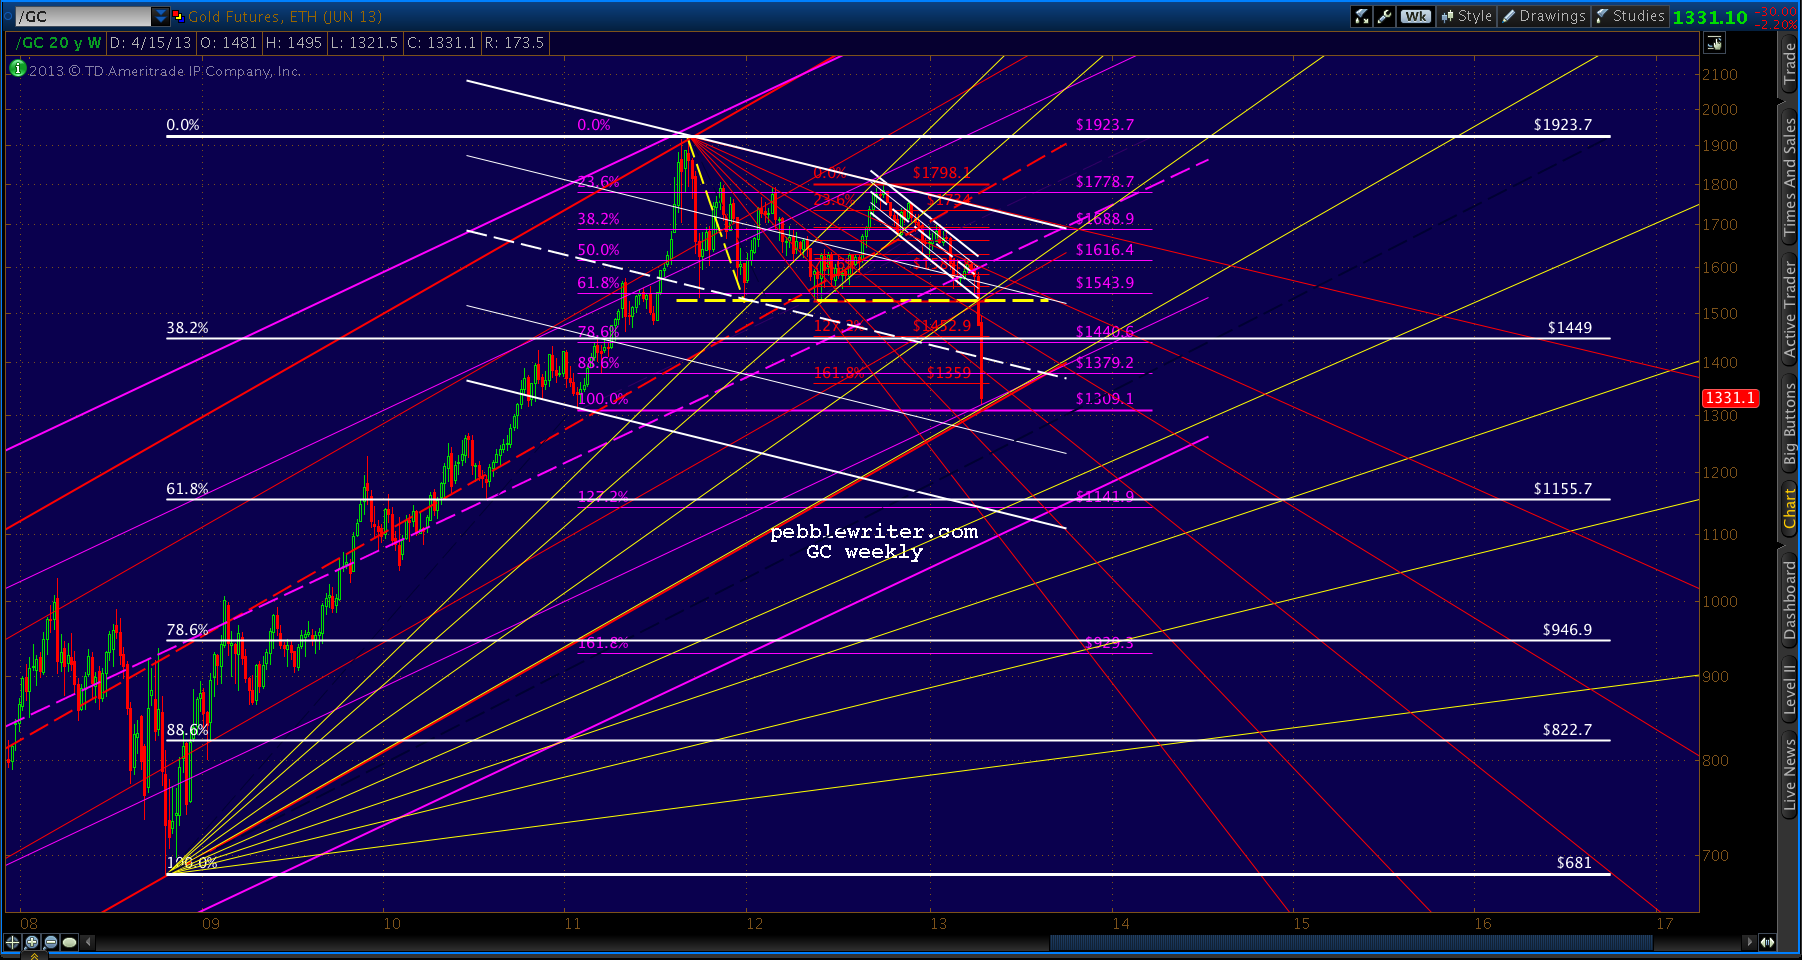
Remember that 1155 is the .618 retracement (in white below) of the huge rally from 681 in 2008 to last September's 1923 all-time high. Around July 15, the bottom of the big white channel and the bottom of the red channel intersect there with the bottom of the big purple channel (it replaced the red one that failed on Jun 20.)
This is the same price target we identified in our April 15 Update on Gold.
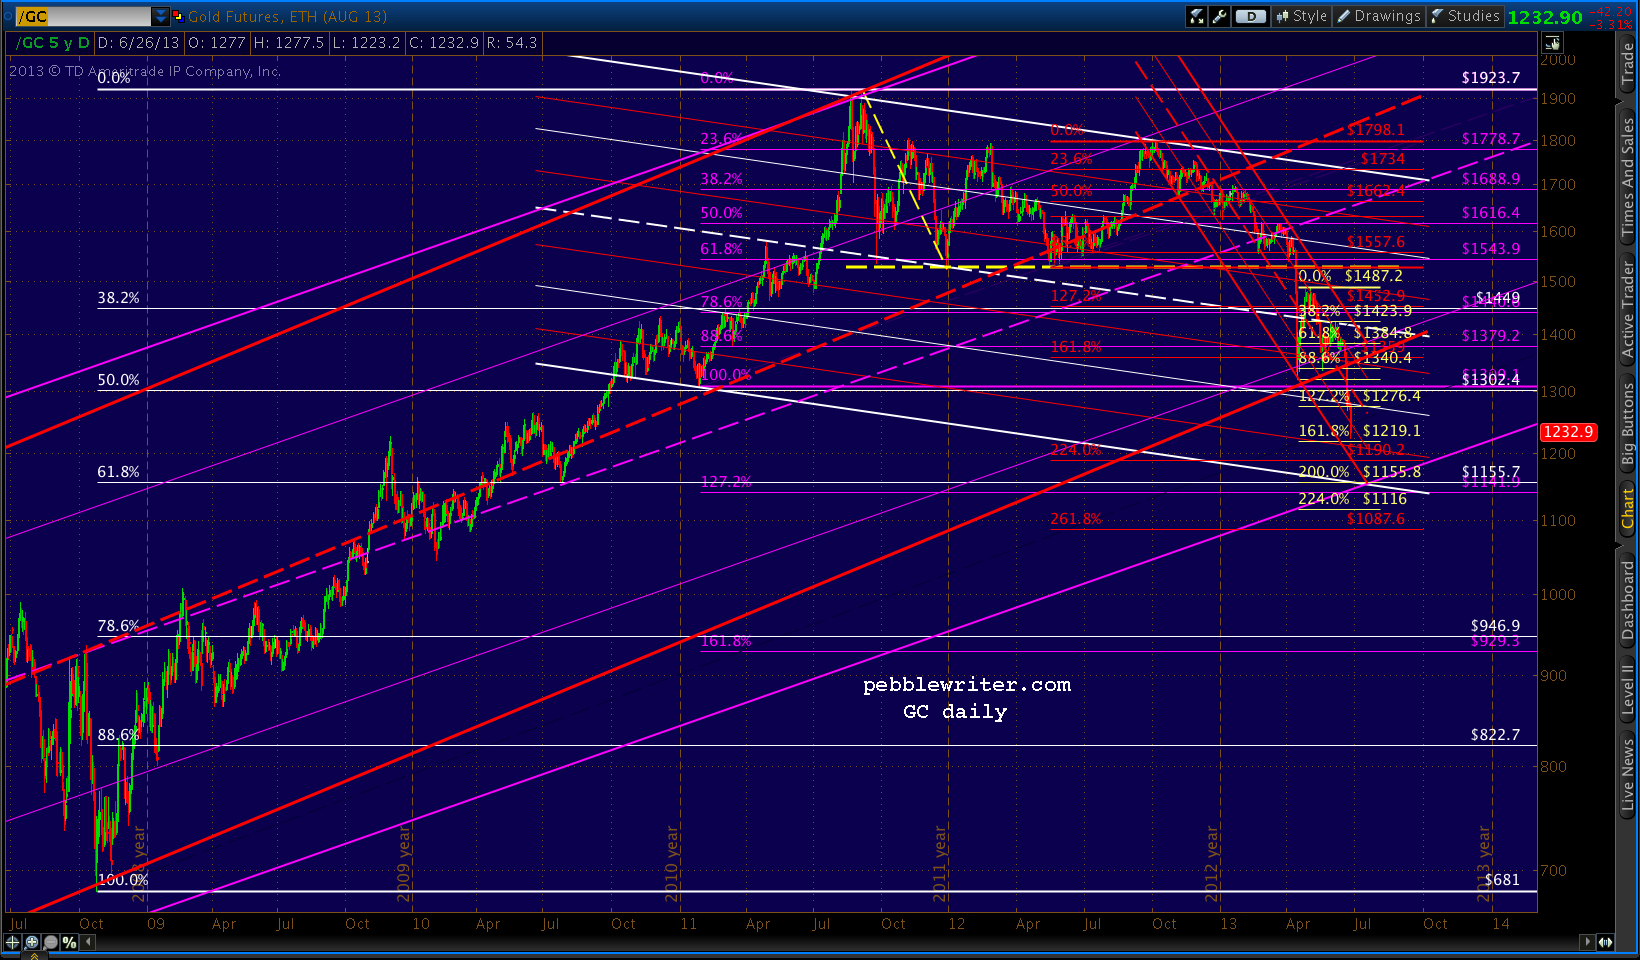
We can speculate about what circumstances might provide for a floor. The prevailing wisdom these days is yet another round of QE -- or at least inflation of some variety. With interest rates on the rise, that seems likely enough. We'll stick a pin in the idea of a mid-July market calamity that necessitates Fed intervention.
It's been over a month since I last focused on gold. The equities markets have kept me working overtime, and I assumed our May 15 forecast had long since jumped the tracks.
At the time, gold had plunged 270 to 1321 per ounce in only 4 sessions, bounced at 1321 (the day after our bottom call) to within 13 of our upside target, and was returning for a second bounce -- or not. From that post [Update on Gold: May 15, 2013]:
GC was closing in on the .786 retracement of the the rise off the 1321 bottom. Playing the bounce was a low risk trade as long as one used trailing stops.Now, at 1373, it has reached a critical juncture that should result in either a sharp rally to 1560 or a plunge to 1141 in the coming month or so.
Long positions could be played from the .786 (1357) or .886 (1340) as long as stops are watched very carefully and updated frequently.
The downside case is probably stronger. If the current plunge continues past 1321, there are only a few key levels of support before things get really nasty:
The bounce came a few days later at the .886 (1336) and despite gaining 84, couldn't clear the big white channel midline, much less the smaller red channel (white in previous charts) it had been in since last September.
- horizontal support at 1302-1309
- potential Fib targets of 1276 (the 1.272) or 1219 (1.618)
- Fib support at 1141-1157
- Fib support at 947
When the big red channel from 1999 broke down on Jun 20, GC plunged again. It failed to catch a bid at the first support level, but is approaching the second one this morning: the yellow 1.618 that completes the Crab Pattern at 1219.10.

This seems like an opportune time to update the forecast, as gold's price action continues to provide valuable clues as to investors' expectations about QE, the value of the dollar and inflation. Are the many calls for gold to fall below $1000 per ounce well-founded?
Probably not. We should get a decent bounce beginning at or near 1219 today that could take prices as high as 1320 or so by July 5-8. A continued rally through the red midline would mean additional gains to 1357-1385 by mid-July.
But, there's a better chance of a plunge to 1155 instead -- and it need not respect the Crab Pattern about to complete, especially if today's equity rally falters (gold certainly isn't buying the More QE! snake oil.)
Remember that 1155 is the .618 retracement (in white below) of the huge rally from 681 in 2008 to last September's 1923 all-time high. Around July 15, the bottom of the big white channel and the bottom of the red channel intersect there with the bottom of the big purple channel (it replaced the red one that failed on Jun 20.)
This is the same price target we identified in our April 15 Update on Gold.
We can speculate about what circumstances might provide for a floor. The prevailing wisdom these days is yet another round of QE -- or at least inflation of some variety. With interest rates on the rise, that seems likely enough. We'll stick a pin in the idea of a mid-July market calamity that necessitates Fed intervention.
...continued on pebblewriter.com...