Gold continued to melt down today, shedding another $126 and
continuing the plunge that started on Friday with the critical loss of
the LT channel we discussed last week, the horizontal support at
1520-1535, and the psychologically important 1500 level.
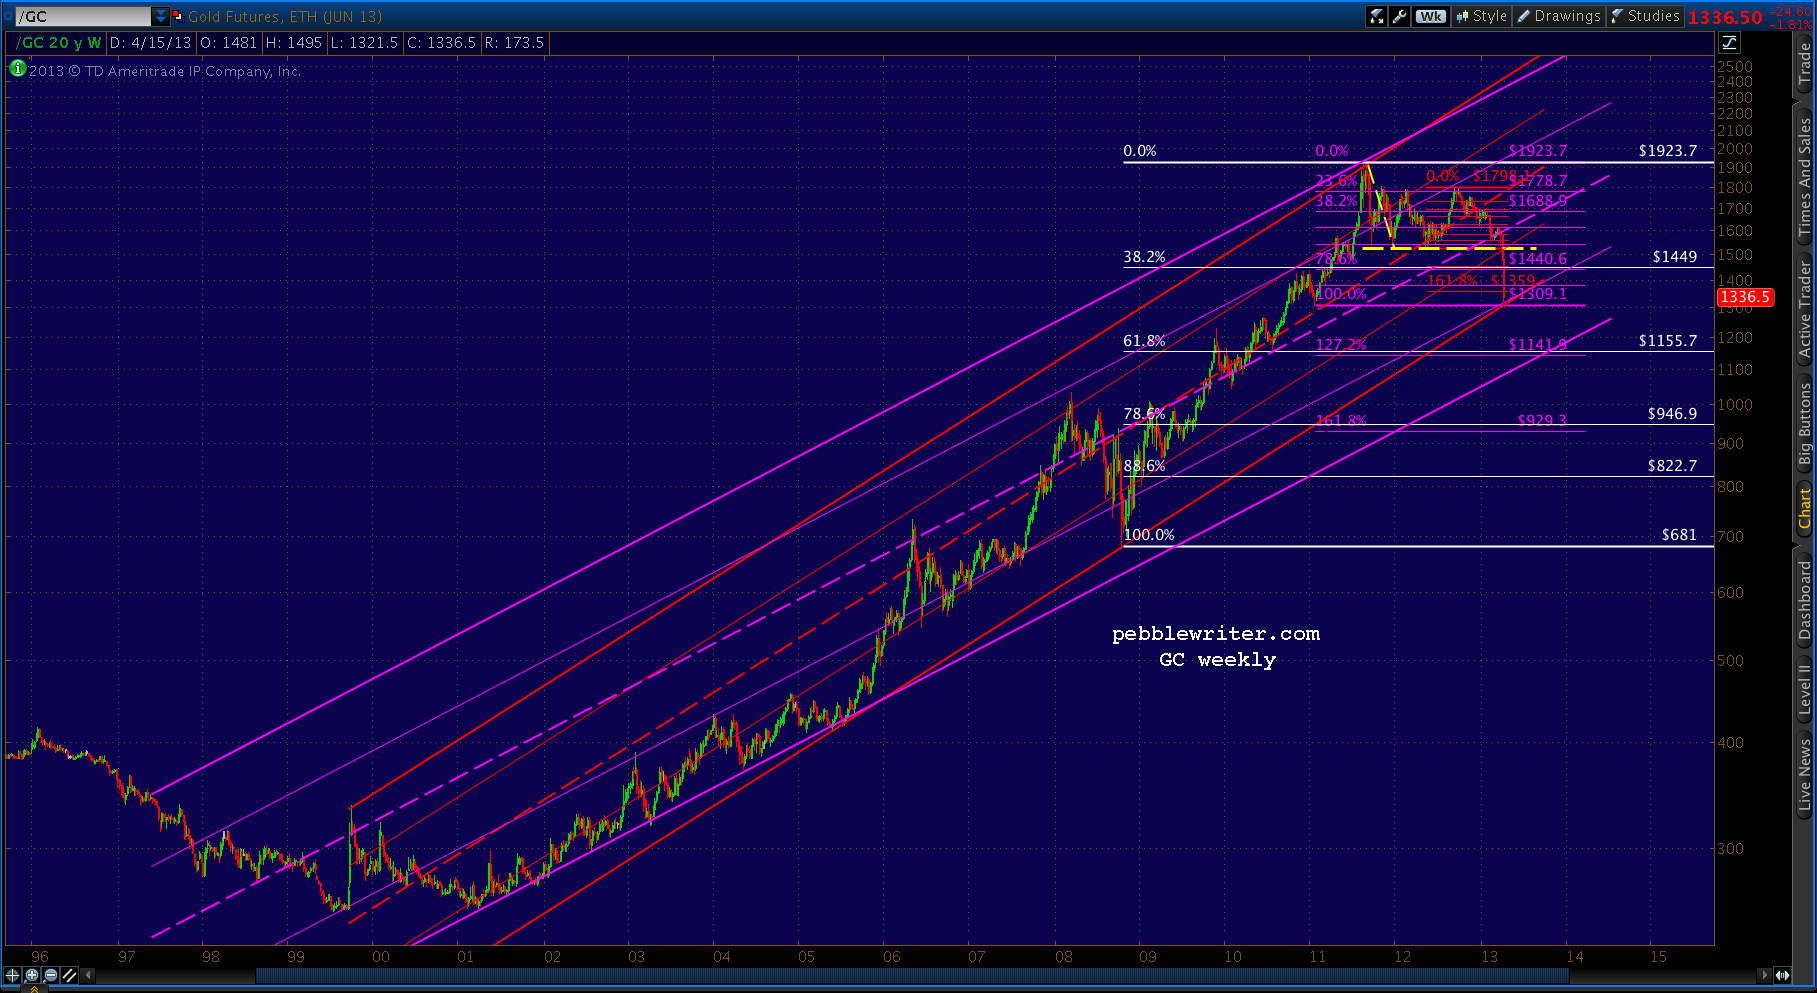
Gold had a nice bounce from 1539 to 1590 after reaching the bottom of the channel and the horizontal support of several prior bounces on Apr 4. In a dramatic demonstration of what can happen when channel support is lost, it has since shed almost $270/oz.
The red channel below represents my best shot at the new operative channel. It supports the idea of a bounce at the Jan 2011 low of 1309 -- 3rd on our list of potential bounce spots during today's onslaught.
Please note, I am not a gold bug. I don't advocate the purchase of gold. I shy away from most assets that increase exponentially in price -- especially those backed with the kind of religious fervor as is gold. They can drop with just as much enthusiasm.
The time may come when inflation is taking hold and it makes sense to switch everything you own into the metal... but, we're not there yet. It's a crowded trade, and IMO, today's price action underscores the risk.
So, the following is offered in the same spirit as my picks for NCAA champion, Best Picture, and Westminster Best in Show (the affenpinscher, really!?)
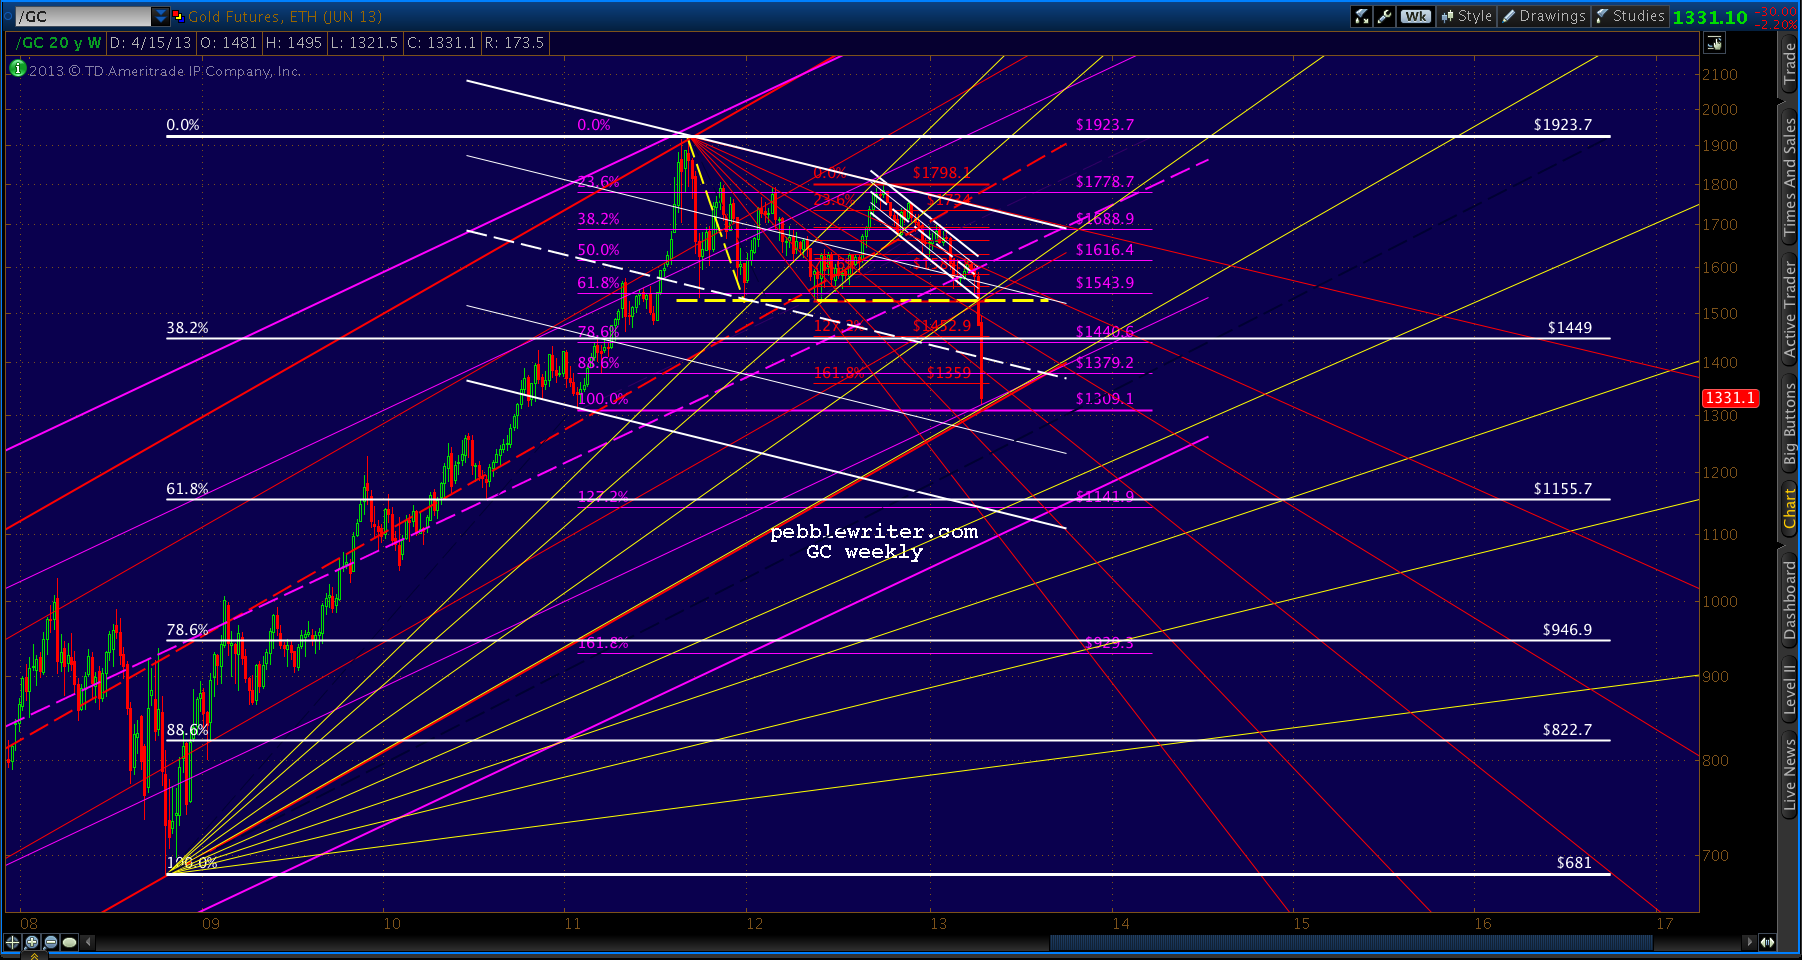
There's another channel (below, in purple) that kinda sorta supports the first, but shows the potential downside in the event that 1300 can't handle the pressure.
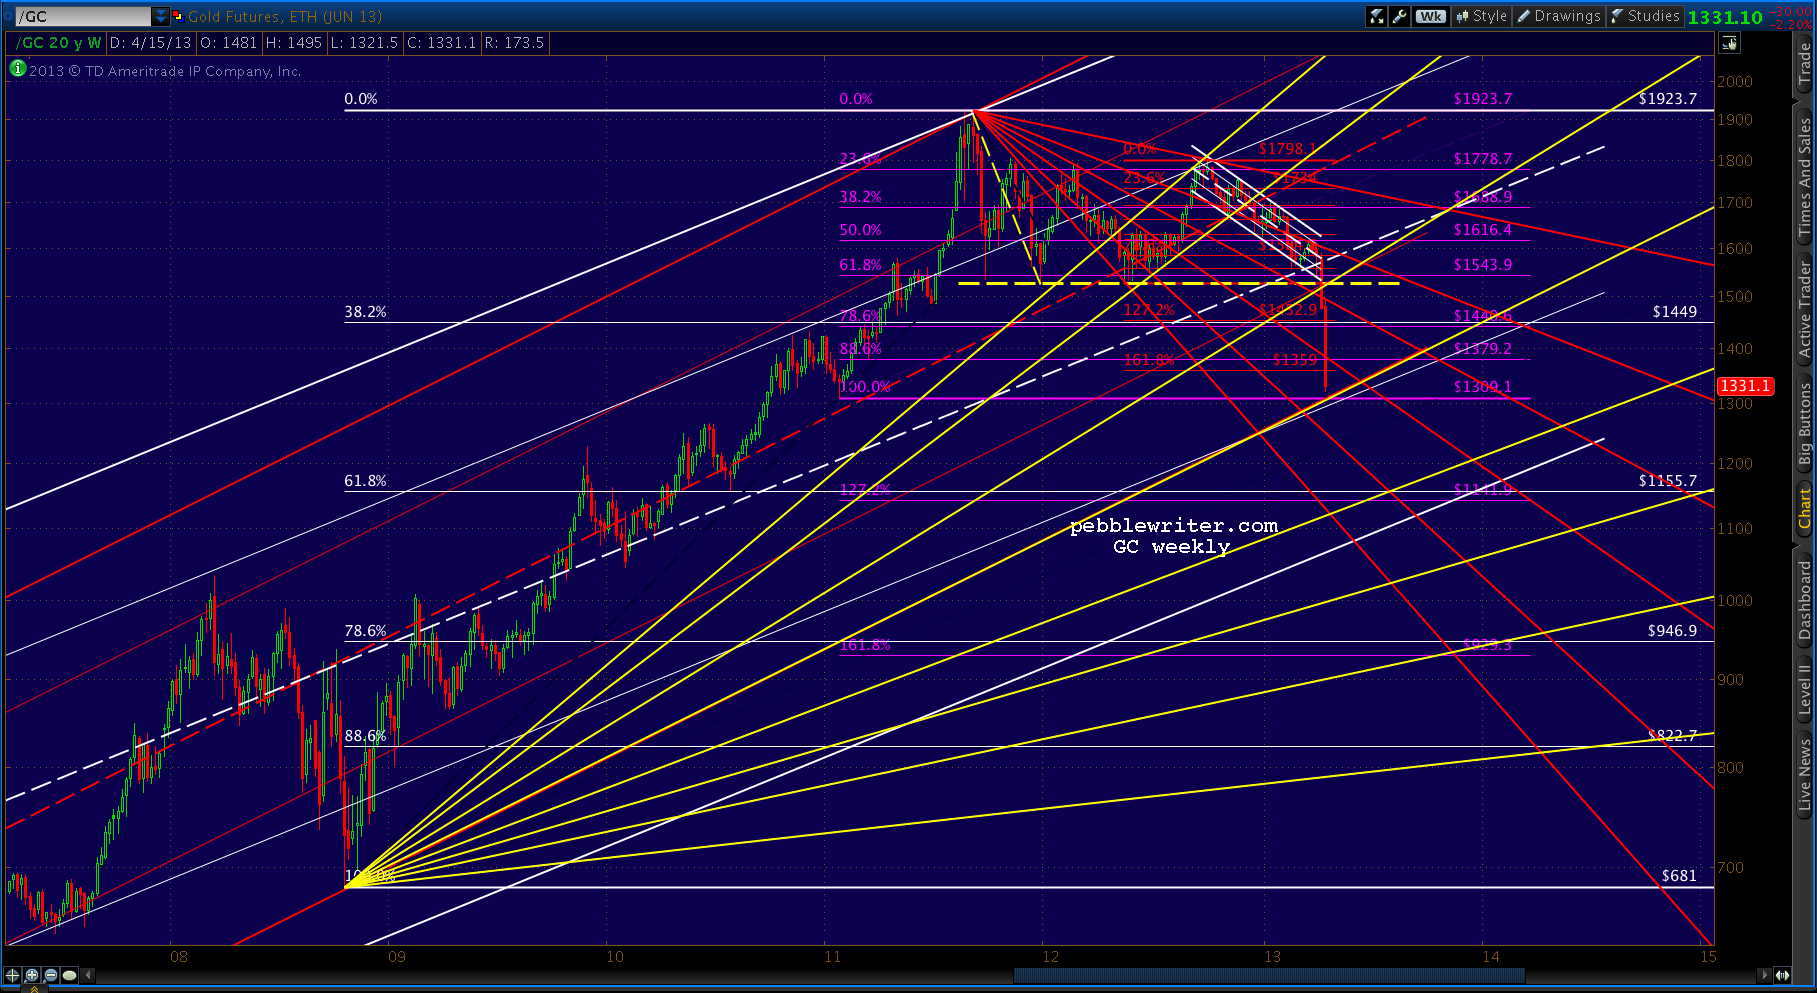
It's speculative, for sure. But, I like the fact that it crosses the white .618 at a key point in time, so I'll leave it up for now.What's interesting to me is the Fibonacci Fans that can be drawn on this chart. The ones from 681 low (yellow) have done a pretty decent job of guiding the bounces on the way down.
And, the ones from the 1923 high (red) have done well at halting several attempts at a breakout.
I could almost believe we've seen the worst of the drop, but I wonder about this potential channel...
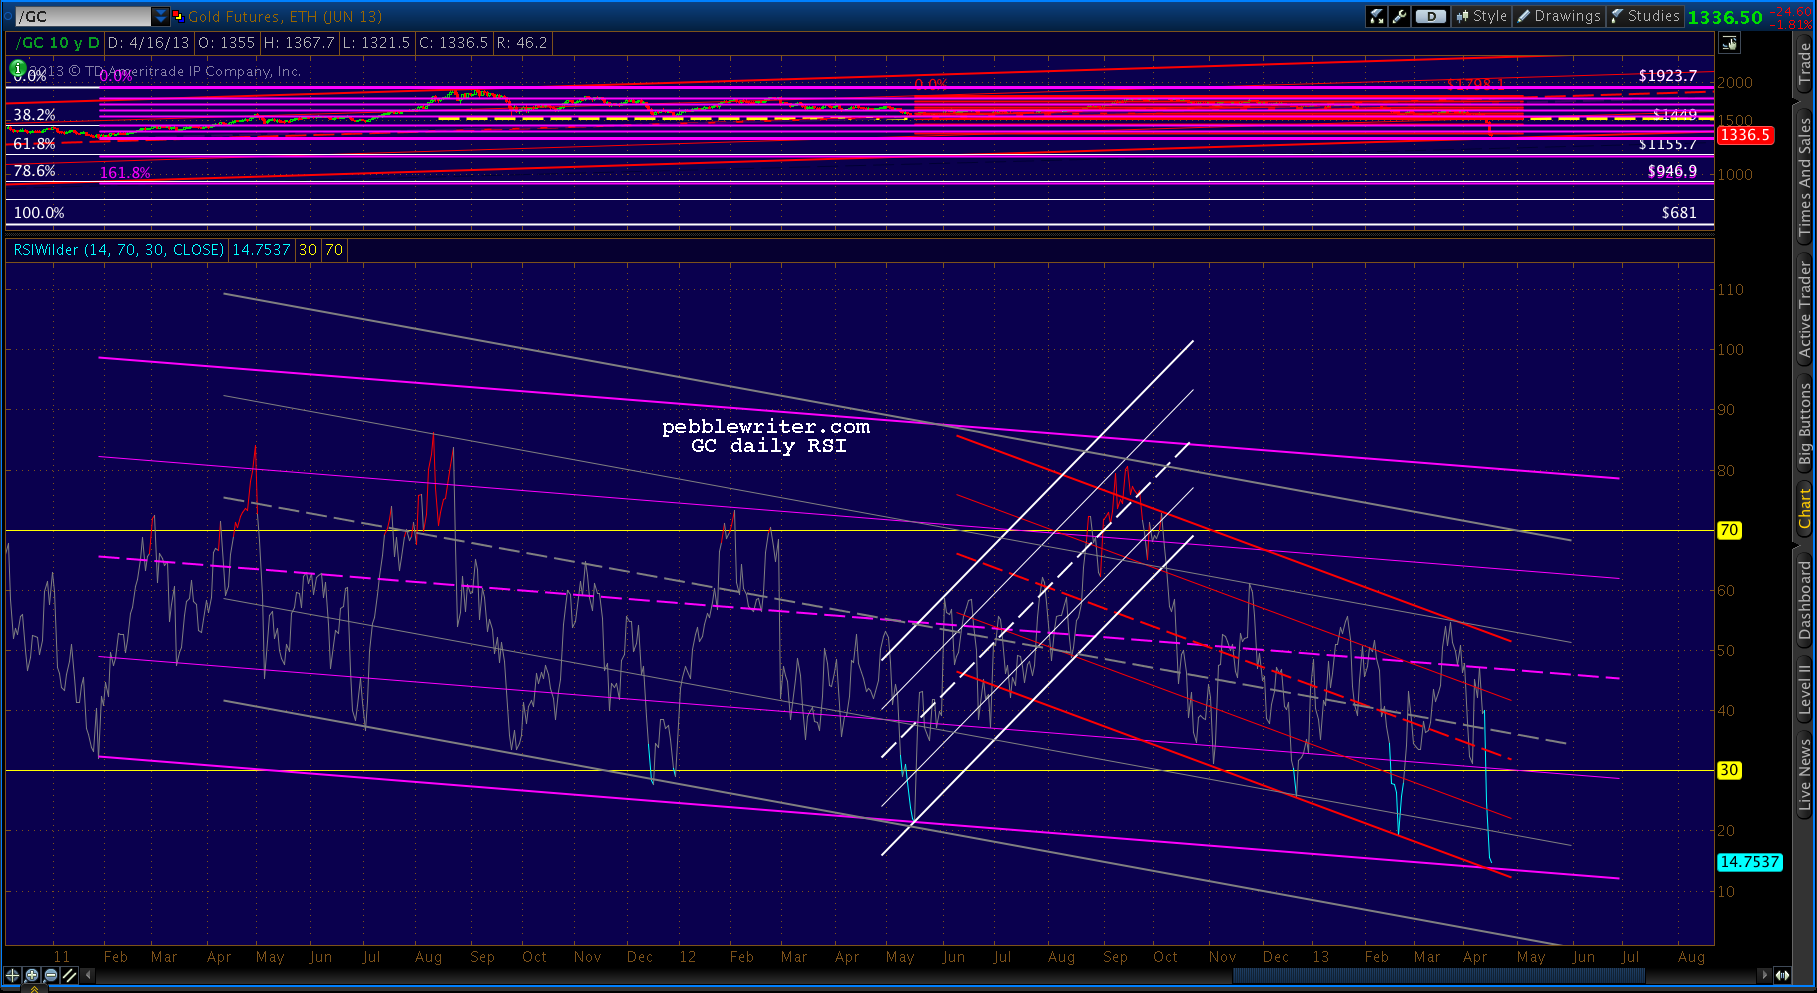
...and, the daily RSI -- which suggests at least a little more potential downside any way you slice it. The bottom of the purple and red channels probably correlates to 1309, while the bottom of the gray channel represents something much more ominous.
So, where do we go from here?
Gold had a nice bounce from 1539 to 1590 after reaching the bottom of the channel and the horizontal support of several prior bounces on Apr 4. In a dramatic demonstration of what can happen when channel support is lost, it has since shed almost $270/oz.
The red channel below represents my best shot at the new operative channel. It supports the idea of a bounce at the Jan 2011 low of 1309 -- 3rd on our list of potential bounce spots during today's onslaught.
The next best available channel is well below the current one, but supports the idea of a bounce at 1379 or 1359 -- the Bat Pattern and Crab Pattern completions shown in the first chart above. If those levels should fail to hold, the next major support levels are 1309 and 1155.We got good bounces earlier today at the first two: the Fib retracements at 1359 and 1379 But, along came the CME with announcements of increased margins and that was the end of that.
Please note, I am not a gold bug. I don't advocate the purchase of gold. I shy away from most assets that increase exponentially in price -- especially those backed with the kind of religious fervor as is gold. They can drop with just as much enthusiasm.
The time may come when inflation is taking hold and it makes sense to switch everything you own into the metal... but, we're not there yet. It's a crowded trade, and IMO, today's price action underscores the risk.
So, the following is offered in the same spirit as my picks for NCAA champion, Best Picture, and Westminster Best in Show (the affenpinscher, really!?)
There's another channel (below, in purple) that kinda sorta supports the first, but shows the potential downside in the event that 1300 can't handle the pressure.
It's speculative, for sure. But, I like the fact that it crosses the white .618 at a key point in time, so I'll leave it up for now.What's interesting to me is the Fibonacci Fans that can be drawn on this chart. The ones from 681 low (yellow) have done a pretty decent job of guiding the bounces on the way down.
And, the ones from the 1923 high (red) have done well at halting several attempts at a breakout.
I could almost believe we've seen the worst of the drop, but I wonder about this potential channel...
...and, the daily RSI -- which suggests at least a little more potential downside any way you slice it. The bottom of the purple and red channels probably correlates to 1309, while the bottom of the gray channel represents something much more ominous.
So, where do we go from here?
continued on pebblewriter.com...


