Today's
post concludes a week of publicly available intra-day posts, my little
gift to those considering a pebblewriter membership.
Seems like everyone's talking about the fiscal cliff. I'd like to take a moment and talk about another important issue: the Fee-scal Cliff.
As announced on Monday, subscription prices will increase on January 1. In keeping with our practice of paying for performance, the annual rate will be about $10 for each percentage point of return since the new site’s inception on Mar 22, 2012.
We’re up about 95% over those first nine months [SEE DETAILS HERE] so the new rates will be as follows:
If we are fortunate enough to continue averaging a little over 10% per month, annual memberships would be $1,200+ in March. So, locking in current prices is a no-brainer.
Sign up HERE.
Seems like everyone's talking about the fiscal cliff. I'd like to take a moment and talk about another important issue: the Fee-scal Cliff.
As announced on Monday, subscription prices will increase on January 1. In keeping with our practice of paying for performance, the annual rate will be about $10 for each percentage point of return since the new site’s inception on Mar 22, 2012.
We’re up about 95% over those first nine months [SEE DETAILS HERE] so the new rates will be as follows:
The first fifteen to sign up for an annual membership at the current rate of $800, however, will be granted Charter Member status. Charter Member rates are locked in for the life of the site, so you’ll never pay more — no matter where annual rates end up.
- Annual: $950
- Semi-Annual: $550
- Quarterly: $375
If we are fortunate enough to continue averaging a little over 10% per month, annual memberships would be $1,200+ in March. So, locking in current prices is a no-brainer.
Sign up HERE.
* * * * * * * *
Time is running out for the Heroes of The Hill. Market corrections don't require that everyone
turn bearish -- just the handful in the middle whose selling turns the
tide. Those investors who have been wondering, waiting hopefully for a
fiscal cliff deal to emerge from Washington... might at least a few of
them decide to rein in their equity exposure today?
Watch
this morning for the Chicago PMI -- due out at 9:45 EST. Last month,
it turned up slightly, but was considered bearish due to the decline in
new orders. From Briefing.com:
Briefing.com
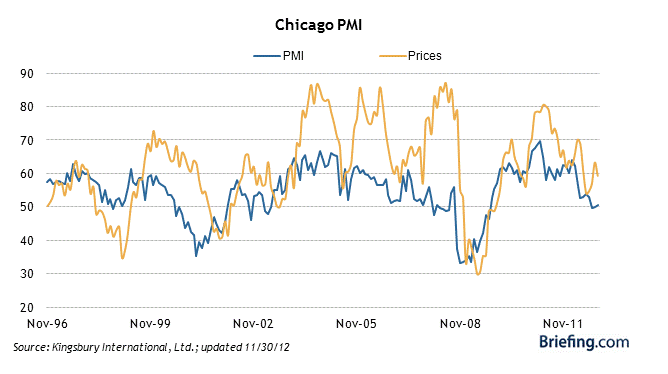
puts out great graphs, such as this one on the relationship between
pricing and the PMI itself. Not a terribly bullish looking chart.
UPDATE: 9:44 AM
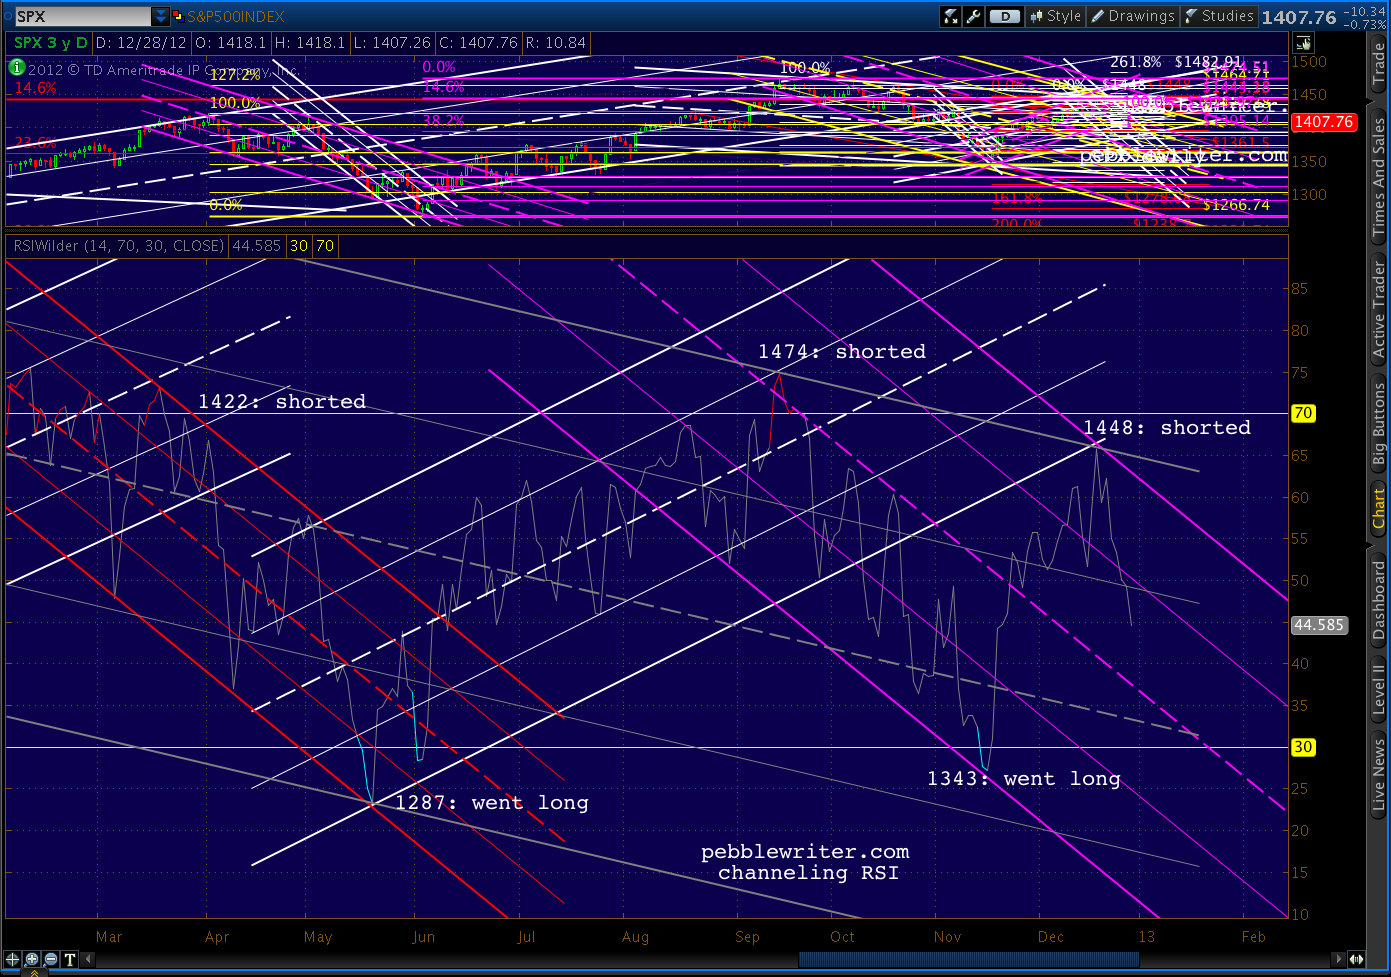
We remain short from 1447 on Dec 18. RSI has a long ways to go before finding any channel support...
Why
am I always talking about RSI? It might be the fact that it's helped me
call almost every major turn the past couple of years. As regular
readers know, I employ a deceptively simple-looking practice of
channeling RSI values in different time frames.
Combined
with Harmonics and other chart patterns, it has been very effective in
forecasting. Consider the past six months alone...
April 2 -- Shorted: SPX completed a Butterfly Pattern
at a channel top at 1421.05. It was also the third lower RSI value in a
row on higher prices (negative divergence) after RSI tagged a channel
midline. See: All the Pretty Butterflies.
June 1 -- Went Long:
SPX reached the bottom of an RSI channel, back-tested a falling wedge
and found harmonic support -- all at the price levels forecast by an analog that had been going gangbusters since April 9. See: Why I'm Buying.
September 14 -- Shorted:
SPX had completed a Bat Pattern that dated back to October 2007, tagged
RSI and price channel lines. VIX and DX RSI channels also indicated
impending reversals. See: The World According to Ben.
November 16 -- Went Long:
SPX had reached three important harmonic targets, reached a H&S
Pattern target, tagged RSI and price channel bottoms -- all at a price level forecast on October 31. See: CIW Nov 16.
December 18 -- Shorted: Prices overshot our forecast target by 6 days and 10 points, completing a Gartley Pattern
set up by the 1474 - 1343 drop. But, in the process, daily RSI
completed a perfect back-test of the recently broken channel that had
governed the rally since June. See: CIW Dec 18.
Together,
these major moves accounted for returns of about 40% since the new
site's inception on March 22. The other 55% came from interim swings
ranging from an hour to a few weeks [see: Results.] But, all of them were influenced
by RSI channels.
I
don't know of any analysts who use them. A Google search for the term
"RSI channel" shows a whopping 3 hits in the past month -- two of them
from this site. Have folks tried them and failed, or are they just too
complicated?
Though
they're almost always obvious in the rear-view mirror, RSI channels can
be very difficult to use in forecasting. Charts drawn in different
time frames can suggest very different results. They're tough to use in
choppy, directionless markets. And, divergence is always a challenge.
In
short, RSI channels aren't for everybody. It helps if you enjoy
staring at charts for hours at a time, and can pick out patterns in a
jumble of seemingly random lines. It also helps to understand higher
math, as RSI is essentially a derivative of price movements (magnitude
and velocity of price changes.)
If you're thinking about using RSI channels, you might want to start with an aptitude test -- available here.
Or, just tune in each day and I'll let you know what I think. After a
year of practice and a few thousand charts, I view them as an
indispensable secret weapon.
UPDATE: 12:20 PM
Chicago PMI [download here]
actually increased from 50.4 to 51.6 this month -- though it would
still have been below 50 if not for the always handy "seasonal
adjustment."
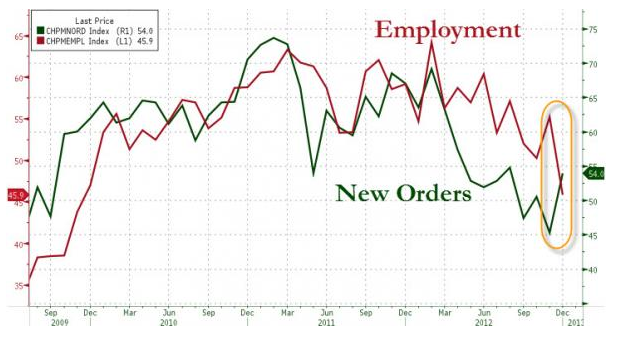
The
increase again conceals a troubling development: employment and capital
spending are both sliding. New orders rebounded almost to October
levels, but CapEx hit a new 28-month low, while employment plunged from
55.2 to 45.9 -- the lowest level in three years.
continued on pebblewriter.com...


