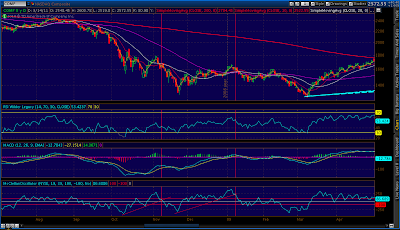
In short, when the indicator bounces sharply higher after a distinct low, draw a trend line that connects the low to the subsequent dips. When it breaks that trend line, there's a pretty good chance we're putting in a high.
It works best when the starting point is relatively low, say -200, the number of touches is 3 or more, the shape of the indicator is very convex relative to the trend line, and the indicator makes it to +200 or so.
When each of these conditions is met, I've yet to see an instance where it didn't result in a pretty healthy drop.
Here are a few examples from the past five years using COMP.
 | |||||||||
| Dec 07 |
 | |
| Nov & Dec 09 |
 | ||
| Jun 10 |
And, the latest examples... Note the most recent case corresponds to the Aug 31 interim high. The previous one belongs to the Jul 8 high, which I view as the beginning of the end of the latest bull market.
In both cases, the market high was quickly followed by another slightly lower high that registers as a (post-trend line break) lower peak on the MCO indicator. It typically comes in at around 100.
 |
| Jul and Sep 2011 |
In many previous cases, it's this second, lower high which marks the start of the most dramatic phase of the downturn. It was certainly true in 2007 and in Jul 2011.
I've thrown a few other goodies in that last chart. I've drawn in another way of looking at the downward sloping channel. Beginning with the pattern high, it intersects with a horizontal support line which also happens to be the broken neckline for the gigantic head & shoulders pattern that just played out.
Here's the view from 20,000 feet. Note that the three upward sloping TL's are actually fan lines originating at the Mar 09 lows. The old adage with fan lines is "three strikes and you're out" which means, the next drop below a fan line will be the most memorable.
 |
| Fan Lines |
Should be a memorable next few days.

Thanks Pebblewriter, your analysis is always fantastic (and original to boot).
ReplyDeleteThanks, Spud, I do try. When the going gets tough, go original, right? Good trading!
ReplyDeleteYou're a must daily read, Pebblewriter. MANY thanks for your labor and insights.
ReplyDeletewhere have you gone? market action is contrary to everything you have posted in the last couple days...
ReplyDeleteI rode the wrong horse, thinking that the channel we were in would do the trick, when it was the fan line I should have put my faith in. Look at today's intraday for more.
ReplyDelete