I've drawn in 2-standard deviation regression channels. You might notice that the only key difference between the 2007 and the 2011 charts is that in 2007, the final push rises to the midline, or zero channel. At today's top, and I think is is one, we're right at the +1 channel. Both are emphasized in yellow dotted lines.
Together:

The 2007 top:

The 2011 top:

One other note:
Anyone who slogged through those early posts (here, here and here), where I played around with different means of identifying these topping patterns, knows that I vacillated between regression channels and fan lines. In the end, I went with the fan lines.
I didn't discuss it at the time, but I was always bothered by the way the 2011's top didn't rotate over to properly match the slope of the obvious fan lines. The +/- 2-standard deviation channels didn't line up with the pattern highs and lows. I wondered if the channel would achieve the proper slope once the pattern was a little more mature.
Today, the channel lines line up perfectly with the fan lines we've drawn. The highs/lows are right at the 2-std. dev. boundaries, and the slope is very, very close to that of the 2007 and the 2001 tops.
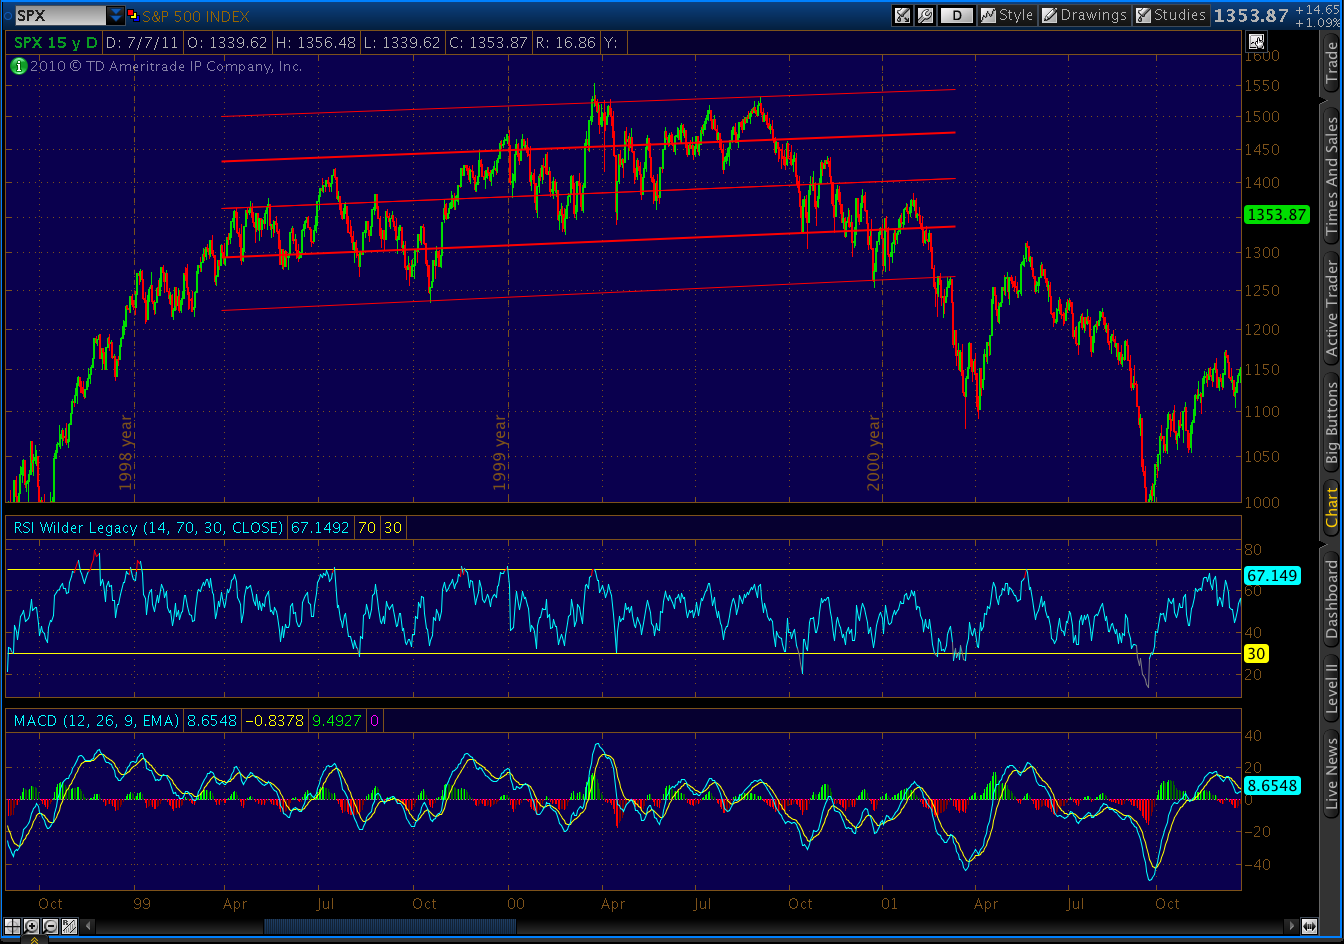
BTW, here's the 2001 top, for comparison purposes. We came up 30 points shy of the mid-line. Today, we exceeded it by 30 points. Funny how that works.
I think we decline dramatically from here. Between the rising wedge, the divergences, the unimpeded climb on low volume, the Crab pattern, and the Head and Shoulders pattern [details at Confidence Fairies and Snowballs] and this final piece of the similarity puzzle, it's time to put a fork in this market.
vix hollow red bar reversal candle
ReplyDeletePebble, look at this normalized CPCE (equity PCR) chart and see how multimonth rallies came after this extreme seen in June 2011.
ReplyDeletehttp://stockcharts.com/def/servlet/Favorites.CServlet?obj=ID2393449&cmd=show[s157645899]&disp=O
I watch the 10 day moving average, which shows a hook up when we've made an important top. We're seeing such a pattern now.
ReplyDeleteI agree. BUT. What I mean though, is the massive extreme in equity (dumb money) put buying in June was on a par with Feb 07, Aug 07, and Bear Sterns. All led to at lest a two month rally. And summer is the time the B team can shuffle the market sideways on no volume. Thoughts?
ReplyDelete