... "everything looks like a nail" is the old saying.
Harmonic patterns aren't too hard to spot. Look for a big W, right side up or upside down, where each leg is a partial retracement of the previous one except for the last, which extends the previous leg but ends as a retracement of the first. The retracements should be in accordance with harmonic numbers (usually .382, .5, .618, .786.) http://www.investopedia.com/terms/g/gartley.asp
The good news is, they work pretty darned well -- indicating a significant reversal with 70% certainty. The bad news (besides the 30% wrong calls) is that once you start looking, they're everywhere. And, because they're harmonic they often nest inside one another in different degree, even morphing into one another where a CD leg feeds into a XA leg, etc.
As a (slightly autistic) guy who sees patterns everywhere, I get excited when they confirm other harmonic patterns and technical analysis. I believe that's the situation we're now facing.
Among Elliott Wavers, there is some disagreement as to whether we've finished P[2] or not. There are "problems" with various counts. My favorite analyst and blogger, Daneric, remains open to alternative counts. He's been doing this forever, so that's good enough for me. One road leads to SPX 1380, the other to 1200.
So, what's an investor to believe? For me, that's where Harmonics come in. I'm following three patterns:
(1) a bullish pattern on SPX indicating a short-term upside of 1380 (the next week or so.) The alternative is that the decline has already started (see below.)
(2) a bearish pattern on VIX, also indicating a short-term rise in stocks (VIX collapsed 8% after this chart was printed at 9am this morning.)
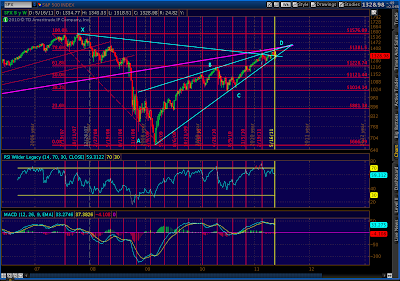
(3) a long-term bearish Gartley pattern on SPX indicating 1281 is the end of our road after rebounding from the Mar '09 lows. This chart shows the 87-day cycle lines as well.
The SPX daily chart ties everything together pretty well. Note the rising wedge, overhead resistance with the Supercycle line and the .786 Fib, and the 87-day cycle date of May 16 (past cycles have varied by up to 15 days, or June 3.)
I'm clueless about the wave count. But, I wouldn't be surprised if we bounce off the RISING WEDGE (chart 3) to complete the ST BULLISH GARTLEY (chart 1), thereby completing the LT BEARISH GARTLEY (chart 2) at around SPX 1380 sometime before June 3 (105 days on the 87-day cycle.) The falling VIX is icing on the cake.
Once caveat: it may have already started. At 1318 earlier today, the SPX was off 3.8% from its highs. It's not much, but it could easily be the 87-day cycle decline in progress -- or even the whole enchilada. But, the Gartley patterns on VIX and SPX tell me we have one last bump up before it's time to stick a fork in this thing.
Bottom line, I'm not going to heap on the puts if we drop a little in the morning. I'll see if we bounce off the rising wedge and start back up. If we break decisively through 1310...forget I said anything.


Hi Pebblewriter,
ReplyDeleteThanks for your feedback on dan's page earlier...Based on the Bullish Gartley you had mentioned, I used my algo to compute the values of E using the same X,A,B,C,D reference points you had used and I got the following
IDEAL TARGET E wave 0.618 retrace..I have listed them based on fib retracements. Very similar to what I got the D target in the bearish Gartley...Interesting
0.38 1334.1453
0.5 1338.9750
0.62 1343.8047
0.79 1350.6810
1.27 1370.4911
1.62 1384.7347 Thanks!!
Also of interest
ReplyDeleteD hit 1.38 retracement
E (if 5/19 high is the high) is .75 retracement
Maybe I should program these levels in my algo
I had posted this question on Dan's page and am asking here again, In your experience does the actual price hit the exact fib value or coming close is good enough? Thanks!
It varies a lot. The target I've been using is to add the quantity XA to the finishing D point (or subtract it, as the case may be.) It worked really well on the VIX, which came within .40 of it's 15.10 target. The thing you have to watch out for is the trend. I think traders who use the Gartley and other harmonics are quick to jump out once they're about 2/3 of the way to their target if they sense a change in market direction - such as today. Can't blame someone, as that's a pretty good return for a few days' work.
ReplyDeleteOh, and yes. Your target of 1384 sounds about right. As we're discovering today, it's rarely a straight line!
ReplyDeleteI'll post more later about another, larger Gartley I'm following that should subsume the bullish prediction currently in place.