We earned 1.25% on a day when the market was up .07%. A good start to the fourth quarter. To celebrate our 27% third quarter, we're offering discounted annual memberships to the first 30 takers. For more information, please click here.
* * * * * * * *
ORIGINAL POST: 9:40 AM
We posted this chart early last Friday morning [see: CIW Sep 28]:
SPX is selling off this morning, but should find support at the purple channel bottom around 1435-1436 and rebound... If the channel does hold, preferably at the .786 or .886 of the pink pattern, look for the Gartley Pattern we discussed yesterday to complete at 1456.21. Why? Yesterday’s high was a perfect Fib .618 retracement of the 1463.20 to 1430.53 drop.
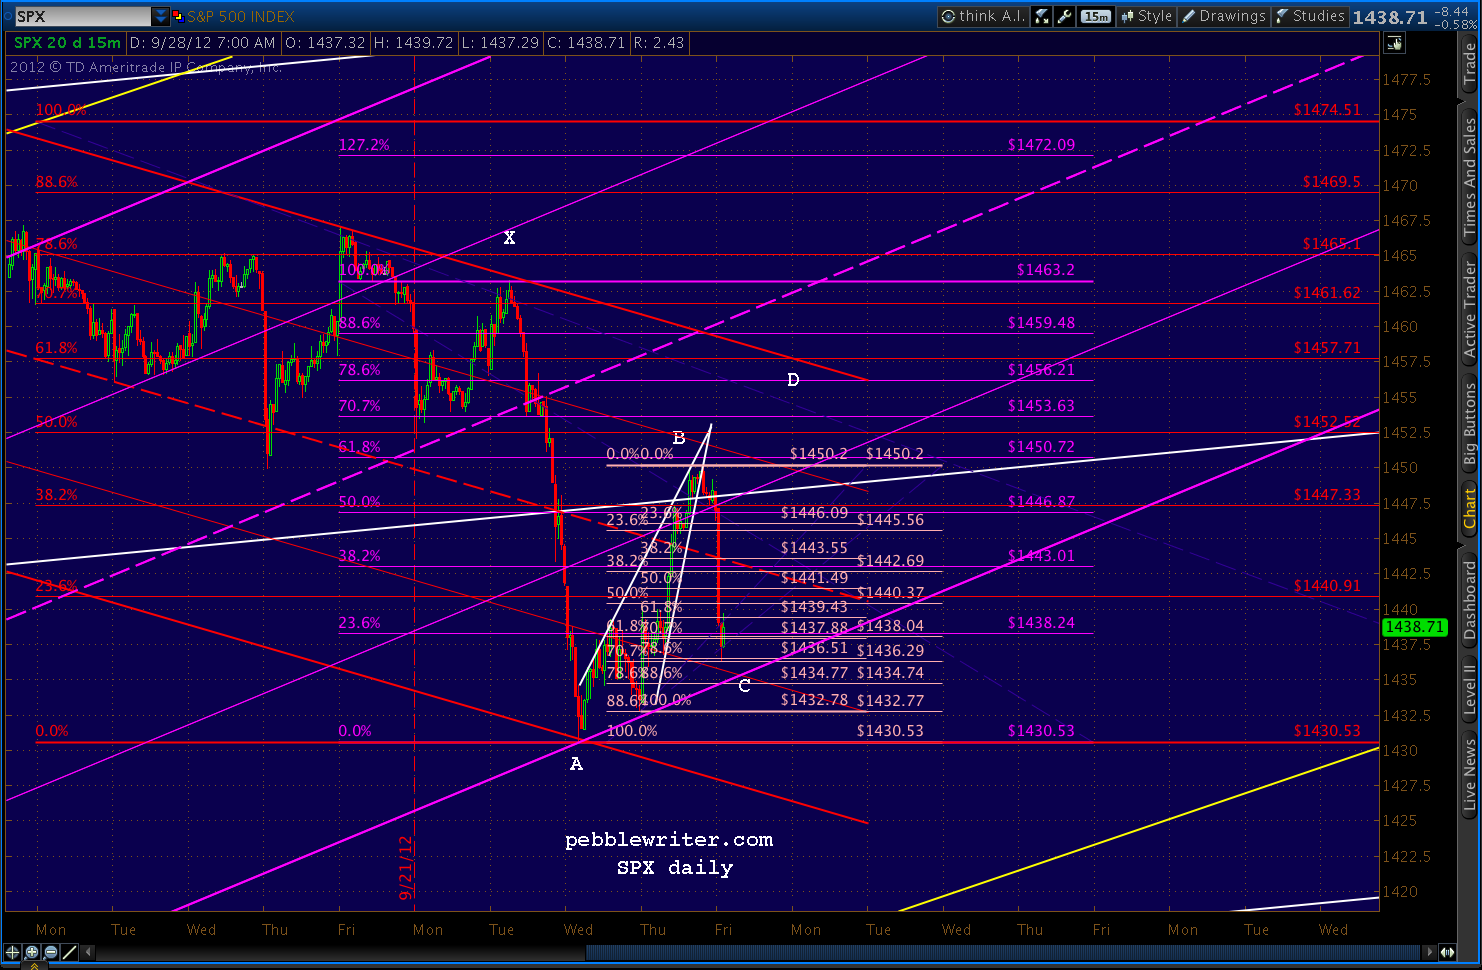
In fact, SPX reversed at 1435.60 minutes later, starting up right at our Point C. That leaves the Gartley Pattern completion at 1456.2 (Point D) as our next target. Don't look now, but it's not all that far away.
SPX just hit one of our interim targets at 1450 -- the upper bound of the channel it's been in (and fell out of) for the past several days. This also represents one of the larger red channel lines and is the Sep 27 top, so we should get a reaction here.
But, we will likely go higher. Why?

Note that on the 27th, we reversed at the .618 retracement of the 1463 - 1430 drop. This set up a potential Gartley Pattern at 1456 or Bat Pattern at 1459.
In the midst of that range is the .618 of the larger 1474 to 1430 drop at 1457.71. And, the top of the red channel is currently at, drum roll please, 1457.
In other words, we should get a decent downturn somewhere in the 1456-1459 area -- with 1457 being my favored target. We remain long from 1437, but I plan on taking profits and playing the downturn at that point. I'll look for a shift in momentum first.
More in a few...
UPDATE: 10:10 AM
That's close enough for me. Going short here at 1457, with stops at 1460.
We could see one last spurt and tag 1459 or so, but I'd rather bank the 20 points we've earned in the past week and play the reaction.

Note there is another way of looking at the upside since last week -- a relatively flat channel shown below in pink.

Think of it as a rising channel within the falling red channel within the rising purple channel which is within the rising yellow channel. It's easier to see here...

[Editor's Note: there followed a study related to our longer-term forecast, available to pebblewriter subscribers. 1457.14 was the actual high for the day, so our decision to sell at 1457 was correct.]
UPDATE: 1:00 PM
The sell-off since this morning's high of 1457 is pausing here at 1448, the next lower red channel line -- also the .500 of the last run-up (smallest purple pattern) and the .500 of both the largest yellow pattern and the red pattern.

It could reverse here, but I think there's more downside ahead. I'll stay short, but continue to lower my stops. We've made a nice 9 points since shorting at 1457, and I don't want to be too quick to cover.
I'd like to see it reach the bottom of the pink channel at 1442 or so, the .786 of the latest move up and the midline of the red channel. The bottom of the purple channel is at 1439.
UPDATE: 1:15 PM
SPX made it past the 1448 level and just reached 1445, the .618 of the rise since 1437 (small, purple pattern.) There's a much greater chance it will stop here, although there's still downside potential to 1439-1442.

I've drawn a rising purple channel that reflects the upside case (within the pink and red channels.) If this channel holds, we should get a bounce back to the 1447-1450 area. This also represents the midline of a potential falling channel (in grey) that does a pretty good job of capturing the downside since 1457 this morning.
If we reverse there, it's on down to 1439-1442. So, I think the way to play it is to stay short, but lower stops to 1447ish until we see which case plays out.
The dollar suggests the move might be over, as it just hit its midline in the midst of a decline from the top of its channel to the bottom.

In fact, upon further reflection, I'm going to cover the short here at 1445 and go long again, with stops at 1442. I'm probably leaving money on the table, but I trust what the dollar's telling us at the moment.
The bounce could be as small as 1452. Charts in a few...
UPDATE: 1:55 PM
I think that was the right move. The 1.618 of the decline from this morning is 1464.77 -- right at our 1465.10 target for completion of the Gartley mentioned at the top of this post. Recall this represents the .786 of the move down from 1474 to 1430, and would be the bullish interpretation of the .618 tag this morning.
But, that would mean a break out of the red channel that has done a magnificent since 1474 on the 14th -- not a small matter.
More in a few minutes....
UPDATE: 2:05 PM
We have to watch the little purple channel discussed at 1:15 PM like a hawk. In the past two weeks, breaks of this channel have dealt swift corrections twice -- particularly when they followed a tag of the upper red channel line (15 and 33 points.)

UPDATE: 2:30 PM
I'm raising my stops again, to 1446.50. The dollar looks like it wants to spike lower (79.515) towards or shortly after the end of the day. If so, we should get another spike up in stocks toward the end of the day.

UPDATE: 3:10 PM
Just got stopped out of my long position and going short, probably to 1439-1442 -- the bottom of the pink channel. Will likely take another stab at longs there. Favorite target 1440.14.
We'll know it's time when the dollar breaks down from its little rising wedge -- seen here on the 5-min chart. Note it's done hardly anything through this entire sell-off in stocks.

There's a good chance it'll tag the purple channel midline one last time first -- currently around 79.95, and head back down.
UPDATE: 3:37 PM
DX's RSI has broken down from its rising wedge, price should follow within minutes. That's good enough for me. Closing out shorts here at 1422 and playing the upside on SPX. Initial target is around 1452-1456 tomorrow.

I can envision one last push lower on positive divergence, so I'll set stops fairly loose -- say 1439. Keeping some powder dry just in case.
* * * * * * * *
TO RECAP...
We shorted at 1457, within .14 of the top, targeting 1439-1442 on the downside (after scoring 20 points on the upside from last week.) We rode SPX down to 1445, at which point we went long with stops at 1442, later raised to 1446.50.
I should have stayed with my original target, because we got stopped out at 1446.50 and went short again, again with our original target of 1439-1442.
The low for the day was, in fact, 1440.98. We covered our short at 1442 and went long into the close, with the understanding that it might dip a little lower in the morning.
All told, we made 18 points (+1.25%) on a day when the market was up 4 points (+0.07%) from Friday's close. It's a good start.
That's 1.25% on top of last week's 2.44% and September's 11.93%, the third quarter's 27.6%, and the 66.5% since inception a little over six months ago [details here.] It won't happen like that every day (if only), but we get more than our share.
Making money in both up and down markets requires anticipating and recognizing likely reversal points and taking appropriate action. Our unique blend of chart patterns, harmonic patterns and technical analysis -- along with a dollop of economic analysis -- might be worth a try.
We have two full quarters under our belt since going pro last March after almost a year of Blogger posts (here!) My goal was to bring a higher level of professionalism to the process. So far, so good.
* * * * * * * *
In celebration of another great quarter, we're offering 30 annual memberships to the new pebblewriter.com at a discount to the regular price. For more details, please click HERE.
No comments:
Post a Comment