MAY 19, 2012
When I first floated the idea of going pro with pebblewriter.blogspot.com, one reader's response really struck a chord:
In
getting the economy apparently going again, a serious stock fall would
not help...so it won't happen until every card is played... So it's up
and up... with perhaps a brief pause for technical patterns...a few
plateaus to get the attention of the manipulators to get the machine
running again.
Sure enough, following the original
pebblewriter's phenomenal first few months, I found myself stopped out
multiple times as normally reliable chart and harmonic patterns were
overwhelmed by the money printers' manipulative efforts. Was the reader
right? Was it time to throw in the towel and buy an index fund?
Instead,
I buckled down and worked harder. I augmented my techniques with
additional indicators. I learned how to apply harmonics to both price
and time. And, I began a search for more analogs -- the type of pattern that
enabled me to score a 28X in July-August 2011. The new pebblewriter.com reflects those efforts and IMHO is off to a phenomenal start.
How
phenomenal, exactly? Suppose you began following the new site when it
went live in late March and did nothing but buy the S&P 500 when I
called the bottoms and sold short when I called the tops. You would
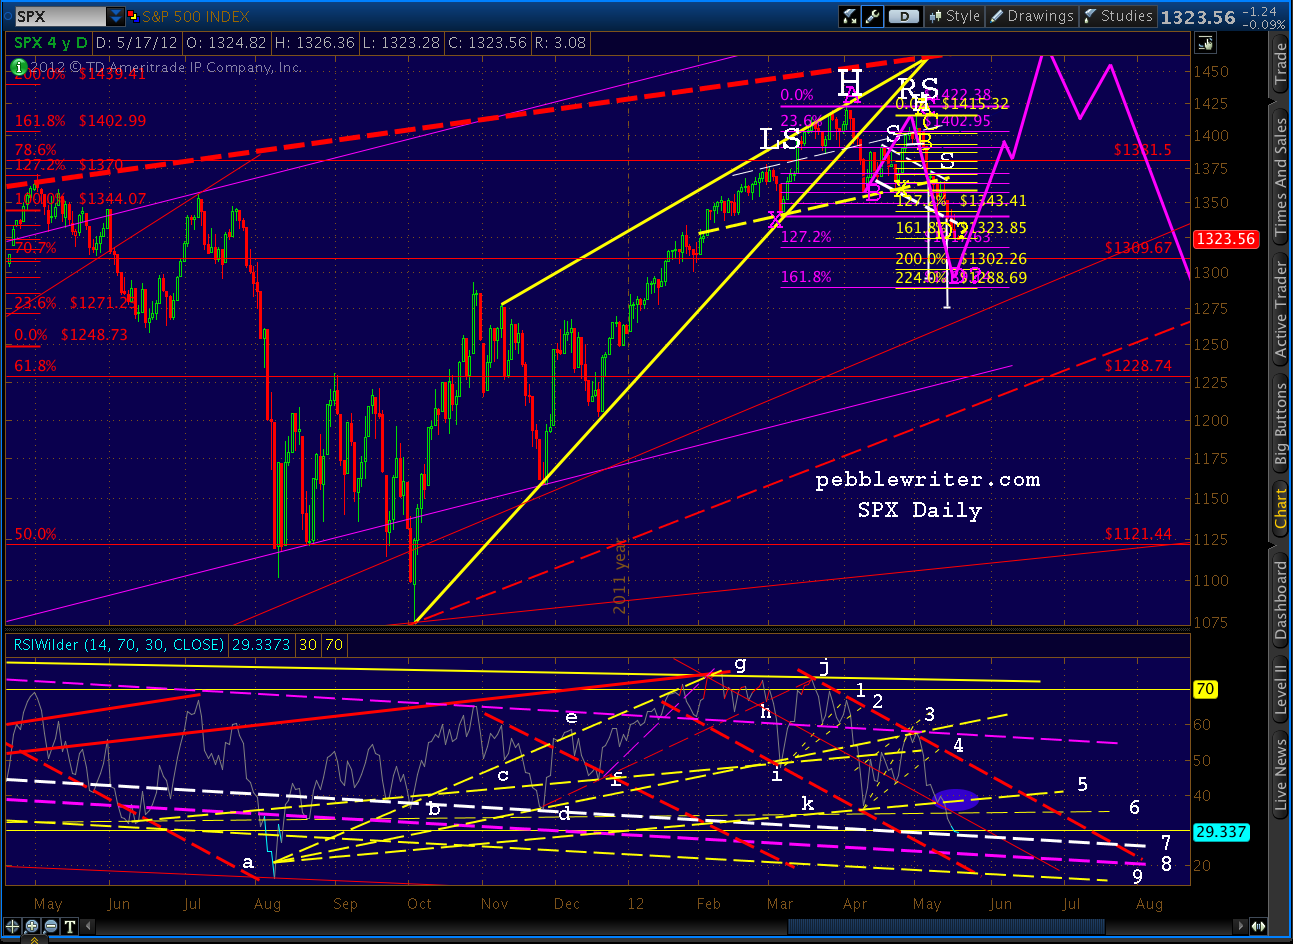
have earned over 17% in the past 33 days (4.6% from 1422 down to 1357,
4.2% back up to 1415, 8.7% down to 1292) versus -9.4% if you just held
on for dear life. Yes, really.
Now, a 26.4% outperformance ain't too shabby. Of course, leveraged ETF, futures and options traders did
much
better -- as did those who shorted JPM or GS when I called their tops
on March 27th. But, please, don't join pebblewriter to earn 17% every
33 days. There's no guarantee it'll happen again.
Do join, on the other hand, because over the course of the next year, you'll become adept at the exact same techniques I used to
forecast this 130-point decline almost to the penny or
forecast the July 2011 crash to the very day.
You can dump your WSJ and turn off CNBC, because you'll be able to
identify and trade on effective fractals, analogs, harmonic and chart
patterns that the main stream financial world doesn't even understand.
If you're a buy-and-hold investor -- that's okay; pebblewriter.com is for
you, too. Who wants to sit around, worrying about the
next 20% plunge? Wouldn't it be nice to see it coming? Wouldn't it be cool to avoid it, or even
profit from it? Exactly.
The new pebblewriter.com is dedicated to helping members learn -- from me
and
from each other. We'll explore new ideas and new concepts in a safe
and supportive environment. No black boxes here -- every forecast I
make explains
why I'm expecting a particular move. And, when I screw up (and, I will) we'll talk about it and try to learn from that too.
Now, what are you waiting for?
Still not sure? Since starting the new pebblewriter.com on March 22,
I've posted the following forecasts. Could your investment portfolio
have benefited from these calls?
March 22 /
Charts I'm Watching
Forecast: RUT, COMP have topped, DJIA will reverse between 13,317-13,338.64
Results: Was the high for RUT & COMP, DJIA topped May 1 at 13,338.66
March 23 /
A Tipping Point
Forecast: SPX should top at either 1419 or 1433 (revised to 1421 on 3/29)
Results: Topped at 1422.38 on 4/2
March 27 /
End of the Line
Forecast:
Called the top on JPM at 46.49
Results: That was the top; closed yesterday at 33.49 (-28%)
March 27 /
Lots More Where That Came From
Forecast: Called top on Goldman Sachs at 128.72, Morgan Stanley at 21.19
Results: Was top for each. GS down to 95 (-26%), MS down to 13.35 (-37%)
March 27 /
What Do Bankers Dream Of?
Forecast:
Wells Fargo won't break
35
Results: WFC topped at 34.59 on 4/2; closed today at 30.94 (-11%)
April 1 /
The Wipeout Ratio
Forecast:
predicted losses from derivatives would be the "story of the year"
Results: May 10, JPM Chase announces billions in derivative
losses...so far
April 9 /
New Analog I'm Watching
Forecast:
S&P will top at 1405 (rev'd to 1415), then decline to 1288-1317 by
May 16
Results: rose to 1415, then declined to 1292 on May 18
April 10 /
Bottom Fishing
Forecast: should reverse at 1364 or 1357
Results: bottomed at 1357
April 24 /
Update on EUR/USD
Forecast:
with prices at 1.3217, called for drop to 1.2721 by May 15
Results: low for day on May 15 was 1.2721
April 25 /
The Bulls Fight Back
Forecast:
head & shoulders pattern will complete by May 2
Results: pattern completed on May 1
April 26 /
On the Verge
Forecast:
Refined S&P top target to 1414-1415
Results: topped at 1415.32 on May 1
April 27 /
VIX Ready to Rumble
Forecast:
VIX bottoming at
15.83
Results: that was the low, closed 5/18 at 25.10 (+59%)
April 30 /
Bet Your Bottom Dollar
Forecast:
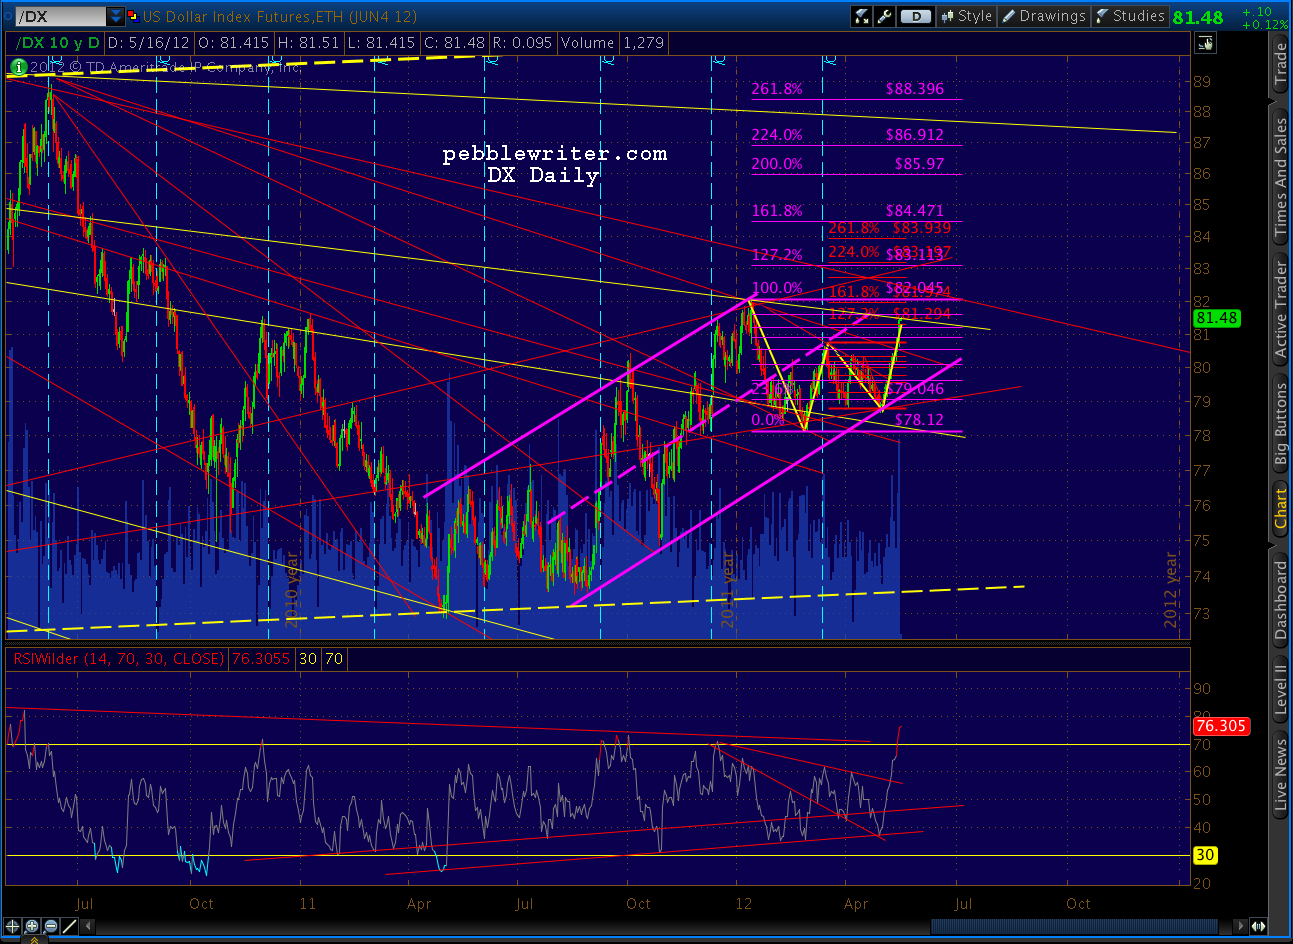
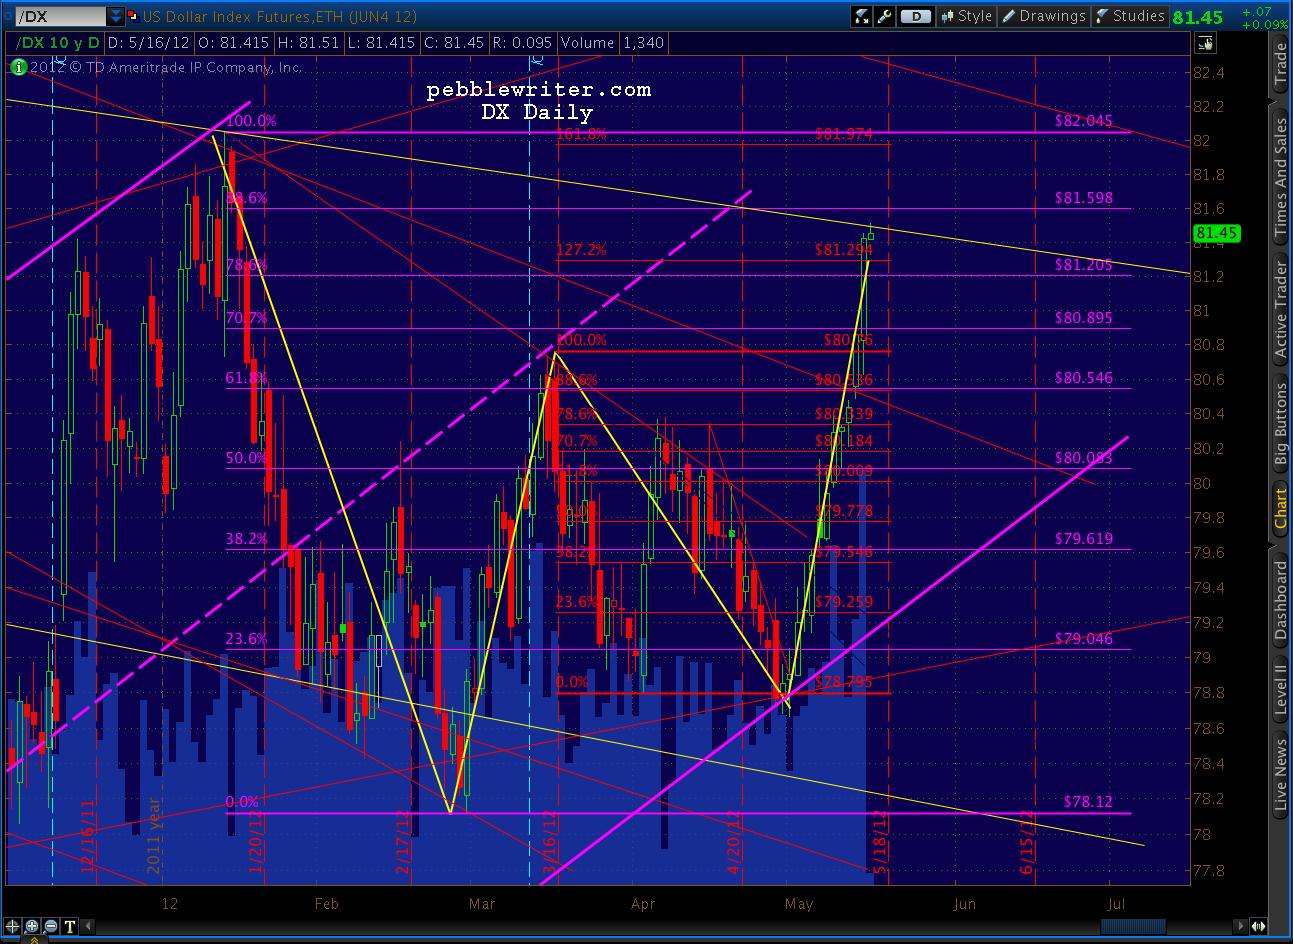
Dollar at 78.685, will hit 81.59 on May 16
Results: Closed at 81.585 on May 16
May 1 /
New Charts!
Forecast: called lower top in SPX, DJI, COMP, NYA, NDX and EURUSD; DX bottom
Results: it was!
May 6 /
So Far, So Good
Forecast:
revised S&P downside target to
1295
Results:
closed May 18 at 1295
May 16 /
Somewhere Out There, Fibonacci's Having a Good Laugh
Forecast:
stressed importance of 1292 -- should be bottom
Results: low on May 18 = 1291.98, closed at
1295.22
Not a bad first couple of months, if I say so myself. Now, are you ready?
If you're one of the 1,000 -- 2,000 people who read pebblewriter for free every day, I have good news and bad news. The
good news is that I extended the
introductory pricing
through the weekend. Those of you with quarterly or semi-annual
membership can upgrade to an annual membership to lock in savings before
prices go up on Monday, and I'll even refund the amount paid for the initial subscription.
The bad news
is that starting this weekend, all posts related to the current markets
(what's going to happen now that we've fulfilled my forecast) will be
available to members only. Tomorrow's post that discusses whether the
analog is still in play (and why) will be password protected. When the
markets start moving again, will you be ready or will you be kicking
yourself for not joining at the cheaper rate?
I
know, it's the ugly side of capitalism. But, a lot of effort goes
into explaining stuff, versus trading my own account. It takes away
from other personal and business interests, and it eats into my own
investment returns. I spend quite a few hours every day racking my
brain to help my readers make more money. A little quid pro quo is fair, right?
Check out recent comments from readers:
You
and your analog/bat/crab/butterfly tools are dazzling me! Thank you
for all you are doing to help me learn to use these beautiful new tools!
Wow, great call! We closed right at 1295!
You
are one of the few that have it right per my friend. Your TA has been
extremely close to the market trends, and only a few other sites can
claim this.
I
have been quietly following your blog for some time. I have my own
technical system for trading in place, but I do appreciate what your
eyes and experience is telling you, I greatly respect your charting, and
I think your charts are absolutely worth paying money to view.
...a HUGE thank-you for your diligence and inspiration. It is a luxury to have your charts and comments.
I
have really enjoyed your site since finding it in June. You were
actually the only one on XXXX's site I noticed calling for higher and
doing it in a nice and professional manner..... Thus, I checked it out
and played on the sidelines - thank you again.... Since then, I feel
like I have learned a lot, but have really enjoyed your wit and writing
style too.....I am not a very good trader, but I am trying to learn and
would love to learn more/ become better.....
That's
my goal, folks. I want each and every one of you to be confident
enough to dump me this time next year. But don't. I have feelings, too.


