EOD:
Charts to chew on...
UPDATE: 2:55 PM
Here's an updated chart with the Fib's clearly marked. This could count as a sloppy Gartley (which reverses at the .786) or a Bat (reverses at the .886). Either way, we stay within the wedge.
UPDATE: 1:10 PM
We're stalling at 1253 as I expected -- 13 points short of completing an IHS. We could go up to the .786 at 1259 or the .886 at 1263 and still be safely within the wedge. It would also allow for more negative divergence to set up, typically an effective bearish indicator.
Here's a good view of the July and current setups, along with the 2007 version. Both the previous fakeouts trapped a lot of bulls, salivating over a potential 100+ point rally.
Thinking like a market maker...can you imagine a better setup to rake in boatloads of money from hopeful bulls? What's really changed in Europe that would indicate they're finally getting their act together? Another summit, another promise to take things more seriously. Big whoop.
And, with all the attention there, what about our own fiscal predicament? It's not as though we have a clue (or the political will) to address our very deep-seated problems. Washington is no doubt thrilled to have the attention focused elsewhere for a change. But, do you think S&P has forgotten?
Here's the post from July: [Ten Lousy Points].
And, a quick peek at a rising wedge setting up within the descending broadening wedge.
Just a reminder, if we break out to the upside -- which according to Bulkowski happens 55% of the time with descending broadening wedges -- I see the limit as 1307-1313. So, to me, the question isn't whether but when we head south.
UPDATE: 11:15 AM
Here's the Inverse H&S pattern the bulls are counting on. It would complete at 1266, but as we've discussed the past several days, I think SPX will come up short -- trapping many bulls in the next phase of the decline.
Potential Fib stopping points off the recent 1267 high are 1253.46 (.618), 1259.44 (.786) and 1263 (.886) -- all shy of the 1266 that would complete a potential IHS.
Looking at the RSI trend line on the 30-min chart, I think 1253.46 is the most likely area for a top.
If we redraw the channels with that as the daily top, it's a better fit all around. Consider what's going on with the 60-min chart's RSI.
It's a broadening descending wedge -- cousin to the broadening ascending wedge the SPX just broke down from. RSI is bumping up against the top trend line, meaning it has to break through on the upside or a crash down to the much lower bottom TL is just around the corner. I'm expecting the latter to commence momentarily.
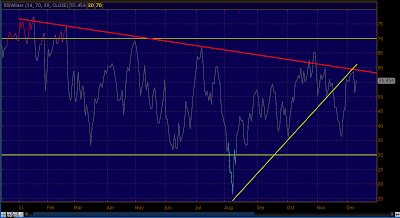
Just a reminder as to where we are on the daily RSI:
ORIGINAL POST:
Look for this little rally to stall at the upper end of the channel we established after breaking down from the megaphone pattern. The channel can be drawn two ways, depending on whether we include the shadow from yesterday morning.
The main takeaway is that we're making lower highs and lower lows. Until that changes, the trend remains down.
More later.


Excellent charts! Keep posting, would you?
ReplyDelete