"It was an expression used by small recon units and sniper teams in hostile terrain in Vietnam. They would tell one another to stay groovy when the danger level was so insanely high they popped amphetamines to stay awake and ready to rock twenty-four/ seven, because anything less would get them all killed. Stay groovy; take your pill. Stay groovy; safety off, finger on. Stay groovy; welcome to hell."
The Watchman, Robert Crais
Those who have been following this blog or its predecessor for any length of time know I'm a big fan of analogs. I was asked just yesterday why I thought they worked, and found myself fumbling for an answer.
Like harmonics, I know that they do, because they've enabled us to make some nice calls that were accurate as to price and time such as the big downturn in April and the subsequent 1474 top in September.
The big Kahuna, of course, was the July/August plunge in 2011 that mirrored that of Dec 07-Jan 08. It's just plain scary how well that turned out.
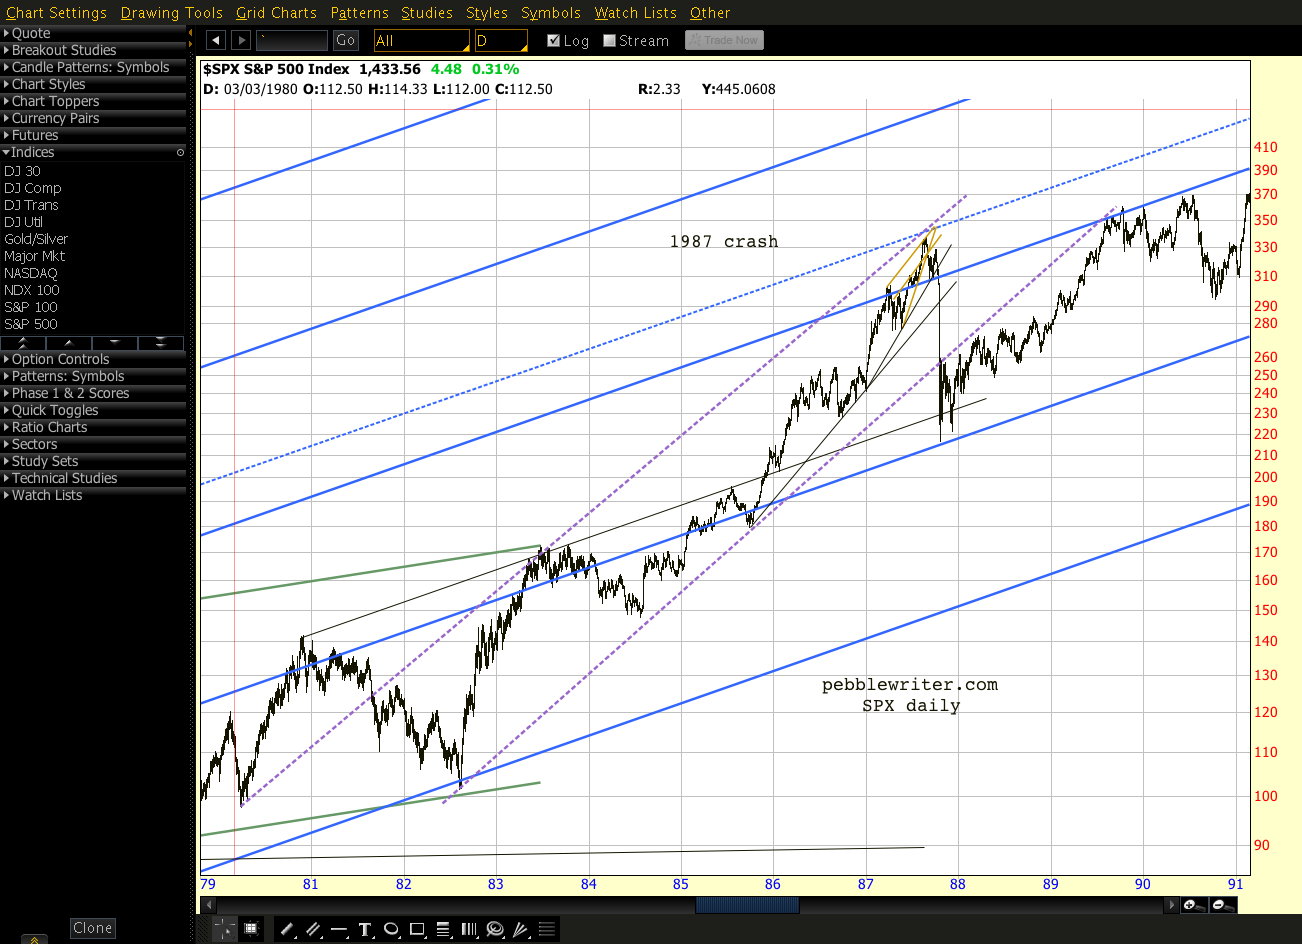
I think analogs work mostly because of channels and harmonics. In the simplest terms, channels keep prices pointed in a general direction for a noticeable period of time. They can last for decades...
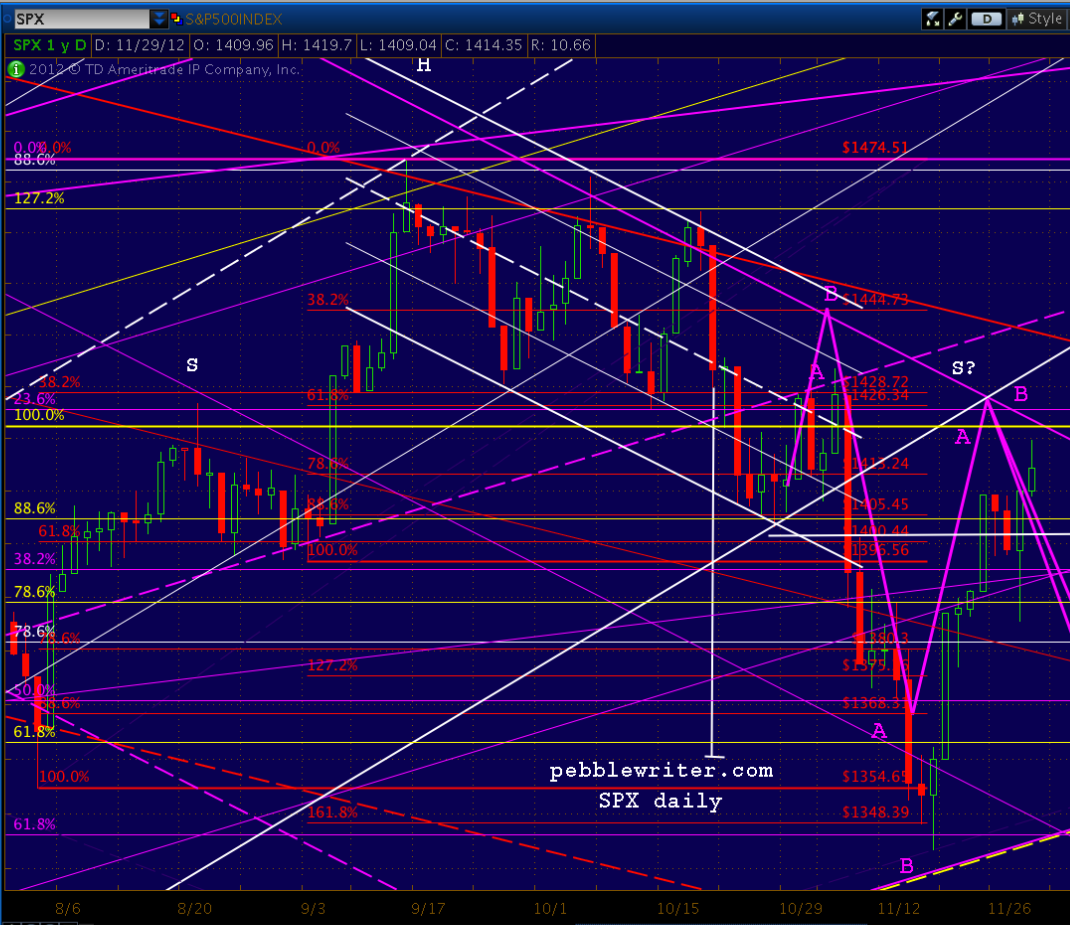
...or a few days.
Regardless, I've found that most significant moves occur within or interact with channels. Very often, as in the above chart, they're channels within channels. Even big channels that seem to generate their own atmosphere are usually aligned with other big channels.
So, it's not terribly surprising when moves that bring the market to the brink of disaster or reach ridiculously overbought levels engender reactions of "Hey! Just like last time!"
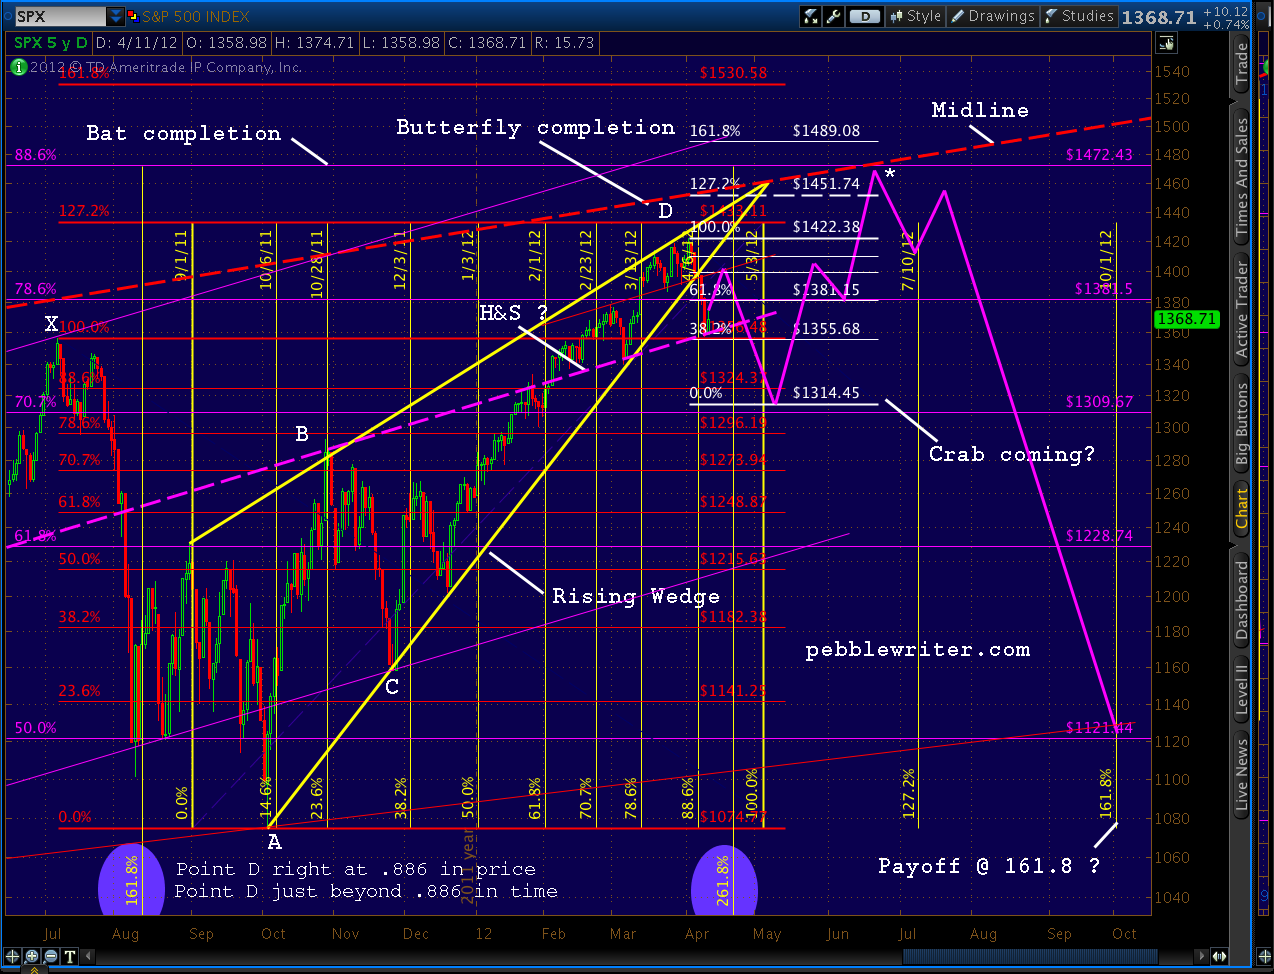
Harmonics, likewise, are usually related. The easiest example is the 2007-2009 plunge from 1576 to 666 which, when followed by a reversal at its .618 Fib level, signaled both a Gartley Pattern reversal at its .786 retracement (the May 2011 high) and a Bat Pattern reversal at its .886 (Sep 2012 1474 high.)
Combining the two, and tossing in some other chart patterns and traditional technical analysis, it's easy to see why the market has done what it has most of the time. If markets move in somewhat predictable and repeatable ways, then analogs can be viewed as a predictable aggregation of those predictable moves.
Of course, its not always as simple as that sounds. Even great analogs usually present alternatives. Over the past couple of months, the one we're following now has hit our primary target at times and our secondary targets other times.
And, some can be tough to get a handle on. The one from this past April [see: New Analog I'm Watching] that very capably guided us from 1422 to 1266 and back up to 1474 (the top chart above) worked beautifully from a price standpoint, but was way off in terms of timing (since licked, I think.)
And, last, there's a truism that's the bane of every analyst who charts analogs:
Even as we're counting down the last few points to the 10% downturn we charted all those months ago, a well-timed Bernanke comment or Hilsenrath article (is there really a difference?) could nudge the markets just enough to complete a Zweig Breadth Thrust event that ushers in a new high.Every analog works forever...until it doesn't.
If that happens, never mind. End of the road. It's been a nice ride for the past nine months, but it's time to change partners. If it doesn't, however, and we reverse in the next 10-15 points, it's just about time for the song.


No comments:
New comments are not allowed.