UPDATE: 3:45 PM
The financials have been a huge part of today's rise. But, a quick look at the daily XLF chart shows a bumpy road ahead.

Note the proximity of the upper trend line of the descending broadening wedge. The last two times that TL have been tested, a severe sell-off ensued. Note, also, the bearish Gartley pattern that's formed since late October. The .786 reversal is at 13.65 -- a mere .18 above today's high.
But, the most damning evidence of all is the RSI trend line. XLF's rallies have all come from a break of the downward sloping trend lines over the past two years. Each of them eventually peters out when the RSI rises to the trend line from the Apr 2010 high (dashed, yellow.) It's obvious that the current rally has virtually no room to run.
In other words, this rally should be very short-lived. I wouldn't be surprised to see a shooting star candle on the day, followed by a test of the trend line connecting the recent lows. If it's broken, watch for XLF to trade sharply lower towards single digits.
UPDATE: 1:15 PM
This morning's rise has convinced me to revisit the channel lines guiding this corrective Minor wave 2. The chart below shows the original in red, along with the revised lines in yellow. The dashed line is the channel midline -- the point at which the SPX has currently come to rest.

I think these channel lines do a better job of capturing the highs and lows in Wave 2, even though they result in a midline overshoot in the first few days of December. A good test for validity of channel lines is how well parallel lines worked in the past. In short -- very well.

Here's a close-up of the new channel. Note the 3-way intersection of the midline with both rising and falling background channels. It won't matter to Wave 2 anymore, but trend lines of the same slope will play a role in defining the Minor 3 bumps.

And, the longer term view of the revised corrective channels:

The fan lines from 2007 and 2009 (shown in log scale) do a very good job of depicting the two potential tops of Wave 2. The red one indicates that a 1307-1330 top is a possibility, while the yellow one argues that the top is already in. Some of you might remember the yellow line from previous posts, sometimes called the "fan line that just won't quit."
UPDATE: 9:35 AM
So, the 1.618 it is. And, there's the negative divergence on the 60-min chart, right on schedule. And, the dollar is way oversold. The big question is whether we'll reverse at 1282.18 or push higher.

Any way you slice it, that makes for a pretty obvious 5 waves up from 1202.
UPDATE: 9:15 AM
We got slightly more of a move than I expected from the EURUSD, with a rise to the .886 (instead of the .786) and a perfect back test of the last fan line to have been broken.

Consequently, the eminis have reached the 1.618 extension rather than the 1.272 which is much more typical of Butterfly patterns.

A similar move in SPX after the open would result in 1282 (the 1.618 extension) rather than 1275 (the 1.272). It would also almost certainly produce some striking negative divergence across the board. Can we still gap and crap before 1292 is endangered? ISM manufacturing data will be released at 10AM.
ORIGINAL POST: JAN 3, 2012 1:30 AM
[note: this post was originally appended to the last Fractal Update post -- which was getting a little unwieldy. I've left it both places so as not to confuse folks even further.]Looks like SPX left us with a Butterfly setup last Friday. If it plays out, it would reverse around 1275.01 -- which is dangerously close to a key Elliott Wave price level (we also have a well-established downward sloping channel line there.)

Note that the Nov 8 high was 1277.55. Depending on how one counts the move off the 1292 top, 1275 is too close for comfort to that previous high. It's also just a few cents off the .886 retracement of the 1292 to 1158 move.

Here's how the EW count appeared to me last week. I wrote that we were about to commence Minuette (iii) of Minute [iii] of Minor 3 of Intermediate 1 of Primary 3.

If we break 1277 (but not 1292) it means the move from 1292 to 1158 was Minute [i] of Minor 3 , with the three wave retracement to 1277+ being Minute [ii]. This actually makes more sense, as Minute [i] in Minor 1 was 112 points. It's likely that the same degree move in Minor 3 would be as large or larger.

If we exceed 1292, then we're likely tracing out the final 5 waves of C of Minor 2 which, as readers will recall, takes prices up to the 1307-1320 area. Whichever way it breaks, we're either in Minor 3 (my top preference) or about to enter it. It should be significantly uglier than Minor 1, which took the S&P 500 down nearly 300 points (22%) in five months. A 22% decline from Friday's close would take SPX down to my short-term target of 983.
European stocks had a big up day, today, with the DAX up 3% and the CAC up 2%, both on light volume. The DAX was boosted by a marginally better PMI reading which still indicates contraction rather than growth -- particularly in the area of new orders.
The following are notes on the Euro from The Big Picture, posted earlier today:
Last, just a quick observation on the Euro. Note how the fast lane we talked about last week is marked by a series of decisive breaks of parallel trend lines. A reminder, this channel is exactly the same slope as the past three two, so I'm inclined to give it the benefit of the doubt.

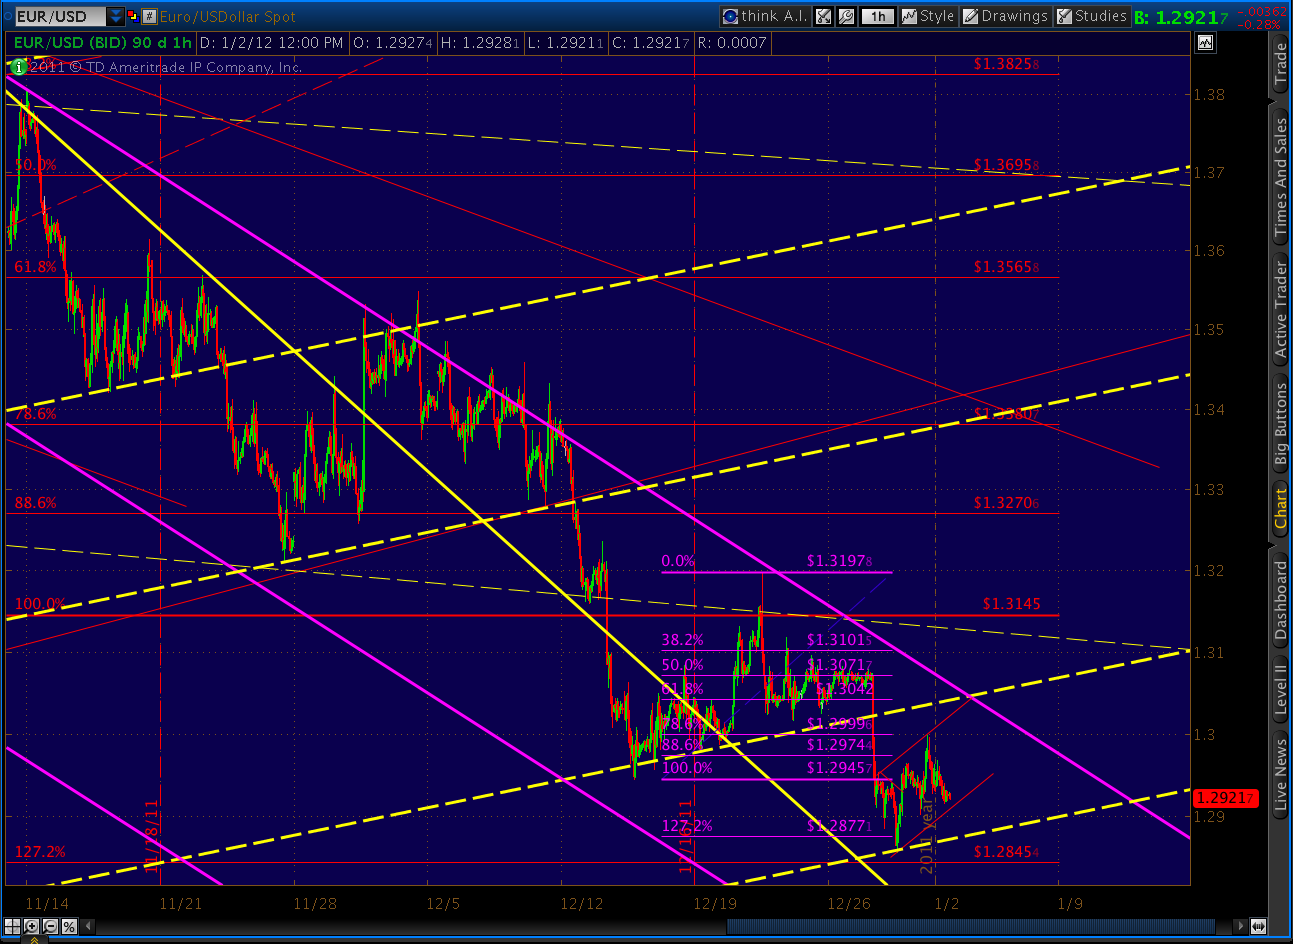
These are worth watching, as lately they are highly correlated with breaks in the US equity markets. EURUSD seems to have established a new on on the 29th at 1.2857. It has since rebounded somewhat, and could be tracing out a Gartley whose .786 Fib is at 1.3032 -- right up against the channel boundary.

Whether it rebounds higher or not, a break of the dashed trend line is a great indicator of a bigger downdraft to come. In the end, I expect EURUSD to fall faster than its sub-channel, crossing into the next one down at an accelerated rate as occurred in the last wave down in September.

The ideal spot would be tomorrow, Jan 3, as that's the peak of channel as it intersects with the trend line just broken. A full back test to the above-mentioned .786 Fib would be the perfect fit for a robust reversal.

I'm still expecting completion of the Crab pattern (in purple) at 1.2464 sometime around mid-January -- a 3.5%+ move that would correlate with a 10%+ move in SPX.

A couple of interesting news/opinion blurbs in the past few hours:

The IMF, stating that the 50% haircut that was supposed to alleviate the Greek debt crisis is likely not sufficient. This, combined with the Spain not-so-near miss of its economic target on Friday should give Europtimists pause. According to Lagarde, the IMF will likely lower its global GDP outlook. As the article points out: "growth is a key factor in determining whether a country can escape from a heavy debt burden." Yes, and in an obvious corollary: "growth is practically impossible when a country is overburdened with debt."


More later.
Re-posted from the previous post...
ReplyDeleteAlbertarocks said...
Thanks for sharing your insights Pebble. I love the way you think man, lol.
Your second chart from the top, the daily chart of the S&P looks eerily like this chart of the DAX. It's the chart from an article I had posted. And sure as hell, no sooner had I made a case for the bearish breakdown, the damned DAX scoots higher by 3 full percent on a day when the US markets are closed. I'll bet volume on the German exchange was damned near zero today.
In any case, I'd say that at least for the DAX, it's back to the drawing board because that sucker now looks like it wants to explode higher. Frustrating business this is. I'm sticking to my guns though. Every damned analysis I've done lately is pointing to the same outcome... a mighty deflationary collapse is more likely to happen than not. Of course none of my analyses are confirmed yet, but they're sure pointing in that direction.
In case you might be interested, I published a new article on the DAX this morning showing how it would appear if it were priced in terms of the DJ Europe Financial Index. Very revealing insofar as that it shows that either the European banks had better start recovering or the DAX is likely to just hit the skids. We just can't have a soaring equity market while banks are collapsing in price. It just doesn't compute.
And then at midnight eastern, I'll be publishing another one. I'm leaving it until then so that GEI can publish it at the same time. I owe that to them. It's a revisit to the CRX story which for one reason or other was a huge hit on that website. I'm not sure why, but the people who frequent that site hit my articles over there like there's no tomorrow. But so far, they've never been told that I've started up my little blog because the last time anything of mine was published on GEI, my blog hadn't even been conceived of yet. So that'll be interesting... to see if any of those people wander over to my blog for a look.
You're still one of my favorite people out there Pebble. Love your stuff and your way of writing. Thanks for all you offer to us.
Hoping 2012 is the best year of all time for you. Continued success :-)
January 2, 2012 6:50 PM
pebblewriter said...
Thanks for the input and the well wishes, AR. Same to you and yours.
As usual, your logic is impeccable -- stocks can't soar with banks failing left and right. I see a decent argument for a gap up to 1267 or so in the morning, based on a potential Bat pattern on SPX and Gartley on EURUSD (reversing @ 1.303.) From there, gap and crap?
TOS doesn't quote/chart DAX, so it's a little hard for me to tell with any precision, but it appears that there have been several instances where DAX lagged SPX on the downside. Two apparent cases are late July and late September sharp SPX reversals that ushered in the 3rd and 5th waves down respectively.
Seems like the percentage move in SPX has been about 1.25X the EUR lately, so I'm going to look for a move to 1.303/1267 move in the morning before the party gets going for the shorts (not to be confused with a party in one's shorts.)
Please drop in frequently, and let me know when there's something especially important to read over at ARTAD. I sometimes don't catch up on my reading till the EOD and would hate to miss something time sensitive. I'll try to do the same.
Cheers
S&P = 1280
ReplyDeletePW = wrong
Probably just a little early, as regular readers have come to expect. But, with Minor 3 in the works, I'd rather be early than late -- wouldn't you?
ReplyDeleteBTW, I do update my forecasts when/if able as circumstances dictate. That's why I posted yesterday about the Gartley in the Euro. Even though it featured a Point B in excess of the .618, it broke the rules and extended to a Bat, reversing at the .886 instead of the .786.
The extra .003 was enough to extend the SPX Butterfly to its 1.618 instead of 1.272 extension -- a situation I posted about 15 minutes before this morning's opening.
There are no guarantees in this business. And, I've yet to find a system that is perfect. But, mine is pretty darn good. I leave all past posts up for anyone to read -- including the ones in which I'm wrong.
I've been saying we could go as high as 1307-1313 since October 25 (see link below). In that post, I forecast a reversal at 1257, bottoming at 1170 and returning to 1280 or 1307. Instead, we reversed at 1292, bottomed at 1158 and returned to 1284 (so far.)
I still don't consider 1307 as likely. I believe that 1292 will hold as the Minor 2 high and that we'll be much, much lower by the end of January. The next few days should be telling.
http://pebblewriter.blogspot.com/2011/10/charts-im-watching-october-25-2011.html
Well, from my calculations, I see DOW 34,000. I will be sustaining myself on dirt sandwiches and sewer water dribbling from Bennie B's tail pipe.
ReplyDeleteI'm pretty sure if the DJIA reaches 34,000 in the next 10 years, it'll be because the dollar is worth less than the ink it takes to print it.
ReplyDeleteThat prediction is for the end of the week. It's God's way of punishing my shorts.
ReplyDeletePebble: happy new year, and thanks for your sharing. I'm new to the blog, while ignorant of frcatal techniques, very fscinated by your work. I want to learn and understand the technigue. Coul you direct me to a site, a book/article, any thing that would get me started. Thanks!
ReplyDeleteAs always I admire your work, PW. I imagine you may be starting to feel a bit like Captain Ahab, only hunting for Black Swans instead of whales. Regardless, we know they are out there just waiting to capsize this ship of a market.
ReplyDeleteStill holding Jan puts?
ReplyDeleteSorry to be just now getting to these comments... last night was chock full of dad duties and I wanted to review the big picture before answering.
ReplyDeleteFarhad: I'm considering putting together a section on the site that would explain and illustrate fractals, harmonics, etc if that would be of interest to folks. Let me know.
Distopian: yes, it gets a little lonely at times focusing on turning points rather than the slow steady (but, always upward!) grind that most of Wall Street services. All I can do is keep refining my techniques in the hopes of minimizing the false alarms and near misses. I've been early on many of my calls, and I'd like to improve on that.
ckorey: got stopped out of some, holding the rest just in case. If we dip to 1264 in the next day or so, I'll probably take some profits and consider some short term call positions if it appears that we're reversing back up to 1307ish. But, that's subject to change of course.
"chock full of dad duties"
ReplyDeleteI loved those days and miss them very, very badly. My kids are all grown up, both very successful with awesome careeds, but too busy to see dad much. The old Cat's in the Cradle syndrome on steroids.
"I'm considering putting together a section on the site that would explain and illustrate fractals, harmonics, etc if that would be of interest to folks. Let me know."
I know I'm one person who would certainly benefit from that Pebble. I don't actually even know what a crab or a butterfly is. All I know about that is that I like to eat crabmeat and I stopped eating butterflies about 4 years ago.
"I've been early on many of my calls, and I'd like to improve on that."
That is absolutely my problem as well. In order to try to alleviate that, to try to remove the noise and remove the effects of overnight gaps one way or the other, I've gone back to the very basic of all basics... moving averages. I've been working on ways to use the signals from those with as much efficiency as I can. I still haven't perfected it (and probably never will "perfect" it) but man does it ever help.
Keep up the great work partner. There are many who appreciate it. I are one.