First, an overview of the harmonic picture, starting with the biggest picture:

On the monthly chart, we just completed a potential right shoulder to a very large Head & Shoulder pattern that started with the 2000/1 top (the left shoulder). Consider how the pattern aligns with the largest harmonic pattern (in purple, I'll call it a Butterfly for now.)
The neckline, which tagged the .786 retrace in Mar 09 at 666, passes through the .886 at 565 in late 2016. By drawing a parallel trend line across the shoulders, we can also construct a midline -- currently around 1031.
I find this level interesting, because it's reasonably close to the .500 Fibonacci level (1006) of the Butterfly pattern as well as the .500 Fib (1018) of a somewhat smaller Bat or Crab (in red) that began at the 666 level. Also, note that reaching the 1006-1018 price level will complete a smaller H&S pattern that features 1370 as the head and targets 773. As we'll see below, the smaller H&S target is a stone's throw from a Bat pattern target of 747.
The channel that's formed by this H&S pattern is aesthetically pleasing, but obviously portends a dismal economic picture -- a double-dip recession (for optimists) or potential depression. Without getting into a protracted discourse on economics, this is consistent with my outlook on the economics picture.
Closer in, the picture is equally bearish. Nestled within the large Bat or Crab pattern that's been forming since 666 is a Crab pattern (in red) that began in August 2010. It put in a Point B at the 1074 low in October, and would complete its 1.618 extension at 835 -- just above the H&S target of 773.

Please note I've made no effort to put these targets in proper time perspective, but am just showing price targets for now.
Closing in a bit more, a couple of Gartley patterns are forming. The larger purple pattern is the better formed of the two, as the yellow pattern Point C exceeded Point A by 2 points. This is not technically permissible, though I chart it anyway because these patterns often defy the odds and work out.

I've also charted some Bat and Crab alternatives. The key is Point B, which for a Bat must be less than a .618 retracement and for a Crab can be anywhere up to the .886 Fib level. Note that the yellow Crab completion at 1091 also completes the H&S pattern that targets 735, so this is a very significant target. It also coincides with the larger (purple) pattern's .886 Fib level at 1099.
Put all these targets together, and you get a boatload of significant price targets:
1181
1121
1099
1091
1091
940
835
73
565
By themselves, not a lot of help. But, with these in hand, we can construct a model that attempts to align significant price levels with significant time levels by using channels and the analog I've been tracking since May and the fractal since November. More later on that.
********
Last, just a quick observation on the Euro. Note how the fast lane we talked about last week is marked by a series of decisive breaks of parallel trend lines. A reminder, this channel is exactly the same slope as the past three two, so I'm inclined to give it the benefit of the doubt.

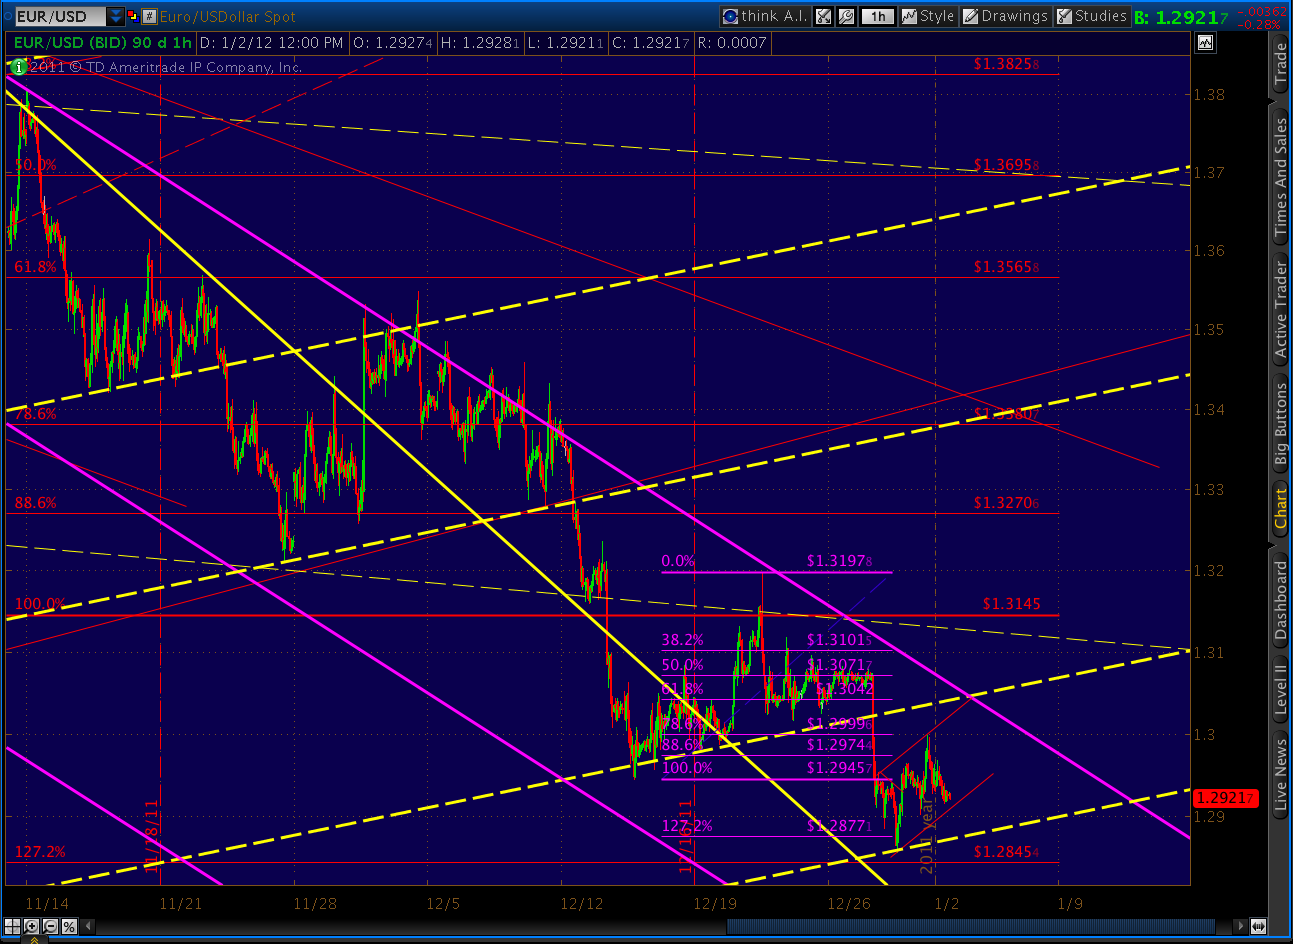
These are worth watching, as lately they are highly correlated with breaks in the US equity markets. EURUSD seems to have established a new on on the 29th at 1.2857. It has since rebounded somewhat, and could be tracing out a Gartley whose .786 Fib is at 1.3032 -- right up against the channel boundary.

Whether it rebounds higher or not, a break of the dashed trend line is a great indicator of a bigger downdraft to come. In the end, I expect EURUSD to fall faster than its sub-channel, crossing into the next one down at an accelerated rate as occurred in the last wave down in September.

The ideal spot would be tomorrow, Jan 3, as that's the peak of channel as it intersects with the trend line just broken. A full back test to the above-mentioned .786 Fib would be the perfect fit for a robust reversal.

I'm still expecting completion of the Crab pattern (in purple) at 1.2464 sometime around mid-January -- a 3.5%+ move that would correlate with a 10%+ move in SPX.

Thanks for sharing your insights Pebble. I love the way you think man, lol.
ReplyDeleteYour second chart from the top, the daily chart of the S&P looks eerily like this chart of the DAX. It's the chart from an article I had posted. And sure as hell, no sooner had I made a case for the bearish breakdown, the damned DAX scoots higher by 3 full percent on a day when the US markets are closed. I'll bet volume on the German exchange was damned near zero today.
In any case, I'd say that at least for the DAX, it's back to the drawing board because that sucker now looks like it wants to explode higher. Frustrating business this is. I'm sticking to my guns though. Every damned analysis I've done lately is pointing to the same outcome... a mighty deflationary collapse is more likely to happen than not. Of course none of my analyses are confirmed yet, but they're sure pointing in that direction.
In case you might be interested, I published a new article on the DAX this morning showing how it would appear if it were priced in terms of the DJ Europe Financial Index. Very revealing insofar as that it shows that either the European banks had better start recovering or the DAX is likely to just hit the skids. We just can't have a soaring equity market while banks are collapsing in price. It just doesn't compute.
And then at midnight eastern, I'll be publishing another one. I'm leaving it until then so that GEI can publish it at the same time. I owe that to them. It's a revisit to the CRX story which for one reason or other was a huge hit on that website. I'm not sure why, but the people who frequent that site hit my articles over there like there's no tomorrow. But so far, they've never been told that I've started up my little blog because the last time anything of mine was published on GEI, my blog hadn't even been conceived of yet. So that'll be interesting... to see if any of those people wander over to my blog for a look.
You're still one of my favorite people out there Pebble. Love your stuff and your way of writing. Thanks for all you offer to us.
Hoping 2012 is the best year of all time for you. Continued success :-)
Thanks for the input and the well wishes, AR. Same to you and yours.
ReplyDeleteAs usual, your logic is impeccable -- stocks can't soar with banks failing left and right. I see a decent argument for a gap up to 1267 or so in the morning, based on a potential Bat pattern on SPX and Gartley on EURUSD (reversing @ 1.303.) From there, gap and crap?
TOS doesn't quote/chart DAX, so it's a little hard for me to tell with any precision, but it appears that there have been several instances where DAX lagged SPX on the downside. Two apparent cases are late July and late September sharp SPX reversals that ushered in the 3rd and 5th waves down respectively.
Seems like the percentage move in SPX has been about 1.25X the EUR lately, so I'm going to look for a move to 1.303/1267 move in the morning before the party gets going for the shorts (not to be confused with a party in one's shorts.)
Please drop in frequently, and let me know when there's something especially important to read over at ARTAD. I sometimes don't catch up on my reading till the EOD and would hate to miss something time sensitive. I'll try to do the same.
Cheers
Yeah, I'm sorry Pebble that I don't leave comments here more often. I've found that with putting together articles (especially during this holiday season when I have more time), trying to get a handle on my own blog I'm so damned short of time. If I were getting paid well for doing what I do I'd be a bit happier about it. I guess I just do it because I'm obsessed with it... obsessed with beating the arsehole bankers at their own game. Obsessed with TA... I just love it. The biggest challenge I've ever faced in my life. I guess it's the Irish in me... not willing to take a beating without throwing a few of my own.
ReplyDeleteBut please don't ever think I don't love ya man. You seem like such an ally to me.
"...let me know when there's something especially important to read over at ARTAD". Most of the time I think there's 'nothing' over there worth reading, lol. But as I mentioned, there are two studies that I published yesterday, both completely different, and both leading to the same warnings, deflation is more likely to happen than not. And then the DAX proceeds to pop 4.55% in two days and I feel like an idiot. No reason I should though because a little pop like that doesn't change a picture that is visible on the monthly and weekly charts. Nonetheless, it's a frustrating game sometimes.
On that topic, I 'did' also update the piece on the DAX this morning too, with an updated chart. If you'd care to see that one (and I appreciate that you're busy too) you could see that update here.
Keep up the great work bud.
Cheers
Pebble: happy new year, and thanks for your sharing. I'm new to the blog, while ignorant of frcatal techniques, very fscinated by your work. I want to learn and understand the technigue. Coul you direct me to a site, a book/article, any thing that would get me started. Thanks
ReplyDeleteGeomean, could you elaborate?
ReplyDelete