UPDATE 3:45 PM
More looks at the harmonic picture for SPX:
Note that we're right at the .618 Fib from the big Gartley: 1228. That also happens to be the 1.272 extension for the Butterfly pattern we're within spitting distance of completing. Coincidence?
For the Gartley, the target on the reversal is the .618 of the AD, which in this case is 935. Now, consider that 938 is our measured move target. Hmmm...
UPDATE: 3:30 PM
And, the dollar chart to go with it. I'm thinking the last leg up might be just [i] of 3, instead of 3 itself.
I can't for the life of me figure out what's keeping equities going. All the signs are there for a huge plunge. And, as extended as this thing has become, it should be dramatic. And, it could happen any minute...or a week from Monday.
The timing is difficult, because the bull has overstayed its welcome. I would expect a more rapid move back down, but I've thought that for days, now. I'll work on it more over the weekend.
UPDATE: 3:05 PM
Look what the great and powerful Oz has up his sleeve. I haven't seen very many charts this compelling lately. Fan lines rule!
Note how decisively the fan and channel lines intersect at the key turning points.
I don't think there's much doubt we're about to see a massive downturn any day now.
UPDATE: 11:05 AM
ECRI's numbers just out. Weekly Leading Index annual growth rate very ugly at -9.6% -- worst since Sep 2010. ECRI has already called for a double dip recession that government intervention cannot prevent. The full report will be out shortly.
UPDATE: 10:45 AM
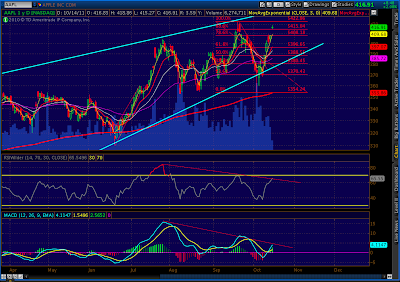
I'm also watching AAPL, which just completed a Bat pattern with its gap up and is working on one of several bearish candle patterns. Check AAPL's RSI, too.
ORIGINAL POST:
Look for this run up to crap out at the same fan line that stopped the Aug 31 and Sep 1 moves -- currently around 1220.
The last time we had a pattern set up like this was Sep 16, 19 & 20th, when we formed a double top with the same huge negative divergence and same three candles. If this gap craps, we could see a similar reversal to the 1.618 on the downside -- in this case 984.
Spud put a question to me yesterday regarding the proper wave count. There are so many different theories that have been proposed by people much more experienced than I -- It's times like these that make me want to ignore EW all together! Seriously, I've lost more money trading some expert's count than any other single source of information (e.g. EWI's silver forecast?)
Having said that, I think EW can be extremely helpful in raising questions about possible next moves, and is certainly helpful in trying to ascertain where in a larger pattern we might be. It's just that right here, right now, I can point to five competing counts -- all perfectly logical -- that could be right. The only sure thing is that 80% of them are wrong!
So, I'll throw my count into the ring: an expanding ending diagonal. It's rare, but it seems to fit with what's going on. Guess we'll find out soon.


And I thought I was the only one who got suckered in by EW's silver short call.
ReplyDeleteOh, no. I bought some SLV option dealer's kid a new Beemer that year.
ReplyDeleteLOL!!!
ReplyDeleteElliot Wave your money goodbye.
Best I have seen is PUG.
Best Elliott Waver I know of is Daneric.
ReplyDeleteBest of everything else is right here on these pages.
And I am unanimous in that!
Well, that's the question, isn't it? But, I'm not inclined to set aside patterns and relationships that are months in the making because of a 40 point overshoot.
ReplyDeleteConsider the harmonic charts posted above. Would we call the Gartley from Oct 07 "just wrong" because it took longer than expected to complete, and came up 11 points shy of its 1381 target (from 666)?
This is an inexact science, to be sure.
Are you saying that we might get to 1228 to finish the gartley pattern before reversing? It has certainly be a tough week for bears. Quite a few tech analysis are saying that oc 21/24 might be cycle low. What do you think?
ReplyDeletewhat happens with the forecast if we got to 1260 on the ES? This is the target of a bullish wolf wave that ended at the bottom, the 1.618 extension off the bottom, and the 200 DMA? I actually think this is the most likely scenario and am kicking myself for being short.
ReplyDeletemy views for sharing...
ReplyDeletehttp://timecycles-timer.blogspot.com/2011/10/15-oct-thoughts.html
Futures are relentless...............
ReplyDelete