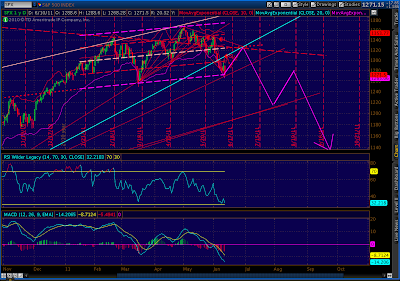
Not content to see that something works without understanding how, I went back to the 2000 and 2007 tops. Made a fascinating discovery. The channels I'd drawn, based on what the charts showed me, actually work out to be the trendlines drawn out 2 standard deviations in a regression channel. Check it out:
 | |||
| 2000 TOP |
TOS draws these things for you, so it's an easy matter to set the lines at -2, -1, 0, 1 and 2 std dev's and let it show you the way. As would be expected, the +/- 2 std dev trendlines (outside, in red) line up with the bollinger bands. The entry point for the channel is when the index hits the mid-line. Its first retracement marks the lower end of the channel, and its subsequent high(s) marks the high end.
Throughout the pattern, the mid-line acts as a pretty good support/resistance line on an intermediate basis. And, of course, the +/- 1 std dev lines capture the bulk of the advances and declines (by definition.)
What's really interesting to me right now, though, is what happens at the end of the pattern. When the index loses its long-term trendline (e.g. falls out of the rising wedge) and all seems lost [watched CNBC today?], the index bounces off the lower end of the channel one last time and makes a return trip to the midpoint of the channel. Happened in both 2000 and 2007.
 |
| 2007 TOP |
Also note that the index, when it seems done with the channel bottom, still comes back for one last touch before heading south for the winter. So, if you're sitting around, wondering where the panic is if this is THE END, now you know why. As b'tugly as things look, this ol' gal has one last dance left in her.
Here's where we are as of late Friday afternoon.
 |
| 2011 TOP |
If the pattern repeats, it gives us a little more precise idea of there the market should turn. It appears to be at 1328-1330, where the central line of the channel crosses the bottom of the rising wedge. I'll spend the weekend looking at other tops just to double check. So far, more than a few pass the eyeball test, but I'd like to make sure.
Have a great weekend, everyone!
Whether you turn out to be right or wrong this time, this is great research. Thanks for posting it.
ReplyDeleteThanks, Spud. I'll try to update with additional periods over the weekend, so check back.
ReplyDeleteNice work. Chris Martenson of Crash Course fame has been blogging about the Coming Market Rout since March or April. I think we are going to get a real lesson as to what happens when you take away the heroin needle of 100B a month POMO QE2 purchases from an economy that's not growing. What do I mean it's not growing. Well you take the GDP growth rate of first quarter, say 2 percent, and subtract out the true inflation rate from shadow government statistics of say 7 percent, and we have negative 5 percent GDP growth (still in a recession/depression). The only things keeping us afloat are gross government overspending (1.6T this year alone) and the Fed Asset purchases. Repubs are trying to get spending cuts done, and Fed is stopping POMO. I think in the next 3 months we could easily be down 20 to 25 percent in the stock market. JMHO but that's the way I see it.
ReplyDeleteWhat do you think about the Puetz crash window
ReplyDeleteI don't know much about Puetz windows. As I understand it, the odds of a crash are enhanced in the period six days before to three days after the first full moon after a solar eclipse, when that full moon is also a lunar eclipse. Apparently, we had a solar eclipse on June 1 and have a full moon that is also a total lunar eclipse on June 15. Is that your take on things? Got any good studies or articles you'd like to share?
ReplyDeleteto sassballsgrandpa: full moon or not, I think we're at the equivalent of Nov 27, 2007 in the cycle. I think we get one more bull run, the strength of which will surprise a lot of people. There will be a lot of optimistic talk that we're still in an uptrending channel (which, technically, we are). But, instead of making new highs, the market will probably be contained between 1328 and 1340 and a vicious downturn will commence.
ReplyDeleteI agree wholeheartedly about the economic picture. There have been many excellent articles on shadowstats.com and elsewhere that make the same points about the inevitability of a worse economy. The only question in my mind is how the Fed will respond. I don't think there's much they can do, but I fully expect them to try -- whether it's called QE3 or not. It might even work temporarily, until the investing public becomes full aware of the scope of the problem and the crash commences. 20-25%? Absolutely.