PEBBLEWRITER.COM IS LIVE!


*************** PEBBLEWRITER.COM IS LIVE! TO SIGN UP, CLICK HERE ***************


Wednesday, October 23, 2013

Mucking About

~reposted from pebblewriter.com~

ES came within .09 of our interim target from Monday [see: CIW Oct 21] and is reversing nicely, though we're a day behind the schedule discussed on the 17th.


The implications are that this sell-off might be a little less deep than I originally thought. Still, as we discussed yesterday, it should be steep enough to flesh out the red channel within a few days.

The dollar reverted to the pale blue .886 before falling back to a higher low, having been rebuffed by the falling wedge's lower bound.  It'll be interesting to see whether the equity plunge is frightening enough to produce a real dollar rally -- or merely slow the bleeding.


SPX's 90-pt plunge in late June (1654 to 1560, in yellow on the chart above) produced a dramatic spike in DX -- which then continued to rally with stocks until they had recovered their losses.  For now, at least, the dip below the critical 78.725 has been averted.

I'm often asked why, if the larger harmonic patterns are so clear, one should muck about with the smaller patterns, channels, etc.  The rally from 1640 to 1754 demonstrates the value quite well.  The 110 points, alone, would have been a 6.7% return -- not shabby for a 12-session holding period. 

Yet, as the chart below shows, there were several reversals that were fairly "by the numbers."  The purple .786 (yellow .618) provided a 20-pt reversal, and the purple .886 another 11 points.


Adding in those extra 62 points alone (the reversals and their retracements) would have boosted the 6.7% return to about 10.5%.  But, more importantly, the harmonics alone don't tell the whole story.

Consider our forecast from July 15, when SPX was about to register a new all-time high.  Based on harmonics, I expected a reversal at 1712 (it came at 1709) and subsequent rally to 1765, followed by a 45-point retracement on the way to 1823 -- all by late August.


A buy-and-hold investor would have done reasonably well with that forecast.  SPX came within 6 points of that 1765 target before reversing yesterday -- a modest 4.6% gain from 1682.  There's nothing wrong with 4.6% for three months (about 18% annualized.)

However, by simply paying attention to the channels, we were able to spot the trend shift in early August that signaled a deeper dip than originally anticipated.  That deviation provided an additional opportunity of 54 points (27 X 2.)  The September dip from 1729 to 1646 provided another 166 points of potential return.


Suddenly, a 77-pt or 4.6% potential return becomes a 297-pt or 17.7% return (about 70% annualized) -- from simply tossing channel analysis into the equation.  By considering many other chart patterns, coincident developments in other securities and currencies, analogs, RSI channels and other, more traditional technical analysis, we've been able to do even better.

Let's be clear on one thing: it is highly unusual for anyone to catch the absolute top and bottom of every major move.  We've done better than most, but I still miss a lot more than I care to admit.  But, that's not important...because, it's not our goal.

Our goal is simply to catch "most of the moves most of the time."  This means developing the very best forecast we can and following it until it stops working.  Sometimes, it works for days or even weeks.  And, sometimes it works for all of five minutes.

The key is acknowledging when it's not working -- which means (1) having a discrete price level or chart pattern that provides a clear signal, and (2) setting aside one's ego and admitting that the forecast was hogwash in the first place (by far the harder of the two!)

continued on pebblewriter.com

Friday, August 2, 2013

Just Like Old Times

Welcome to the old pebblewriter.  If you found your way here, you know that Hostgator -- the outfit who host pebblewriter.com -- is down this morning.  I have no idea when they'll be back up, but I'll post here until they are.  I'm getting status reports here:  https://twitter.com/HGSupport

A reminder, I will wrap up at 2pm today and will be on vacation Monday through Wednesday of next week.  I will post an updated forecast either this evening or tomorrow, assuming the servers are operating again.

*   *   *   *   *

Here's where we are so far this morning...

I shorted on the opening at 1706.10, then went long at 1700.78 with an interim target of 1712 as detailed last week.


I posted several currency charts earlier this morning.  Here are the updated versions:

The dollar, which had poked up above the falling white channel midline in a rising wedge, broke down from the wedge this morning.  While the recent .786 tag could have been a significant bottom for DX, I continue to suspect the .886 at 81.11 is in the cards for Monday Aug 5.


Aug 5 shows up as a potentially significant date in many of my charts, including the USDJPY.  It marks the intersection of two important channels, as well as the recently broken neckline and the pale blue .886 at 100.12.


The EURUSD shows the greatest potential risk, with a recent .886 tag having occurred at the top of a falling channel and rising wedge.


Given all that, it's quite possible the 1712 target won't be reached until Monday -- if then.  There continues to be great downside risk to this rally built on QE and ramp jobs.  I would go to cash for the weekend, but would continue to play the long position unless we reach 1712 or stop out. 

I'd leave stops around 1698, but would close out the long on any significant weakness.  It has backtested the 1.272 and should be positioned for another leg up.  But, it's also running on fumes...

I have to leave you now, but will post later this afternoon or evening.

GLTA.


 *   *   *   *   *


As a young boy, I spent many hours listening to my grandparents' music collection.  One of my favorites was Guy Lombardo and his Royal Canadians.  His music still brings a nostalgic smile to my face...


Tuesday, July 2, 2013

Fireworks Ahead!

NOTE:  Only about half the discounted annual memberships are left.  Many of you have memberships expiring this month.  If you plan on upgrading or extending or haven't completed your order yet, don't forget it's first come-first served. 

The sale will be announced outside the membership tomorrow if any memberships are left at the discounted price.  This will likely be the last sale before the Fund goes live and memberships to the current website will no longer be accepted.  CLICK HERE

Also, I intended to post the May and June performance last night, but ran out of time.  I should get it posted later this afternoon.  Check back HERE.  I have put together a page describing the basic investment philosophy and strategy underlying this site that some might find interesting: HERE


Reposted from pebblewriter.com...

Everything is going according to plan this morning, with all currency pairs approaching their targets from last week.

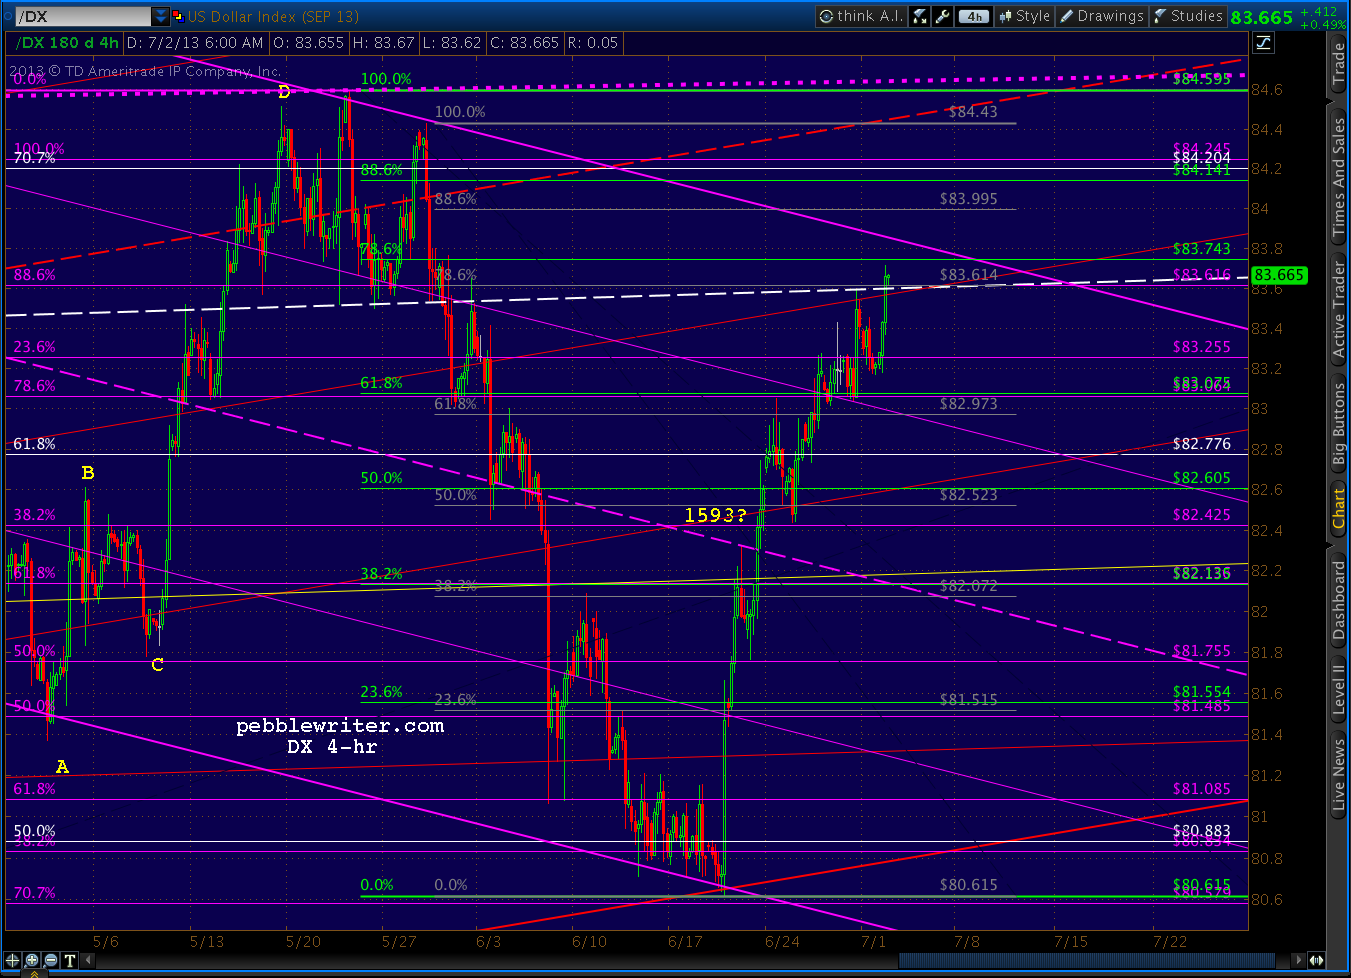
The dollar is back to the white channel midline where exciting things happen.  The last squirt higher led to 84.595 on May 23, the day after SPX topped out at 1687.

This time, however, there's a falling purple channel and the .786 Fib line to consider.


A close up reveals that DX is also pushing up through the red channel .382 line.


While the EURUSD is approaching the .786 retracement of its rally from the 1.2795 low, the red channel midline and the bottom of the light blue channel.


A close up...


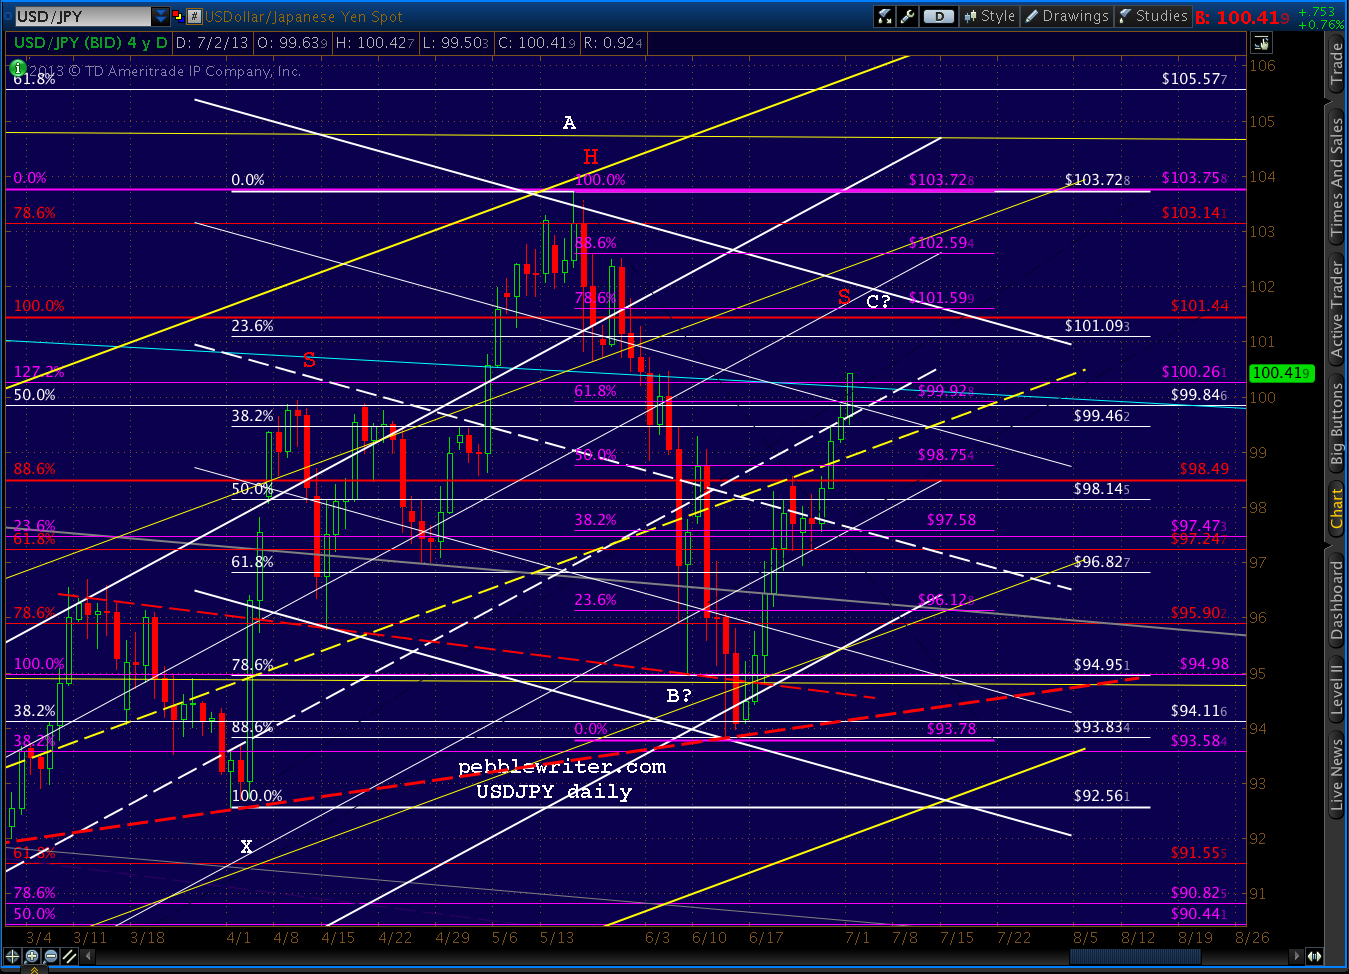
The USDJPY is closing in on our 101.59 target at the .786 Fib.


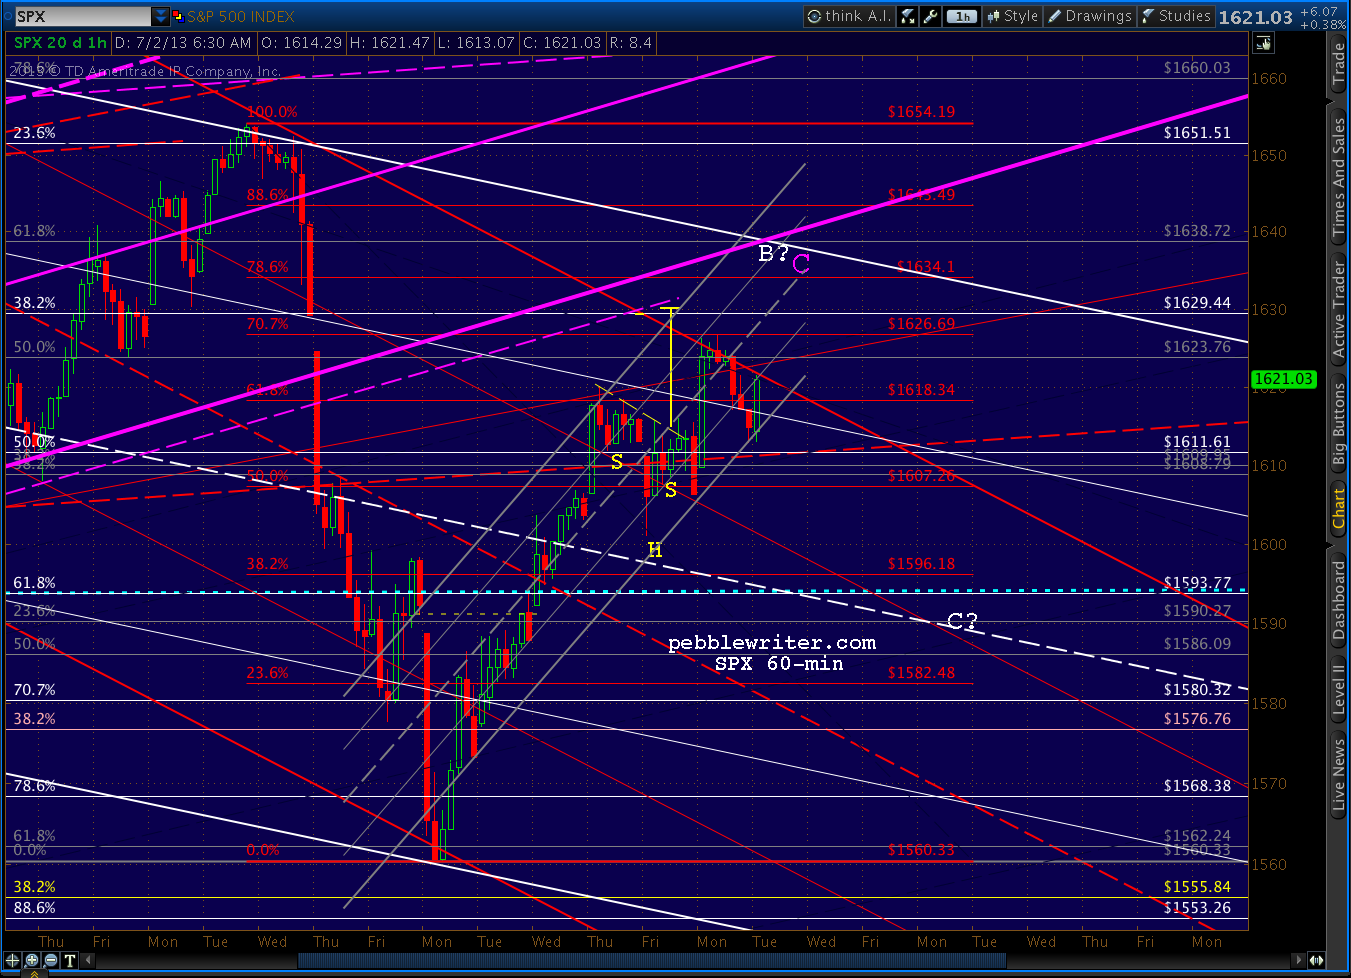
The e-minis, which back-tested the bottom of their purple channel at the white .500 Fib yesterday, took another run overnight but fell short -- reaching only the top of the falling red channel.


We'll see if SPX has enough juice left to take its own shot.  The first test this morning will be pushing through the top of the red channel -- at least intra-day -- at about 1621.50.

UPDATE:  9:52 AM

SPX reached the red channel and is debating whether to push through or take a breather.


Recall, the cluster of targets we discussed last week includes:
  • the gap fill at 1629.22
  • the IH&S target at 1631.67
  • the red .786 Fib at 1634.10
  • the grey .618 at 1638.72
SPX came within 3 points of filling the gap yesterday, but ran into the same channel top and fell back to close at the bottom of the grey channel in the 5th such stop-clearing exercise in a week and the 9th close at or near the daily low in a fortnight.

It also tagged the .500 grey Fib (of 1687-1560) yesterday, where it (so far) reacted less than it did at the red .618.

So, the red pattern is assumed to be the one in charge, with a Gartley Pattern completion at the red .786 (1634.10) the next major Fib target on the radar.

UPDATE:  10:15 AM

A close up shows two smaller patterns also pointing to the 1631-1635 range if SPX can poke through the red channel top.  Note also the presence of the pink .618 here -- contributing to the pause.


We've had a few pieces of economic news this morning.  First, the Fed is set to vote on Basel III this morning.  While significantly watered down, it could still be construed as a speed bump on the road to global financial domination.

Also, Census released the factory orders survey for May. The managed (a.k.a. seasonally adjusted) version came in slightly higher than expected, at +2.1% versus 2.0% consensus and 1.3% for April.


There is bound to be some concern that the slight beat undermines support for QE (does anything else matter?)

This explains why the less-managed, de-emphasized, and not seasonally adjusted number, at +5.4% month-over-month, is the better number for a change.  Remember the good old days when they massaged the numbers to make things look better?

Wednesday, June 26, 2013

Update on Gold: Jun 26, 2013

reposted from pebblewriter.com~

It's been over a month since I last focused on gold.  The equities markets have kept me working overtime, and I assumed our May 15 forecast had long since jumped the tracks.

At the time, gold had plunged 270 to 1321 per ounce in only 4 sessions, bounced at 1321 (the day after our bottom call) to within 13 of our upside target, and was returning for a second bounce -- or not.   From that post [Update on Gold: May 15, 2013]:
Now, at 1373, it has reached a critical juncture that should result in either a sharp rally to 1560 or a plunge to 1141 in the coming month or so.
GC was closing in on the .786 retracement of the the rise off the 1321 bottom.  Playing the bounce was a low risk trade as long as one used trailing stops.
Long positions could be played from the .786 (1357) or .886 (1340) as long as stops are watched very carefully and updated frequently.
 The downside case is probably stronger.  If the current plunge continues past 1321, there are only a few key levels of support before things get really nasty:
  • horizontal support at 1302-1309
  • potential Fib targets of 1276 (the 1.272) or 1219 (1.618)
  • Fib support at 1141-1157
  • Fib support at 947
The bounce came a few days later at the .886 (1336) and despite gaining 84, couldn't clear the big white channel midline, much less the smaller red channel (white in previous charts) it had been in since last September.

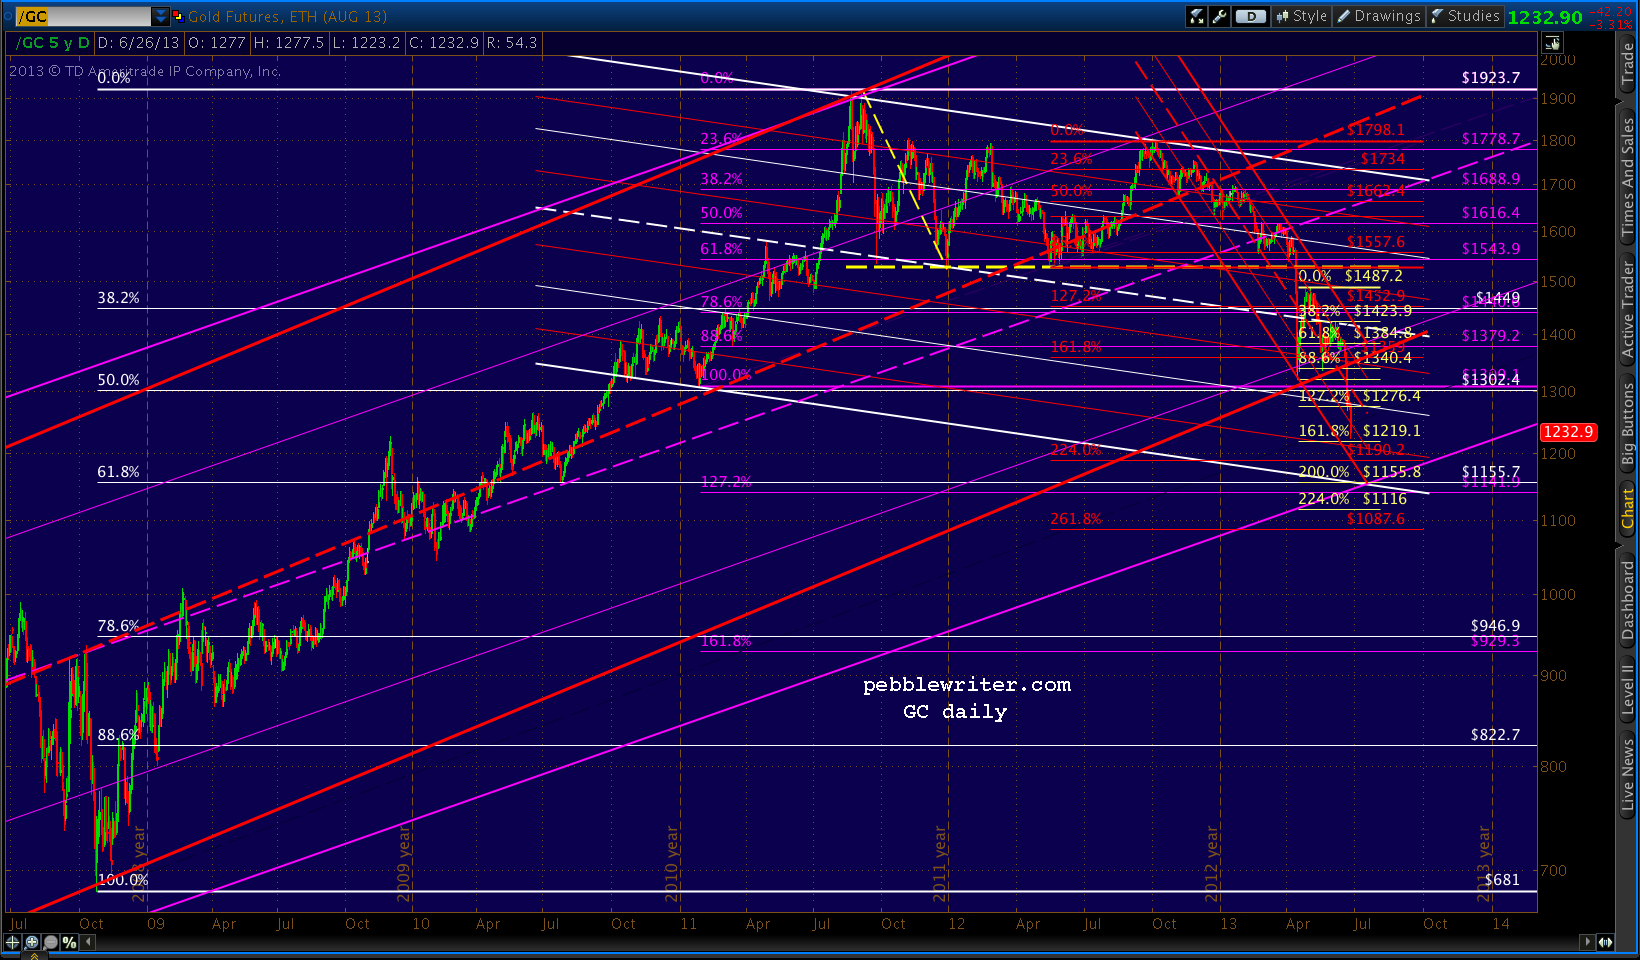
When the big red channel from 1999 broke down on Jun 20, GC plunged again.  It failed to catch a bid at the first support level, but is approaching the second one this morning: the yellow 1.618 that completes the Crab Pattern at 1219.10.


This seems like an opportune time to update the forecast, as gold's price action continues to provide valuable clues as to investors' expectations about QE, the value of the dollar and inflation.  Are the many calls for gold to fall below $1000 per ounce well-founded?

Probably not.  We should get a decent bounce beginning at or near 1219 today that could take prices as high as 1320 or so by July 5-8.  A continued rally through the red midline would mean additional gains to 1357-1385 by mid-July.

But, there's a better chance of a plunge to 1155 instead -- and it need not respect the Crab Pattern about to complete, especially if today's equity rally falters (gold certainly isn't buying the More QE! snake oil.)

Remember that 1155 is the .618 retracement (in white below) of the huge rally from 681 in 2008 to last September's 1923 all-time high. Around July 15, the bottom of the big white channel and the bottom of the red channel intersect there with the bottom of the big purple channel (it replaced the red one that failed on Jun 20.)

This is the same price target we identified in our April 15 Update on Gold.


We can speculate about what circumstances might provide for a floor.  The prevailing wisdom these days is yet another round of QE -- or at least inflation of some variety. With interest rates on the rise, that seems likely enough.  We'll stick a pin in the idea of a mid-July market calamity that necessitates Fed intervention.

...continued on pebblewriter.com...

Wednesday, June 5, 2013

The Hindenburg Omen


Major crash?  Minor correction?  Somewhere in between? 

Did you know it fired off yet another signal today?

Don't be a Barti-dunno.  For the latest skinny on just how ominous this bad boy is, head on over to Albertarocks.  

He’s been studying it for years, and would love nothing more than to clue you in, too.

Check out the latest HERE.

Monday, May 20, 2013

Charts I'm Watching: May 20, 2013

Pebblewriter.com is being transferred from GoDaddy to Hostgator.  But, it takes a couple of days for the content to propagate to various servers around the world.  So, some of you in Asia, parts of Europe, the Caribbean, India and the Middle East are not able to see posts made over the past 24-48 hours.

For the next couple of days, I will update this site alongside the pebblewriter.com site so you're not left out in the cold.  I will also repost a couple of recent posts that were lost during the transition.

Please note that the address of the site has changed slightly:  http://pebblewriter rather than https://pebblewriter.com (the "s" which signifies SSL is no longer necessary, as membership payments are now processed directly by PayPal.)  

If you get an error message when accessing the site, simply go to the address bar and remove the "s" and then refresh the page.  While you're at it, this would be a great time to edit your bookmarks, etc. 

You might notice that once the few remaining bugs are ironed out, the site will run much faster and more reliably.  Disqus doesn't play well with SSL, so comments will now be easier to make, append and edit.

 I have already been impressed with Hostgator's excellent customer service. The propagation hit my server about 10 minutes prior to the opening bell this morning.   My email and a couple of administrative pages weren't working properly.  I called the 800 number and got right through.  Ten minutes later, everything was good to go.


*   *   *   *
~reposted from pebblewriter.com:
Nothing much has changed since Friday's close.  There's a slight negative bias, which could be nothing more than consolidation after Friday's rally.  We'll play along on the downside, with the understanding that 1673 is still on the table.  In other words... tight stops.


Price has been on a tear, but the underpinnings of the rally have been fading the past several days -- as seen on the 60-min RSI chart.


We went to cash at the close Friday because of the conflict between short-term and long-term patterns such as are displayed in the currencies.  The euro and dollar have hit short-term targets, but have more room to go before the tide turns.

UPDATE:  10:10 AM

SPX just pushed above 1667.  I'm going to switch to the long side with stops at 1667 in the expectation that it's headed to 1673.

Note that we're currently above the yellow TL connecting the 1994 and 2002 lows, and at 1667.50 have pushed above the top of the purple channel itself.


As I mentioned earlier, this might be nothing more than an intra-day move. But, we can't ignore the possibility of a breakout here.  It's visible on both the short-term and longer-term RSI charts -- the action immediately ahead of us will determine which it is.


The most logical move, given the degree to which we're overbought, would be a reversal off the channel tops.  But, we'll see...

UPDATE:  12:47 PM

SPX got within .16 of our 1673 target and is rolling over.  Watch for the latest even-more-steeply sloped channel (white) to catch it around 1669-1670.  A drop back through the top of the purple channel would argue for 1663 (yellow dashed TL) for starters, maybe lower.

I'll likely take a crack at an interim short position with any push through 1669.60.


UPDATE:  12:56 PM

Here we go... interim short here at 1669.60.


Totally jumped the gun on that one.  Stopped out with a bounce at the top of the purple channel.  Should have been more like 1669.  Too bad, because the dollar's confirming a drop here -- as is SPX RSI.

I'll just wait for a push through 1669 itself.


To give you an idea of how silly this has become, the little white channel slopes up through the red channel which slopes up through (and has, for the moment at least, departed) the purple channel.
This is, by definition, exponential: increasing at an increasing rate.

UPDATE:  1:19 PM


Just got the break.  Full short here at 1669.  Charts in a few...


For the bears, a move back through 1663 is necessary to generate any real downside potential.  Otherwise, this could be viewed as a backtest of the yellow TL.

As always, watch for the back test of the broken channel/TL -- in this case, stops around 1670.50 should be safe.


UPDATE:  2:40 PM


Got very close to the yellow TL and bounced.  It's not clear yet whether that was the extent of it.  But, I'd expect SPX to at least tag the red channel midline -- currently at 1663.75.


UPDATE:  3:55 PM

Holding short into the close.  The dollar and euro appear very ready to reverse, and SPX is still back below the purple channel top, meaning a reversion to the midline is the most likely scenario.

There is a good possibility that DX will sell off a little more first -- say 83.609.  But, that could easily happen overnight.  If not, look for SPX to retrace to 1670-1672 before any additional downside.  In other words, a potential gap and crap on the opening bell.


GLTA.

Friday, May 3, 2013

Which Lie Did We Tell?

Reading the employment reports these days reminds me of the story told by William Goldman, celebrated screenwriter of such classics as Butch Cassidy and the Sundance Kid and All the President's Men.  He was waiting for a producer to get off the phone when the man suddenly cupped his hand over the phone and shouted to his assistant: "Bill, Bill!  Which lie did I tell?"

When we learn that the government is unable to keep track of the number of its own employees from month to month, how are we supposed to trust that any other number that purports to tell us how many folks are employed in offices, warehouses and saloons across the nation?


In the "bad news is good news" (more QE) and "good news is good news" world in which we're living, this morning's jobs report is -- surprise! -- good news.

*  *  *  *  *  *  *  *

We're still long from yesterday's low, but coming up on important resistance.  This morning will be about figuring out when to sell.  I suspect 1615-1616 would be nice.

The dollar shot up on the news to an important channel line and the .618 retracement of its fall since Apr 24, but is dropping back.  How far it falls could be quite telling.


Stay tuned...

UPDATE:  9:42 AM

SPX just hit 1616.16.  Shorting here, with stops at 1618ish.  Charts in a minute...


Note SPX just hit the top of the red channel within the broader purple channel, as well as the 1.272 Fib extension of the 1597-1536 drop from Apr 11-18.

There are still a number of higher potential targets:
  • the top of the purple channel, currently around 1646
  • the IH&S target of 1650 (now that SPX finally crossed the neckline)
  • the white 1.618 extension at 1635.25
But, odds are they'll have to wait for a back test of the lines of important resistance just broken.  It's not that the 1.272 Fib line is that important.  There was no meaningful .786 reversal, so this harmonic pattern is much more likely to extend to the 1.618 at 1635.

This was our upside target if SPX was able to break through the resistance it just did.  And, we're at an unusual point on the purple channel -- the .625 line.  The .75 would be a much more common end point.

UPDATE:  10:29 AM

Looks like SPX is breaking out of the red channel, triggering our 1618 stop.  So we'll switch back to the long side for a likely run up to 1624ish.  Stops at 1614ish.


The red channel is drawn with the best fit on the interior points on the 15-min chart.  But, by the time you examine a channel on longer time frames, all those precise reversals at the channel lines pretty much disappear.  In other words, there's always wiggle room.

In fact, I'm going to switch back a short position here at 1618 just to protect against the possibility that wiggle room is at work here and the "break out" mentioned a moment ago is a false alarm.  If SPX pushes back up through the top of the red channel, I'd be content with an interim long position for a trip to 1624 rather than switching sides all together.

UPDATE: 10:55 AM

We've been talking about 1635 a lot lately.  There was Apr 29, when SPX came within one point of making a new high:
On the other hand, if it dips below 1592 in the morning, it has downside risk to the channel bottom at 1576 [it hit 1581] where it would likely catch a bid and start a run to 1635.
On Apr 25, when charting the IH&S (before it went circus freak on us) in Best Laid Plans:
That way, the Inverted H&S Pattern would feature a neckline that’s roughly the same as the purple channel .25 line, and would target the same price level as the 1.618 extension of the 1597-1536 slide: 1635.
But, my favorite reference was in July, 20 2011 in Ten Lousy Points, as we were about to nail the call-of-the-year thanks to our 2011 as 2007 analog:
There was a Santa after all!  The Dow soared 205 points, the S&P; 500 over 21.  The next two days tacked on 13 more points.  At that point, SPX was just 10 lousy points from completing an inverse head & shoulders pattern that might have sent it up 125 points to 1635.
We all know the rest of the story.  Suffice it to say there were a lot of hangovers those next few weeks that had nothing to do with New Year celebrations.  SPX dropped 120 points in 2 weeks, 230 points in 4 weeks and 750 points by the following Christmas.
There's no real connection, of course.  After topping the 2000 high, SPX had just missed -- by 30 points -- completing an Inverted Head & Shoulders Pattern (in purple, below) that would have targeted around 1670.  Note that 1670 was also the 1.618 extension of the Crab Pattern that was in the works (also in purple.)


But, all was not lost.  After peaking at 1576, SPX went on to construct another IH&S that looked promising.  If it completed, it would have targeted 1635 -- indicated by the dashed yellow horizontal line.

It came within 10 points on Dec 26, but couldn't quite close the deal.  As I wrote in July 2011, the rest was history.  That 1635 IH&S target would have to wait...until now.


continued on pebblewriter.com...

 *  *  *  *  *  *  *  *

BTW, I've extended and expanded the current membership offer through the end of the weekend.  Charter Annual memberships at $1,200 fix your subscription price for the life of the site.   Annual memberships are slated to increase to $1,800 when this deal is done and $2,500 when the upcoming fund is launched.   Click HERE to sign up.
 

Thursday, April 25, 2013

The Best Laid Plans

The best laid plans of mice and men
Go often awry,
And leave us nothing but grief and pain,
For promised joy!
Robert Burns, 1785


ORIGINAL POST:  6:45 AM EDT

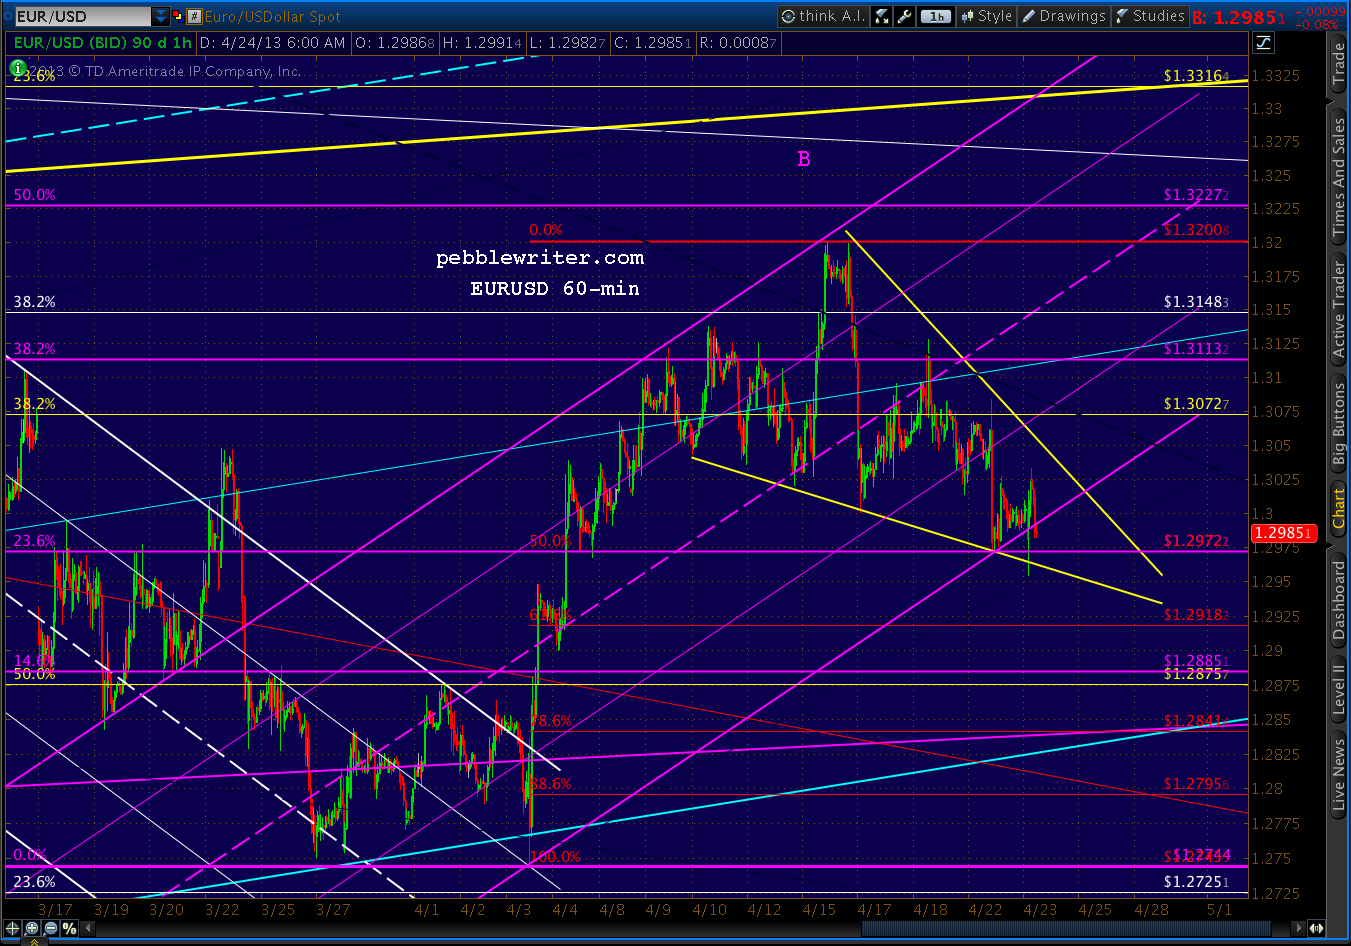
The wedges we've been watching on DX and EURUSD are playing out.  EURUSD has broken out...


...and DX has broken down.


But, it's the USDJPY that I'm watching especially closely this morning.  It still hasn't broken 100 since our Apr 8 observation [USDJPY update] that it was running out of steam:
"...there is growing risk of a downturn as it approaches 100... it appears the pair might have hit at least interim resistance at today’s high."
It topped out 3 sessions later at 99.94, and two weeks later is in danger of a larger pullback.


Remember, weakening the yen was a critical element of the BOJ's stimulus program that was supposed to generate inflation, boost Toyota sales and send Japanese investment funds flooding into foreign markets.


Instead, Japanese investors are repatriating their funds from abroad -- a net Y9.5 trillion ($95 billion) since the first of the year.  Why?  As any US investor could tell you, QE might not inflate economies, but it sure as hell inflates markets.

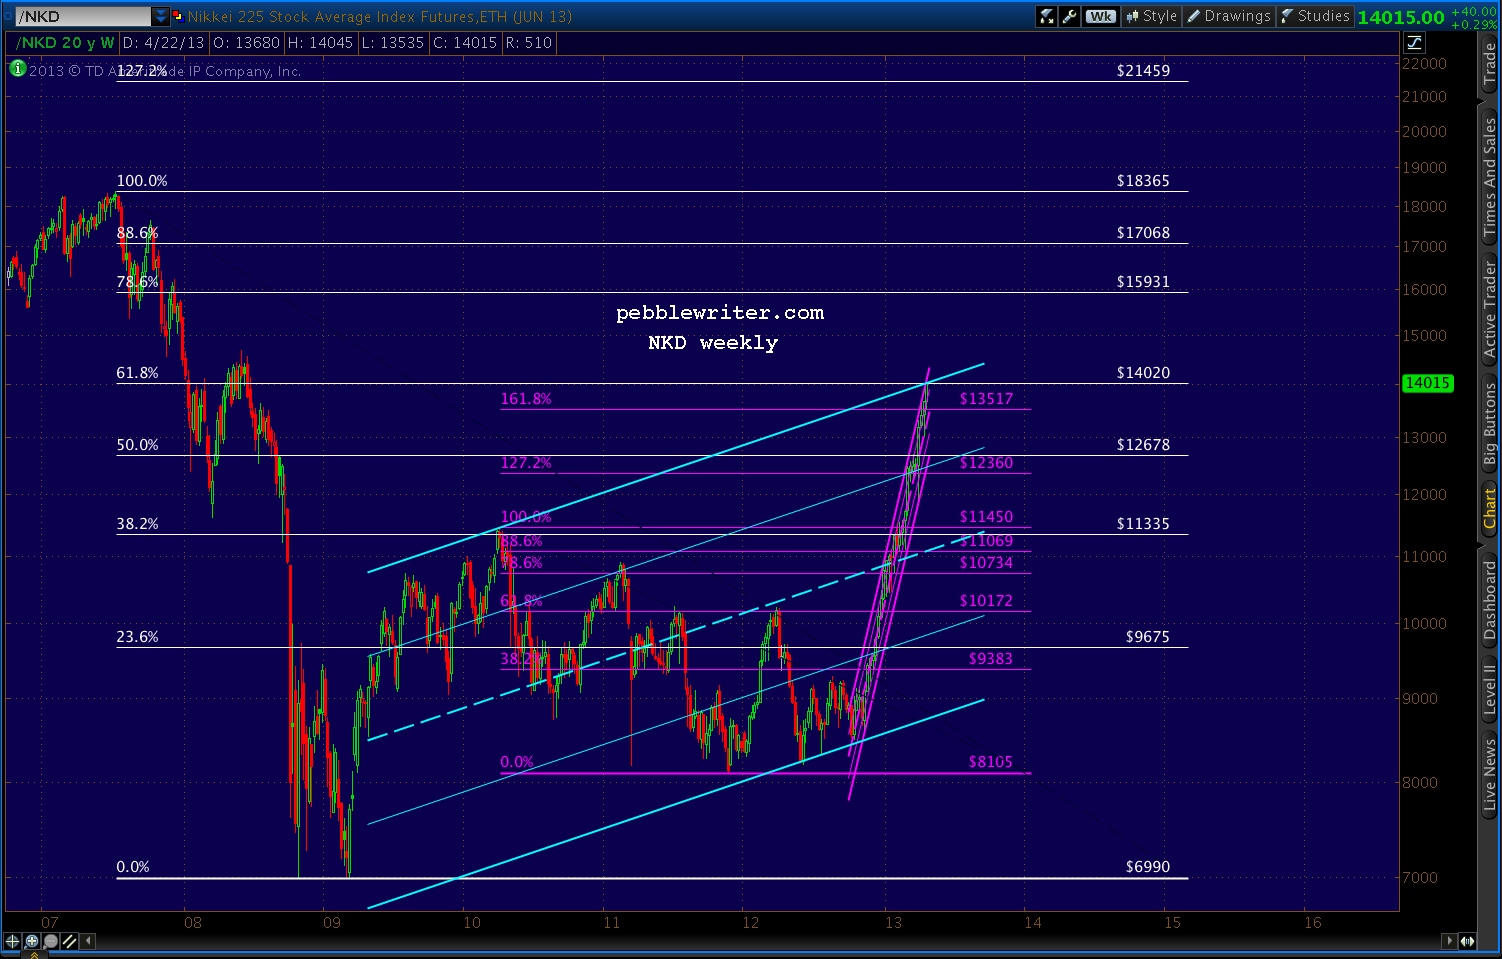
The Nikkei 225 is up 65% since last October's lows....


...and, still hasn't even recovered 2/3 of its losses from the 2007 crash.  The Dow and the S&P 500, by contrast, have recovered all of them -- and, then some.  So, to many, the Nikkei still seems the better value.  It's hard to argue with success.

But, I'll do it anyway.  In reaching 14,020 a few hours ago, NKD tagged the .618 Fibonacci retracement of its 2007-2009 crash from 18,365 to 6990.


To those not familiar with harmonics, this tends to be a big deal.  When SPX reached the equivalent point in April 2010, it plunged 17%.  The DJIA fell almost 15%.  The USD, represented by DX, soared 9.3%.

But, the yen positively soared.  USDJPY started a 17-month slide that took the pair down 20% from 94.98 to 75.78.  NKD, which had just reached its .382 Fib, shed 23% over the next 4 months, eventually reaching almost 30% in Nov 2011.

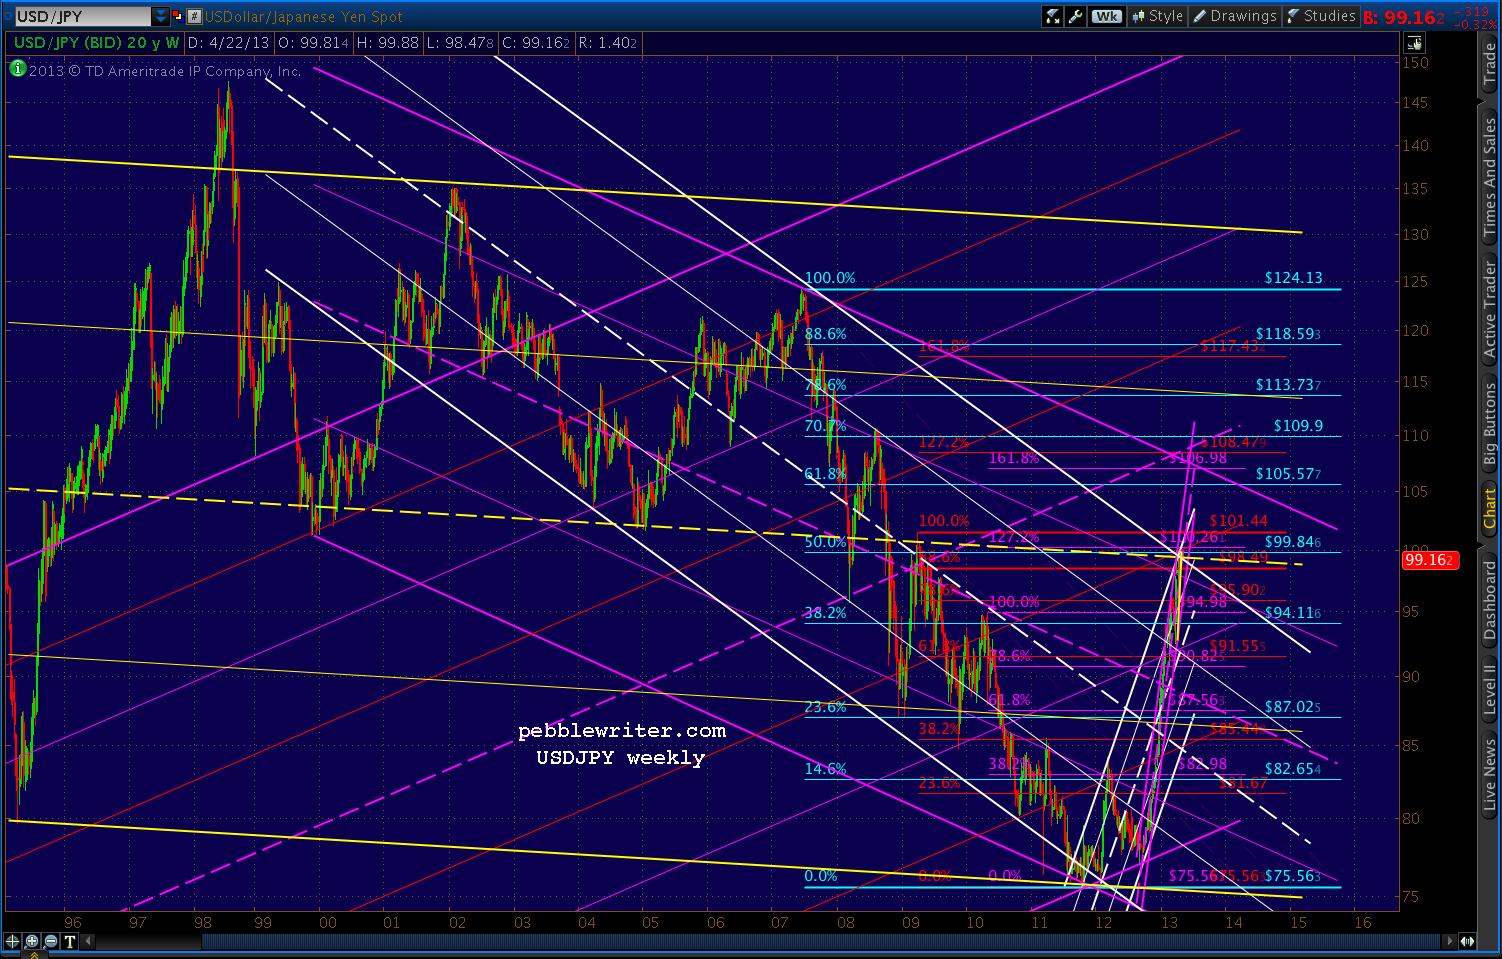
Could the USDJPY's failure to break 100 be telling us something?  You better believe it.  I called a top a few weeks ago because the pair had reached several important Fib levels as well as the midline of an important channel (in yellow, below)...


...that dates back to 1995.


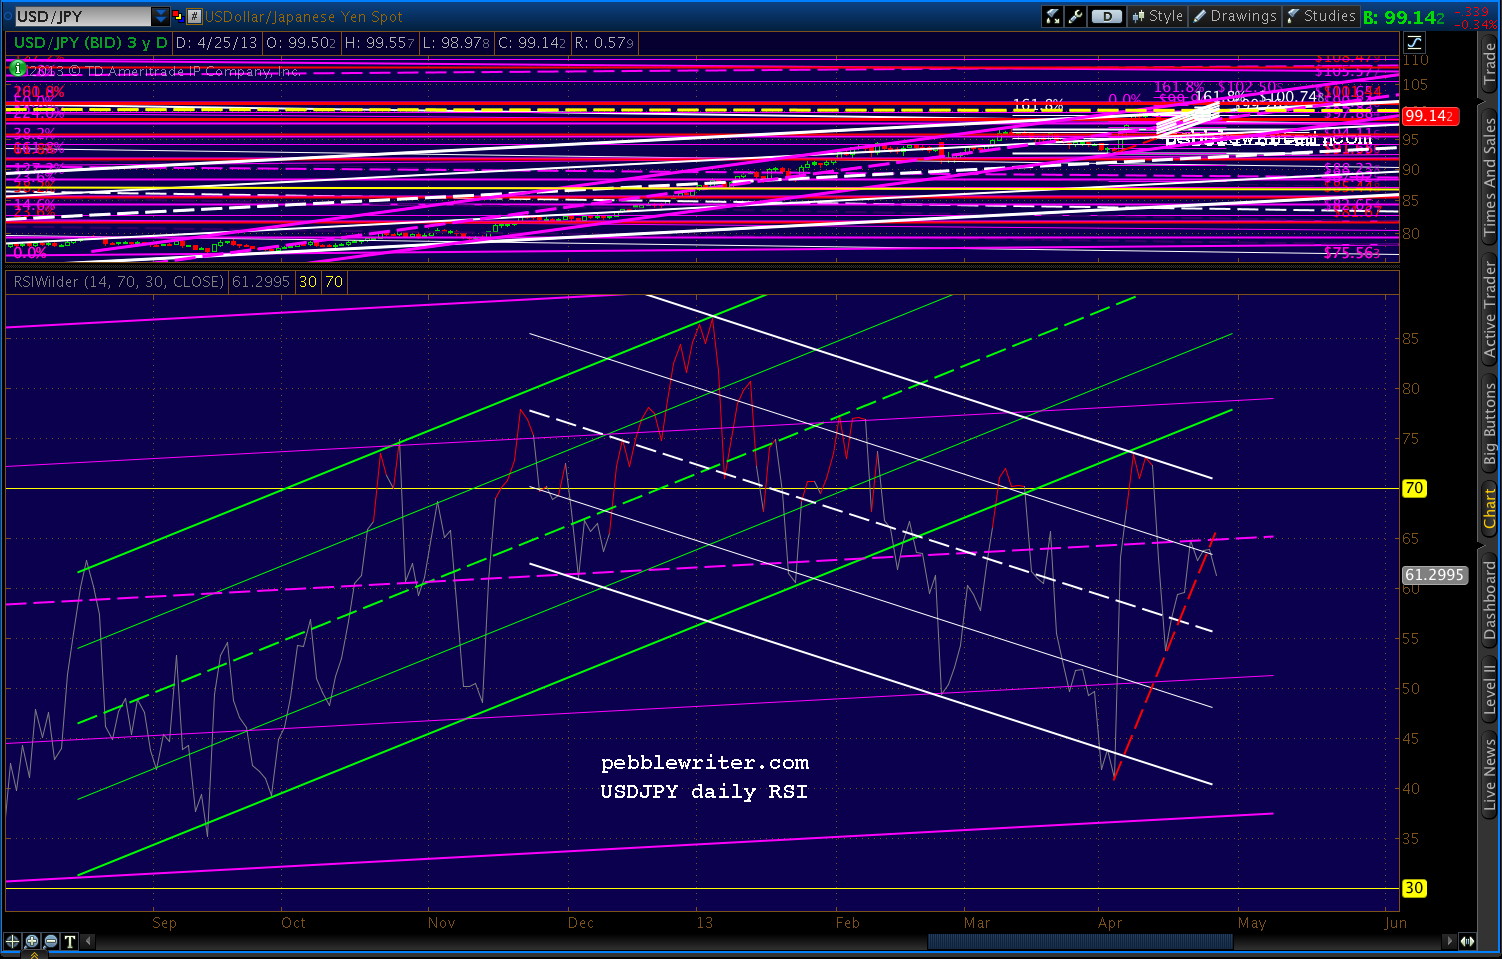
There's no guarantee it won't push through instead of retreating, but the RSI picture supports the danger of a significant retreat.

Daily RSI has backtested the broken yellow channel twice, but the trend is clearly down -- with the latest push being rebuffed by the purple midline.


And, a close-up reveals that a breakdown has already started.


Wednesday, April 24, 2013

Chart Patterns and You

ORIGINAL POST:  9:15 AM EST

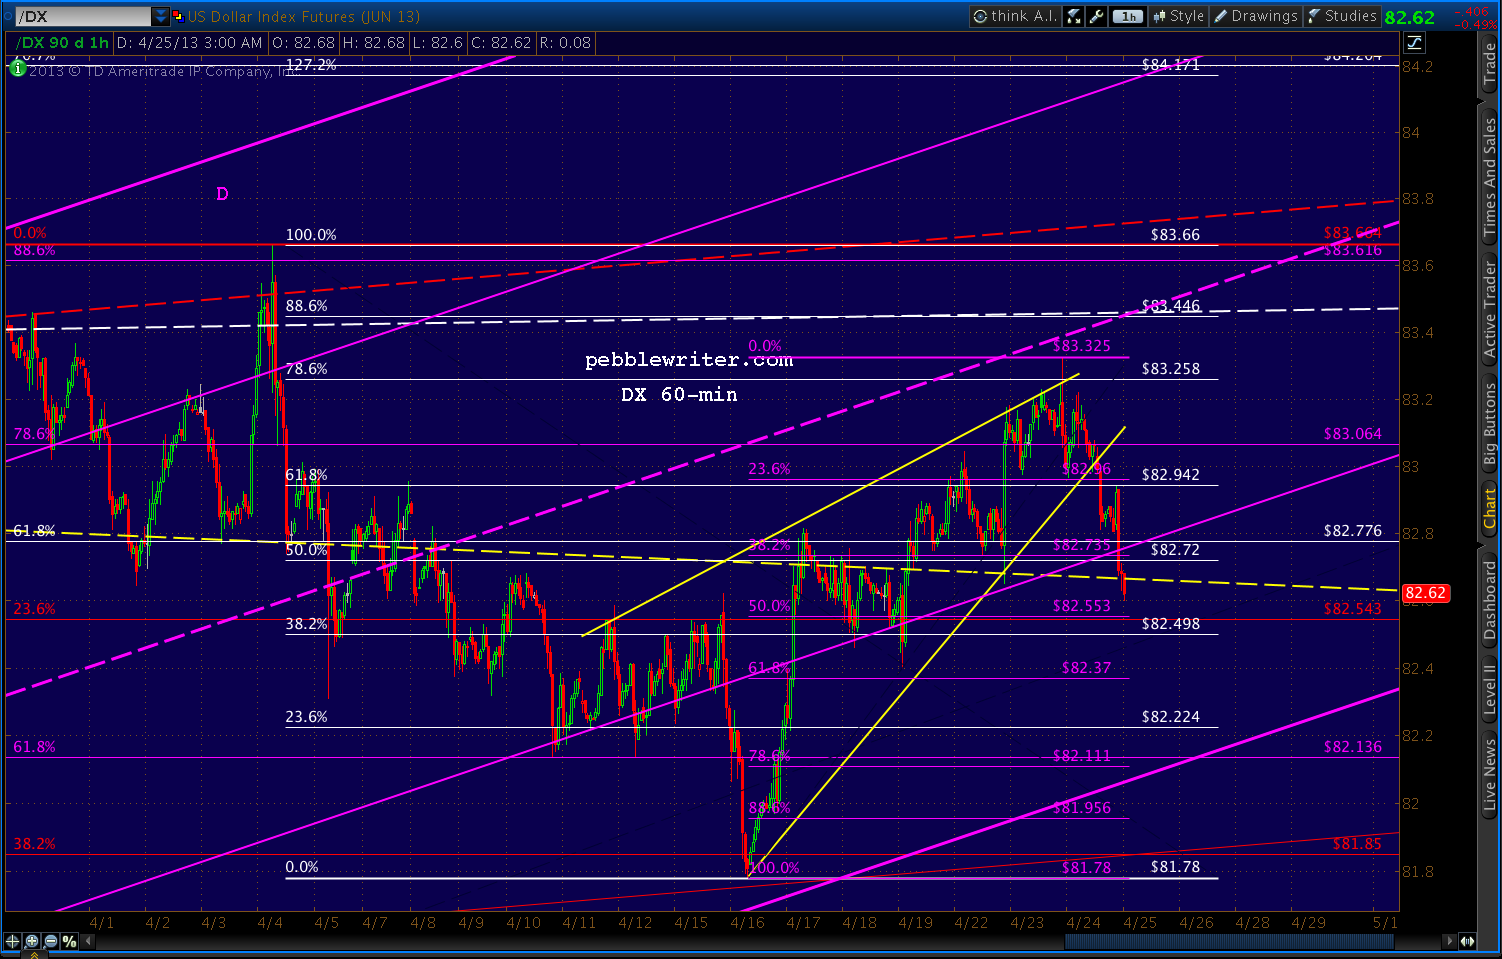
Last night, the dollar tagged the .786 Fib retracement of its decline from Apr 4.  It subsequently sold off almost to the .618 but, so far, is hanging in a rising wedge.


The EURUSD re-tested the .500 Fib of its rise from Apr 3, and snapped back into its falling wedge and the (purple) channel that's guided prices since then.


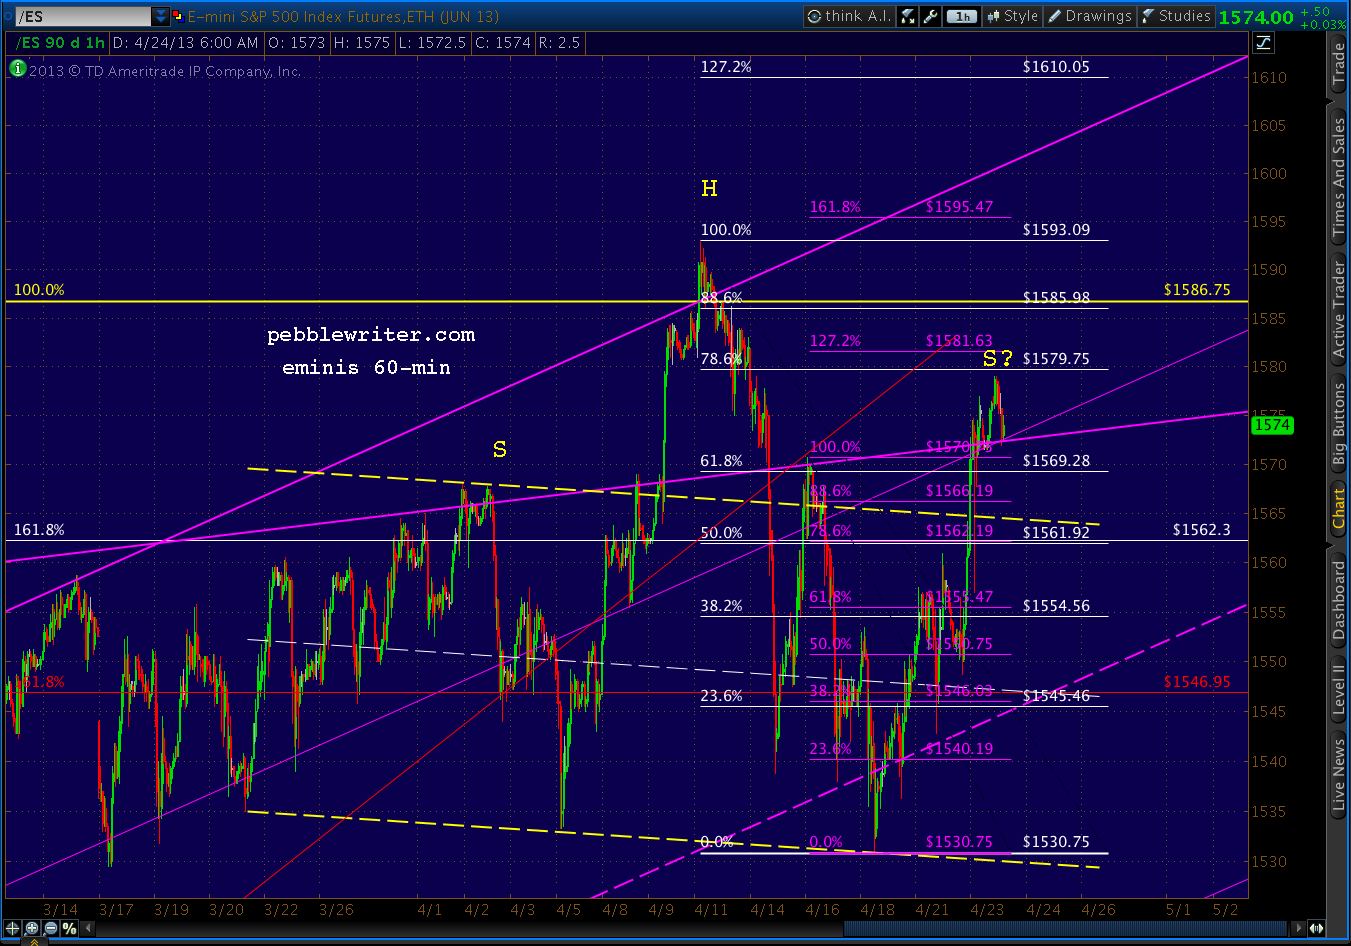
The e-minis tacked on a few points overnight -- almost reaching the .786, only to give them all back with this morning's underwhelming Durable Goods report.  The Head & Shoulders Pattern that was looking pretty good at yesterday's open is now looking a little iffy, with a right shoulder that's already 15 points higher than the left.


UPDATE:  9:45 AM

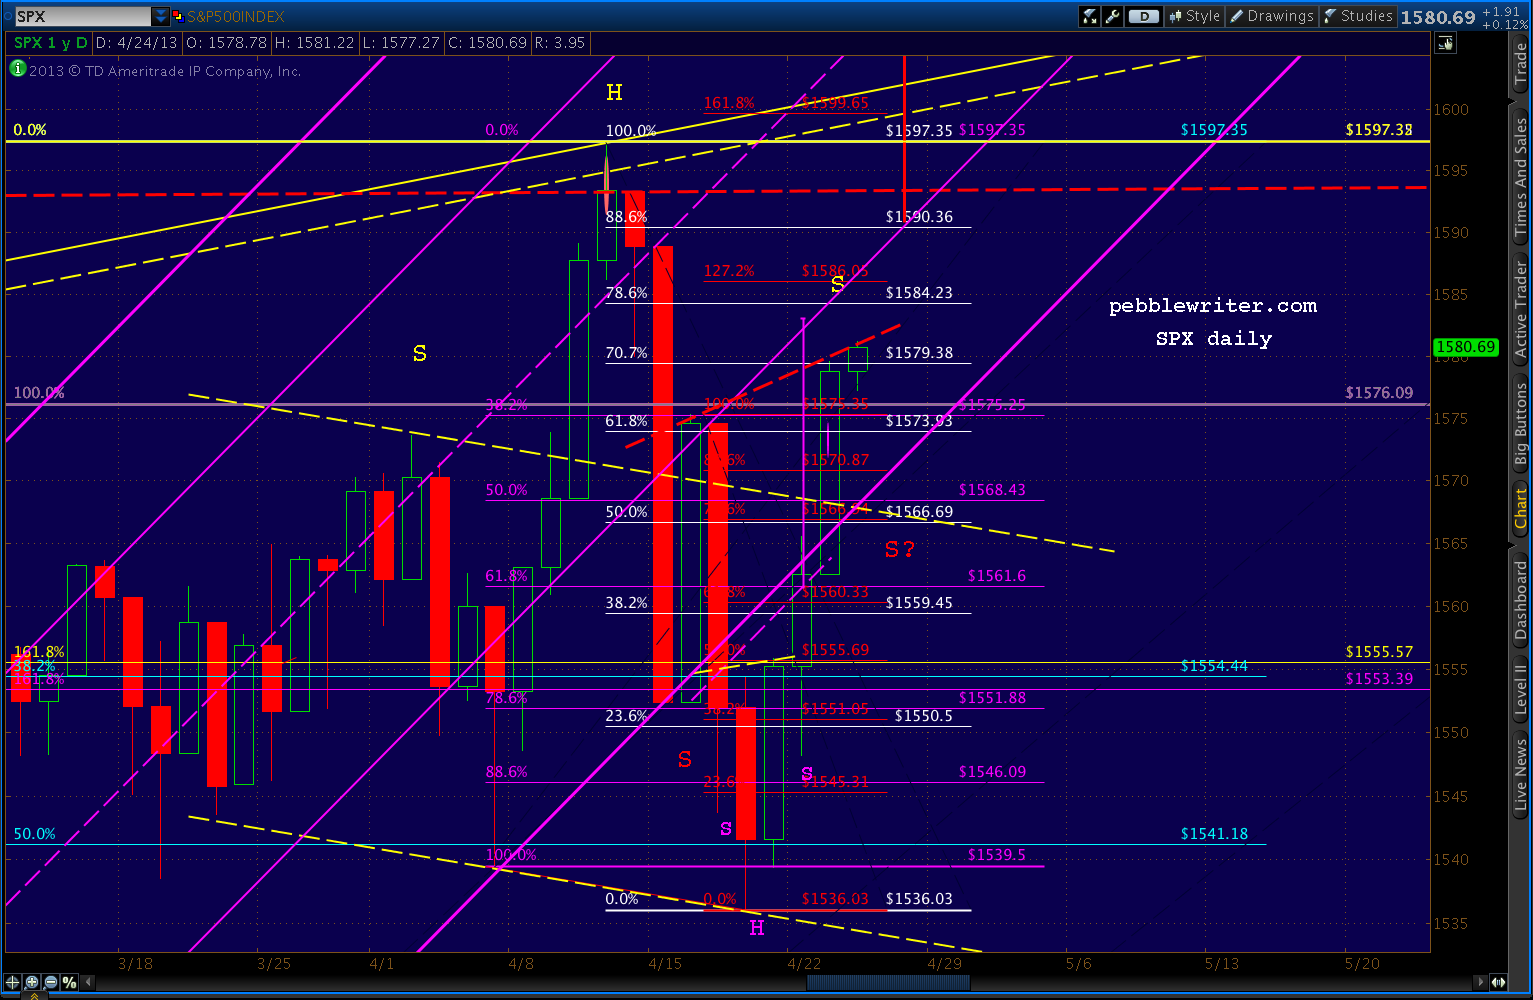
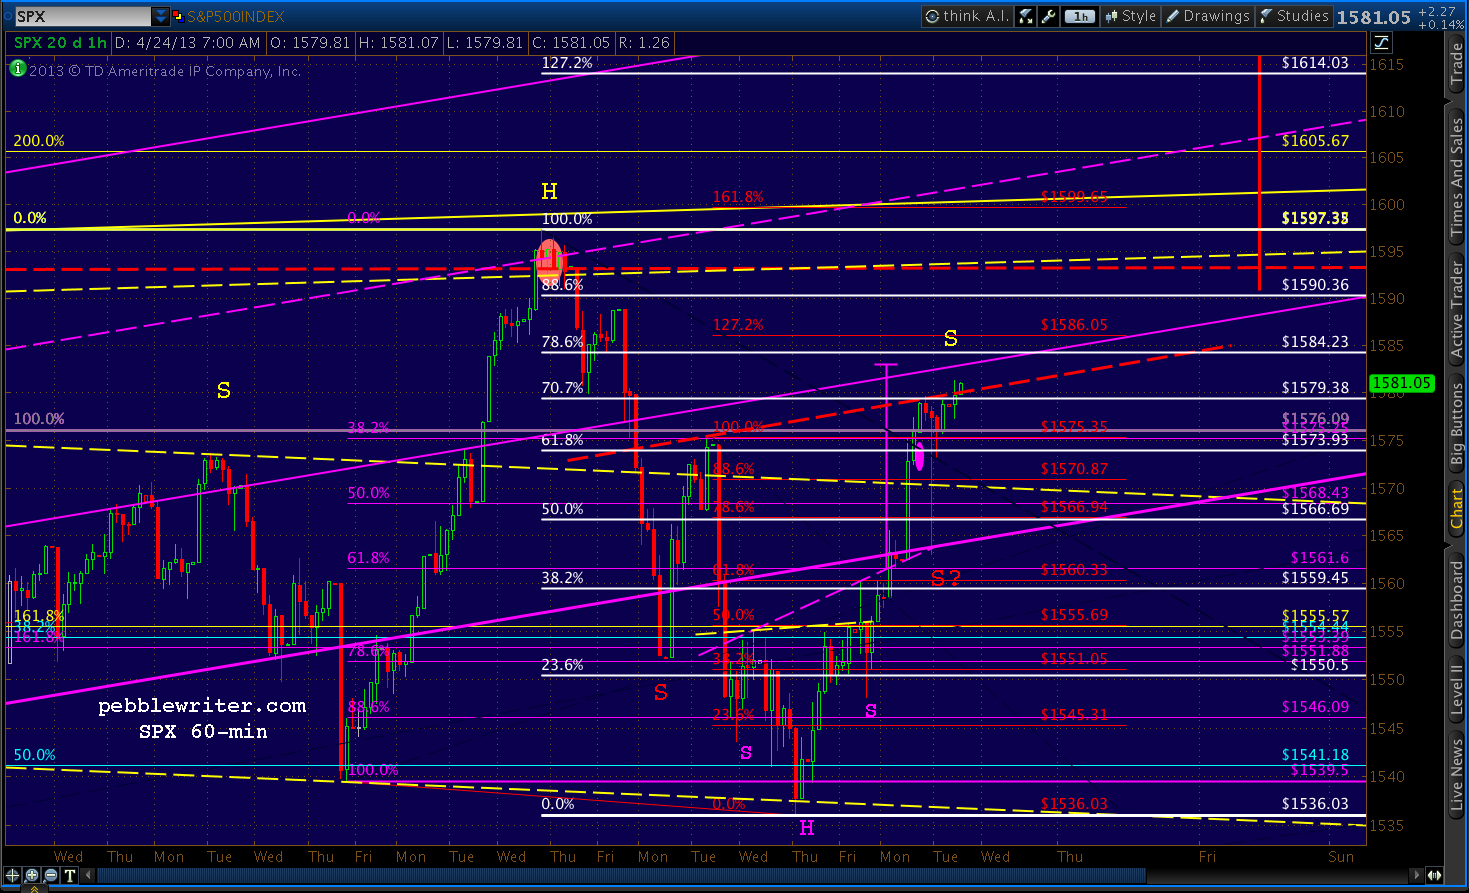
SPX continues trudging toward the .786 retracement (1584.23) of its decline from 1597 to 1536.


After plunging beneath the channel that's guided it from 1343 to 1597 on Apr 17, SPX rallied and re-joined the channel yesterday.  This was a very bullish development, as long as SPX remained in the channel all the way to the closing bell.

Despite a five minute thrill ride from 1578 to 1563 (the channel bottom) and back, SPX managed to regain and hold the 2007 high of 1576.09 into the close.

It now sits perched on the neckline of an Inverted H&S Pattern which has either completed or not, depending on whether a 5-minute plunge qualifies as a shoulder.  Short answer -- I have no clue.


Here's what we do know:
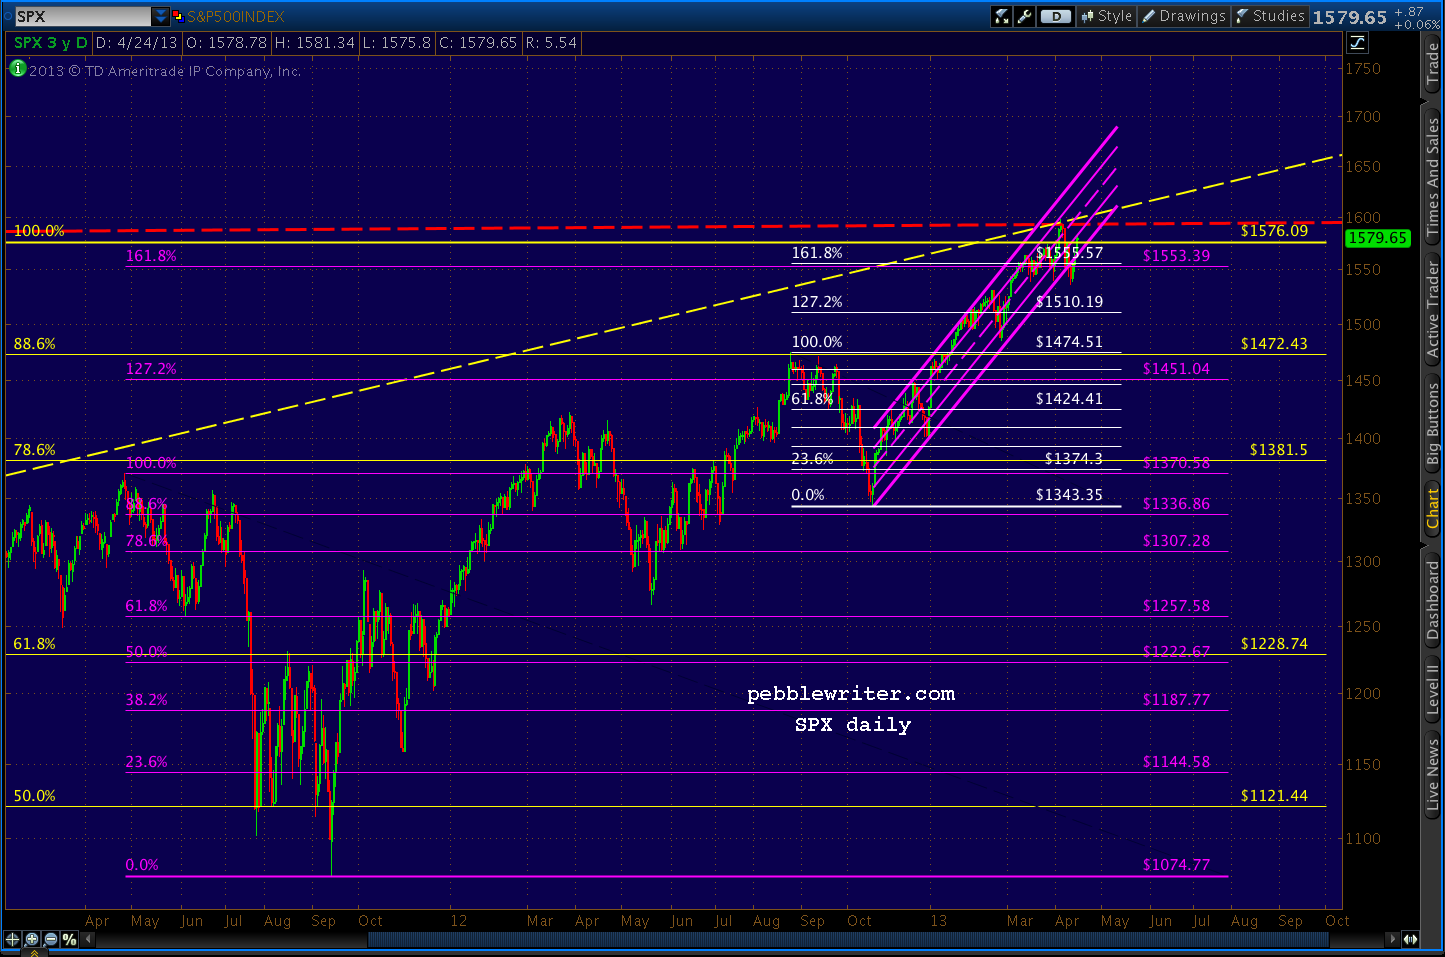
  1. Prior to Apr 17, SPX had been locked into that purple channel below since 1343 on Nov 16 -- an 18.9% gain in five months
  2. SPX barely paused when it completed two big Crab Patterns -- the 1.618 extensions of the 1370-1074 decline and the 1474-1343 decline (purple and white below)
  3. Instead, SPX exceeded the Oct 2007 high of 1576.09 (yellow)
  4. SPX reversed at 1597.35, almost precisely at a trend line drawn between the 2000 and 2007 highs
  5. SPX fell 3.8%, making a lower low, dropping out of the channel mentioned above and suggesting a H&S pattern that targets 1474 -- the Sep 2012 high (white pattern)
  6. It roared back into the channel, retracing almost 78.6% of its drop
  7. In the process, it topped the 1576.09 high and the 1553 and 1555 Fib levels and almost reaching the 1583 target of an IH&S Pattern
  8. Depending on your interpretation, it might also have completed an IH&S that targets 1621.


What Does It All Mean?

When I forecast markets, I look for lines in the sand.  I try to determine price levels that, if crossed, would signal a change in trend.  When that trend switches from bullish to bearish, I want to be short.  When it switches from bearish to bullish, I want to be long.

A channel is one such method that features boundaries rather than absolute price levels.
As long as prices remain in a rising (or falling) channel, we can expect prices to continue to rise (or fall.)  It's rather simplistic, but it usually works.  We can make educated guesses as to future price targets based on where the channels point.

Of course, even well-formed channels (multiple tags on the top and bottom and over a sufficient time period) can't go on forever.  I look for moments when prices must choose whether to remain in or leave the channel.  A tag of a top or bottom bound or midline usually create opportunities, though other lines can as well.

The Real World

Recall that we shorted SPX at the 1597 high on the 11th [see: Big Picture], riding down to the channel bottom where I went long at 1554, expecting at least a bounce.  We got one on the 16th with SPX rallying up to 1575 -- the channel .25 line.

We closed our long position, going short the following morning for the trip back to the channel bottom at 1555.  We tried another long position there, but were quickly stopped out as the channel was broken -- signalling a bearish trend change.

So, we shorted again, playing quite a few bounces down to 1540 where we eventually went long in anticipation of establishing a H&S Pattern neckline [see: Dollar Daze.]

At that point, I expected a back-test of the broken channel.  We got it, reaching 1565 on the 22nd but closing beneath the channel's lower bound.  Note that this move completed 5/6 of a H&S, but the right shoulder was underdeveloped relative to the left.

Anticipating an intra-day retracement to 1567 (the .500 Fib) or 1574 (the .618) the next day (yesterday), I stayed long -- trying without much success to anticipate the top.  Since SPX topped the .618, the next up on the chart is today's target: the .786 at 1584.23.

Going Forward

With all that as preamble, here's what I expect going forward.

...continued on pebblewriter.com...