ORIGINAL POST: 9:15 AM EST
Last night, the dollar tagged the .786 Fib retracement of its decline from Apr 4. It subsequently sold off almost to the .618 but, so far, is hanging in a rising wedge.
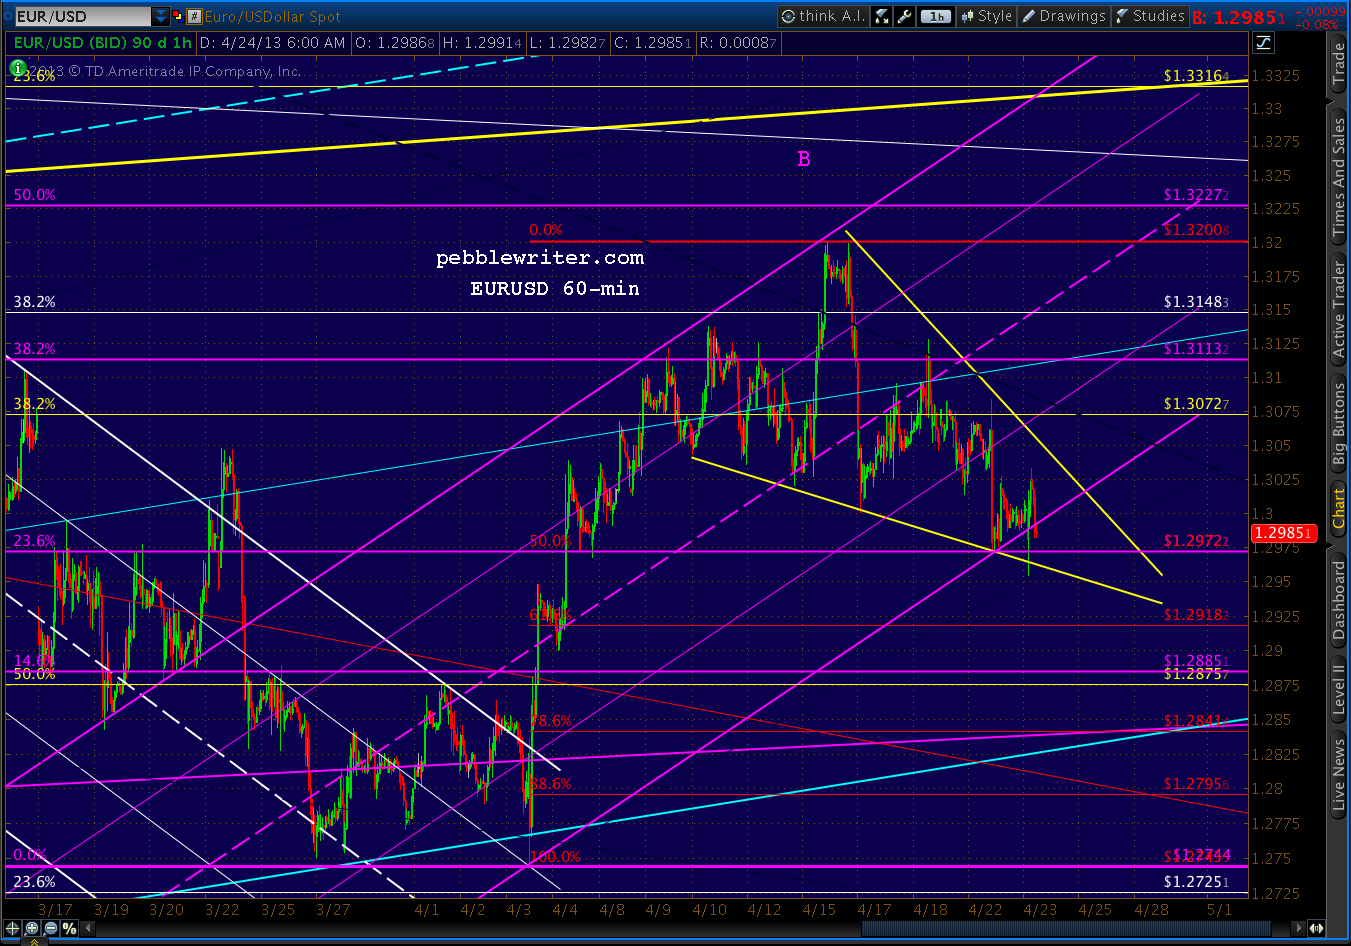
The EURUSD re-tested the .500 Fib of its rise from Apr 3, and snapped back into its falling wedge and the (purple) channel that's guided prices since then.
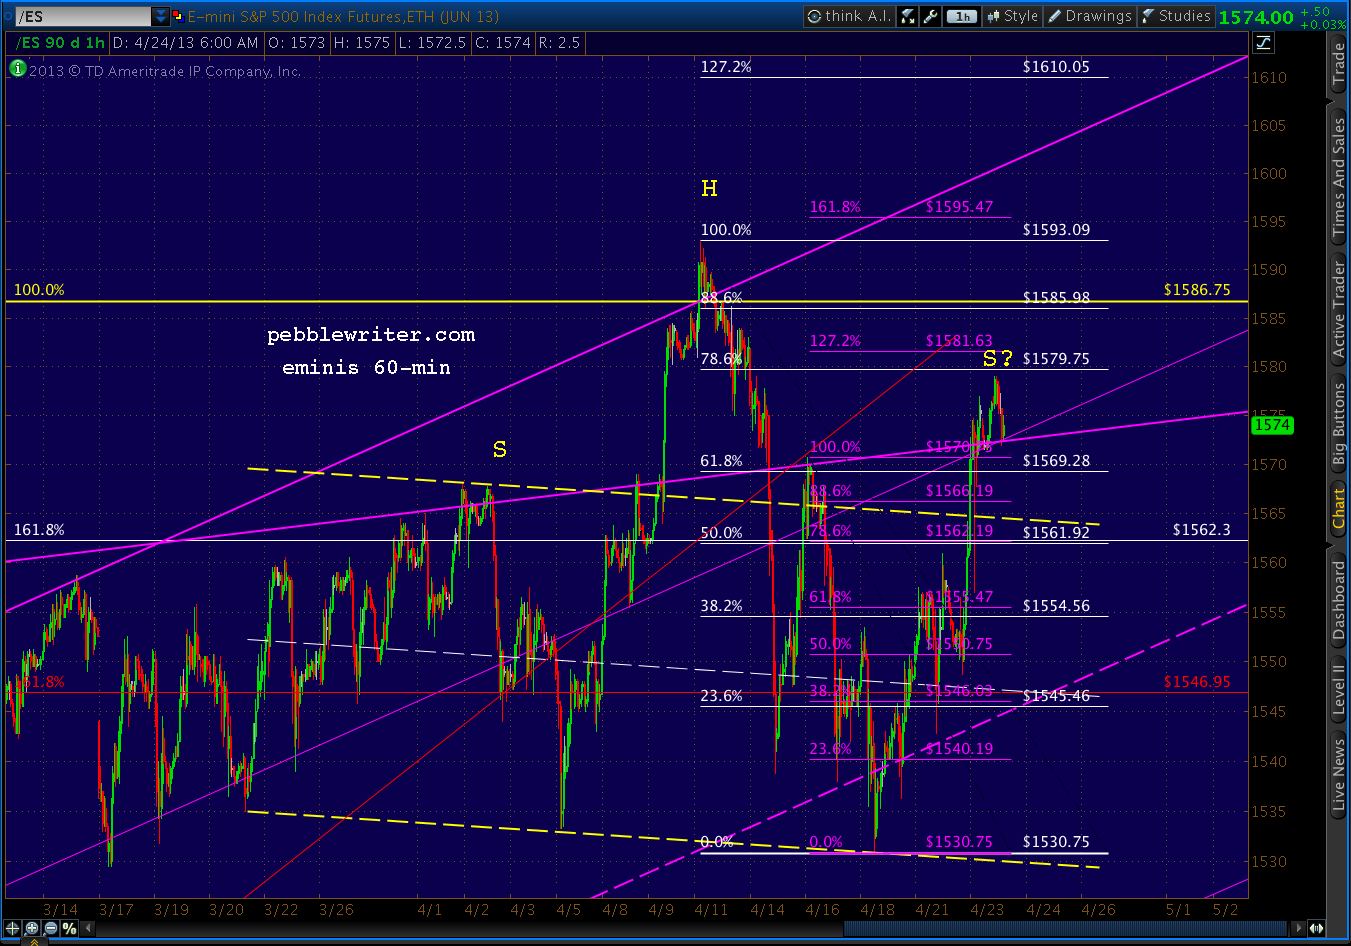
The e-minis tacked on a few points overnight -- almost reaching the .786, only to give them all back with this morning's underwhelming Durable Goods report. The Head & Shoulders Pattern that was looking pretty good at yesterday's open is now looking a little iffy, with a right shoulder that's already 15 points higher than the left.
UPDATE: 9:45 AM
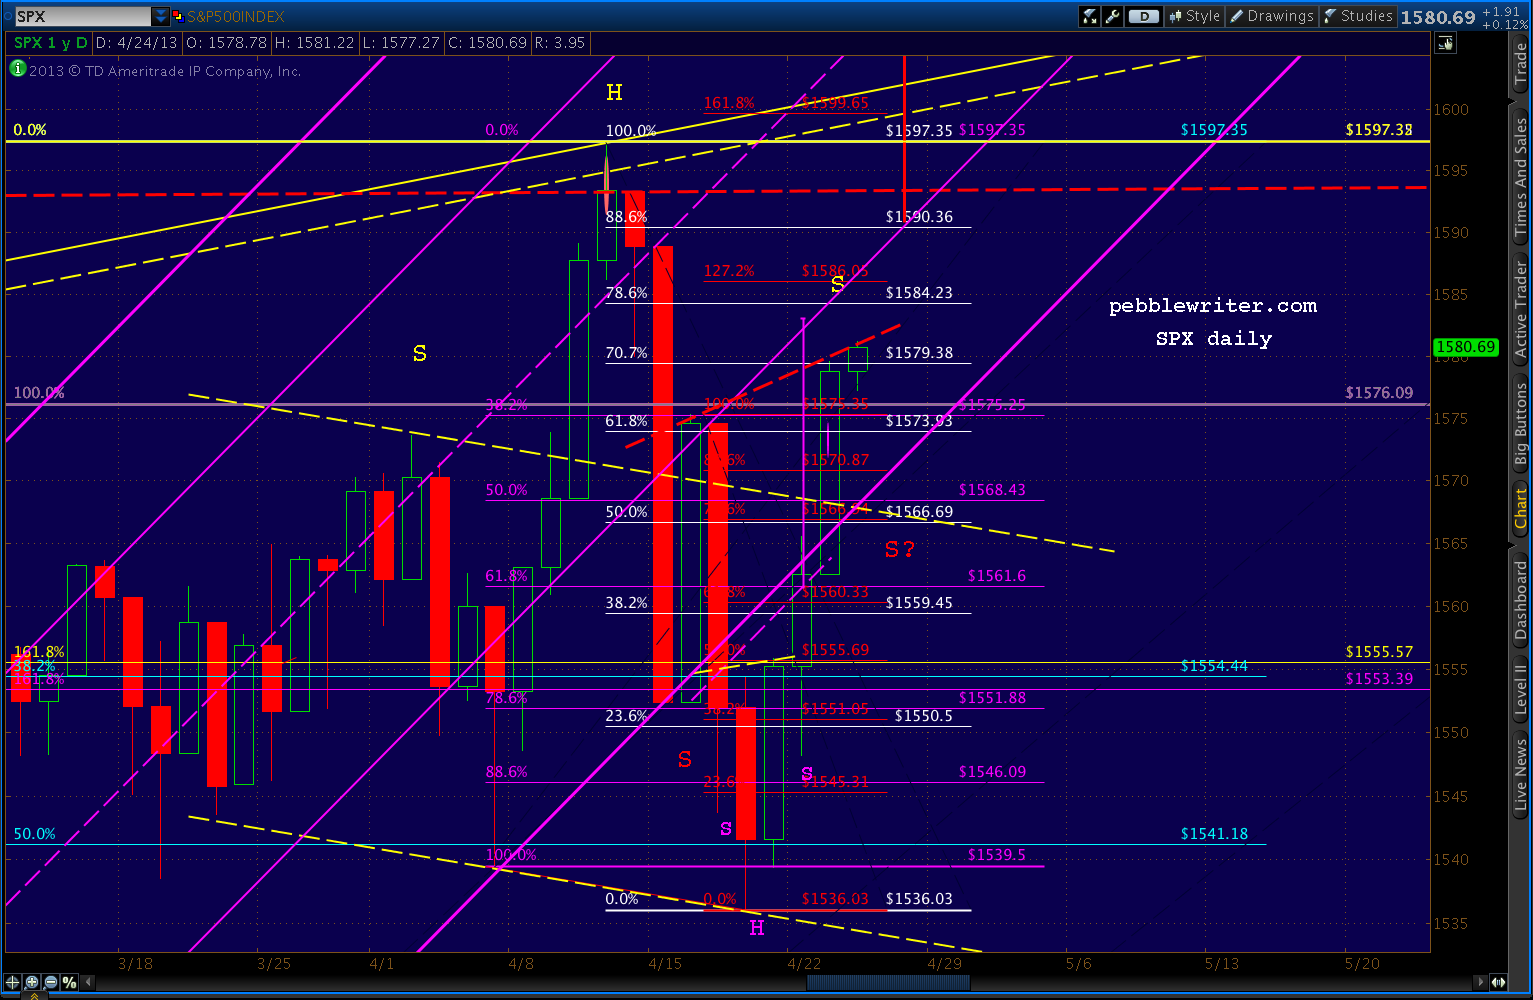
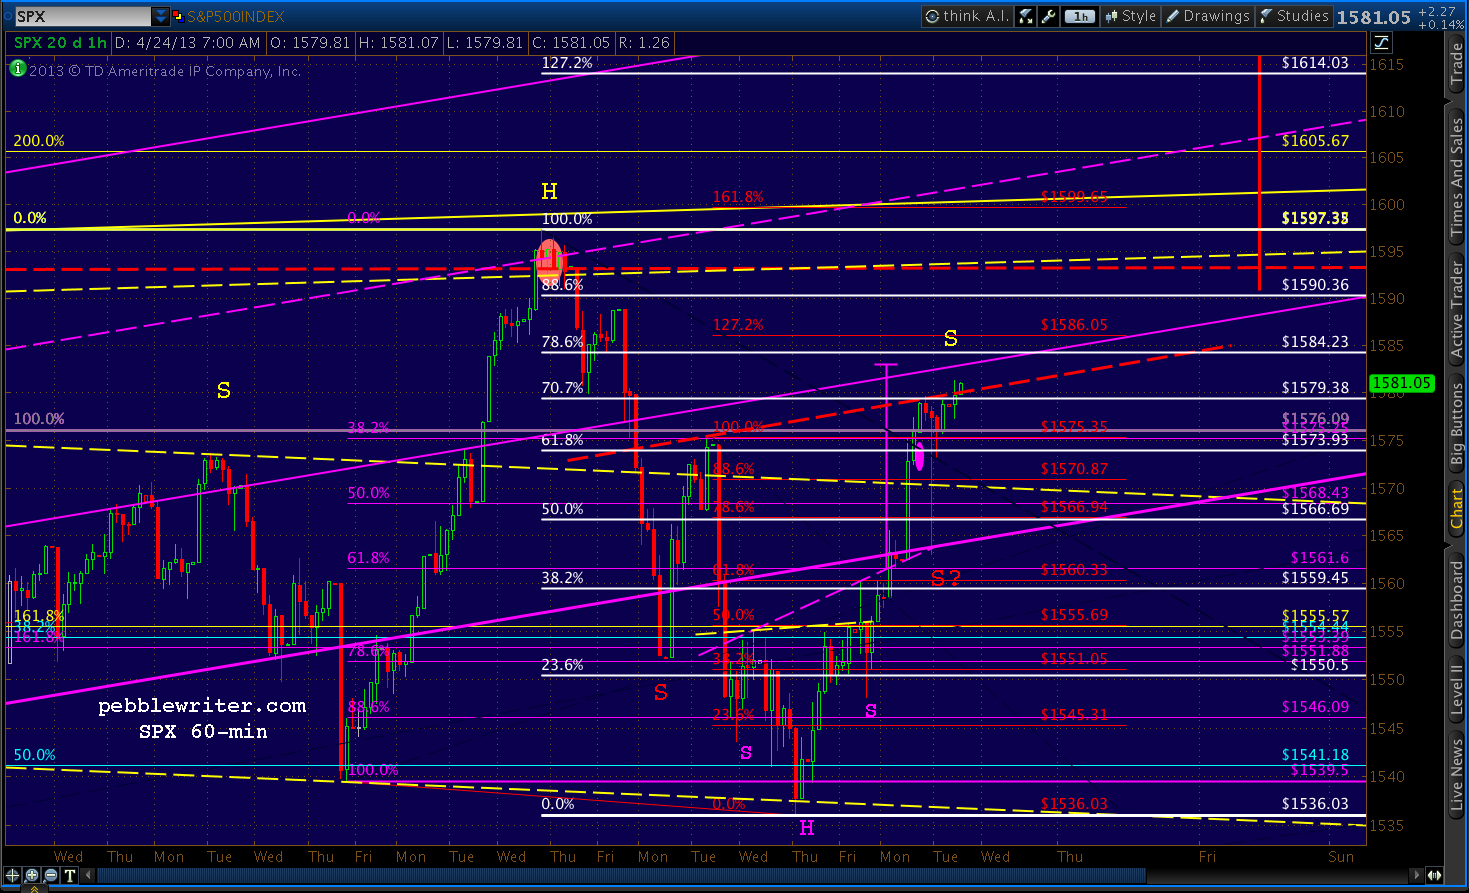
SPX continues trudging toward the .786 retracement (1584.23) of its decline from 1597 to 1536.
After plunging beneath the channel that's guided it from 1343 to 1597 on Apr 17, SPX rallied and re-joined the channel yesterday. This was a very bullish development, as long as SPX remained in the channel all the way to the closing bell.
Despite a five minute thrill ride from 1578 to 1563 (the channel bottom) and back, SPX managed to regain and hold the 2007 high of 1576.09 into the close.
It now sits perched on the neckline of an Inverted H&S Pattern which has either completed or not, depending on whether a 5-minute plunge qualifies as a shoulder. Short answer -- I have no clue.
Here's what we do know:
What Does It All Mean?
When I forecast markets, I look for lines in the sand. I try to determine price levels that, if crossed, would signal a change in trend. When that trend switches from bullish to bearish, I want to be short. When it switches from bearish to bullish, I want to be long.
A channel is one such method that features boundaries rather than absolute price levels.
As long as prices remain in a rising (or falling) channel, we can expect prices to continue to rise (or fall.) It's rather simplistic, but it usually works. We can make educated guesses as to future price targets based on where the channels point.
Of course, even well-formed channels (multiple tags on the top and bottom and over a sufficient time period) can't go on forever. I look for moments when prices must choose whether to remain in or leave the channel. A tag of a top or bottom bound or midline usually create opportunities, though other lines can as well.
The Real World
Recall that we shorted SPX at the 1597 high on the 11th [see: Big Picture], riding down to the channel bottom where I went long at 1554, expecting at least a bounce. We got one on the 16th with SPX rallying up to 1575 -- the channel .25 line.
We closed our long position, going short the following morning for the trip back to the channel bottom at 1555. We tried another long position there, but were quickly stopped out as the channel was broken -- signalling a bearish trend change.
So, we shorted again, playing quite a few bounces down to 1540 where we eventually went long in anticipation of establishing a H&S Pattern neckline [see: Dollar Daze.]
At that point, I expected a back-test of the broken channel. We got it, reaching 1565 on the 22nd but closing beneath the channel's lower bound. Note that this move completed 5/6 of a H&S, but the right shoulder was underdeveloped relative to the left.
Anticipating an intra-day retracement to 1567 (the .500 Fib) or 1574 (the .618) the next day (yesterday), I stayed long -- trying without much success to anticipate the top. Since SPX topped the .618, the next up on the chart is today's target: the .786 at 1584.23.
Going Forward
With all that as preamble, here's what I expect going forward.
Last night, the dollar tagged the .786 Fib retracement of its decline from Apr 4. It subsequently sold off almost to the .618 but, so far, is hanging in a rising wedge.
The EURUSD re-tested the .500 Fib of its rise from Apr 3, and snapped back into its falling wedge and the (purple) channel that's guided prices since then.
The e-minis tacked on a few points overnight -- almost reaching the .786, only to give them all back with this morning's underwhelming Durable Goods report. The Head & Shoulders Pattern that was looking pretty good at yesterday's open is now looking a little iffy, with a right shoulder that's already 15 points higher than the left.
UPDATE: 9:45 AM
SPX continues trudging toward the .786 retracement (1584.23) of its decline from 1597 to 1536.
After plunging beneath the channel that's guided it from 1343 to 1597 on Apr 17, SPX rallied and re-joined the channel yesterday. This was a very bullish development, as long as SPX remained in the channel all the way to the closing bell.
Despite a five minute thrill ride from 1578 to 1563 (the channel bottom) and back, SPX managed to regain and hold the 2007 high of 1576.09 into the close.
It now sits perched on the neckline of an Inverted H&S Pattern which has either completed or not, depending on whether a 5-minute plunge qualifies as a shoulder. Short answer -- I have no clue.
Here's what we do know:
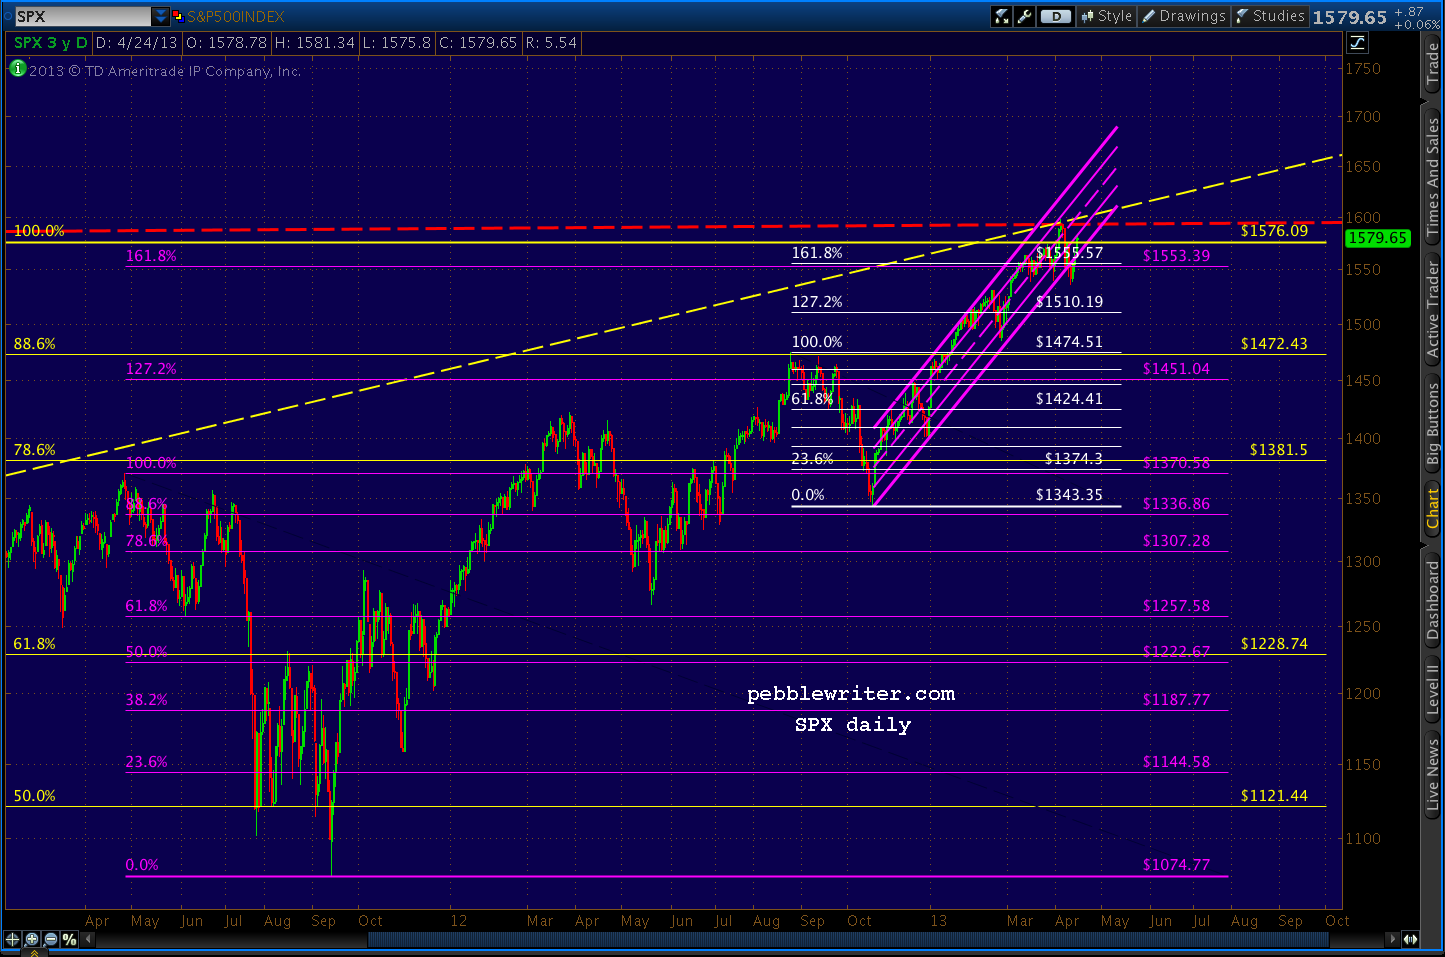
- Prior to Apr 17, SPX had been locked into that purple channel below since 1343 on Nov 16 -- an 18.9% gain in five months
- SPX barely paused when it completed two big Crab Patterns -- the 1.618 extensions of the 1370-1074 decline and the 1474-1343 decline (purple and white below)
- Instead, SPX exceeded the Oct 2007 high of 1576.09 (yellow)
- SPX reversed at 1597.35, almost precisely at a trend line drawn between the 2000 and 2007 highs
- SPX fell 3.8%, making a lower low, dropping out of the channel mentioned above and suggesting a H&S pattern that targets 1474 -- the Sep 2012 high (white pattern)
- It roared back into the channel, retracing almost 78.6% of its drop
- In the process, it topped the 1576.09 high and the 1553 and 1555 Fib levels and almost reaching the 1583 target of an IH&S Pattern
- Depending on your interpretation, it might also have completed an IH&S that targets 1621.
What Does It All Mean?
When I forecast markets, I look for lines in the sand. I try to determine price levels that, if crossed, would signal a change in trend. When that trend switches from bullish to bearish, I want to be short. When it switches from bearish to bullish, I want to be long.
A channel is one such method that features boundaries rather than absolute price levels.
As long as prices remain in a rising (or falling) channel, we can expect prices to continue to rise (or fall.) It's rather simplistic, but it usually works. We can make educated guesses as to future price targets based on where the channels point.
Of course, even well-formed channels (multiple tags on the top and bottom and over a sufficient time period) can't go on forever. I look for moments when prices must choose whether to remain in or leave the channel. A tag of a top or bottom bound or midline usually create opportunities, though other lines can as well.
The Real World
Recall that we shorted SPX at the 1597 high on the 11th [see: Big Picture], riding down to the channel bottom where I went long at 1554, expecting at least a bounce. We got one on the 16th with SPX rallying up to 1575 -- the channel .25 line.
We closed our long position, going short the following morning for the trip back to the channel bottom at 1555. We tried another long position there, but were quickly stopped out as the channel was broken -- signalling a bearish trend change.
So, we shorted again, playing quite a few bounces down to 1540 where we eventually went long in anticipation of establishing a H&S Pattern neckline [see: Dollar Daze.]
At that point, I expected a back-test of the broken channel. We got it, reaching 1565 on the 22nd but closing beneath the channel's lower bound. Note that this move completed 5/6 of a H&S, but the right shoulder was underdeveloped relative to the left.
Anticipating an intra-day retracement to 1567 (the .500 Fib) or 1574 (the .618) the next day (yesterday), I stayed long -- trying without much success to anticipate the top. Since SPX topped the .618, the next up on the chart is today's target: the .786 at 1584.23.
Going Forward
With all that as preamble, here's what I expect going forward.
...continued on pebblewriter.com...

