The best laid plans of mice and men
Go often awry,
And leave us nothing but grief and pain,
For promised joy!
Go often awry,
And leave us nothing but grief and pain,
For promised joy!
Robert Burns, 1785
ORIGINAL POST: 6:45 AM EDT
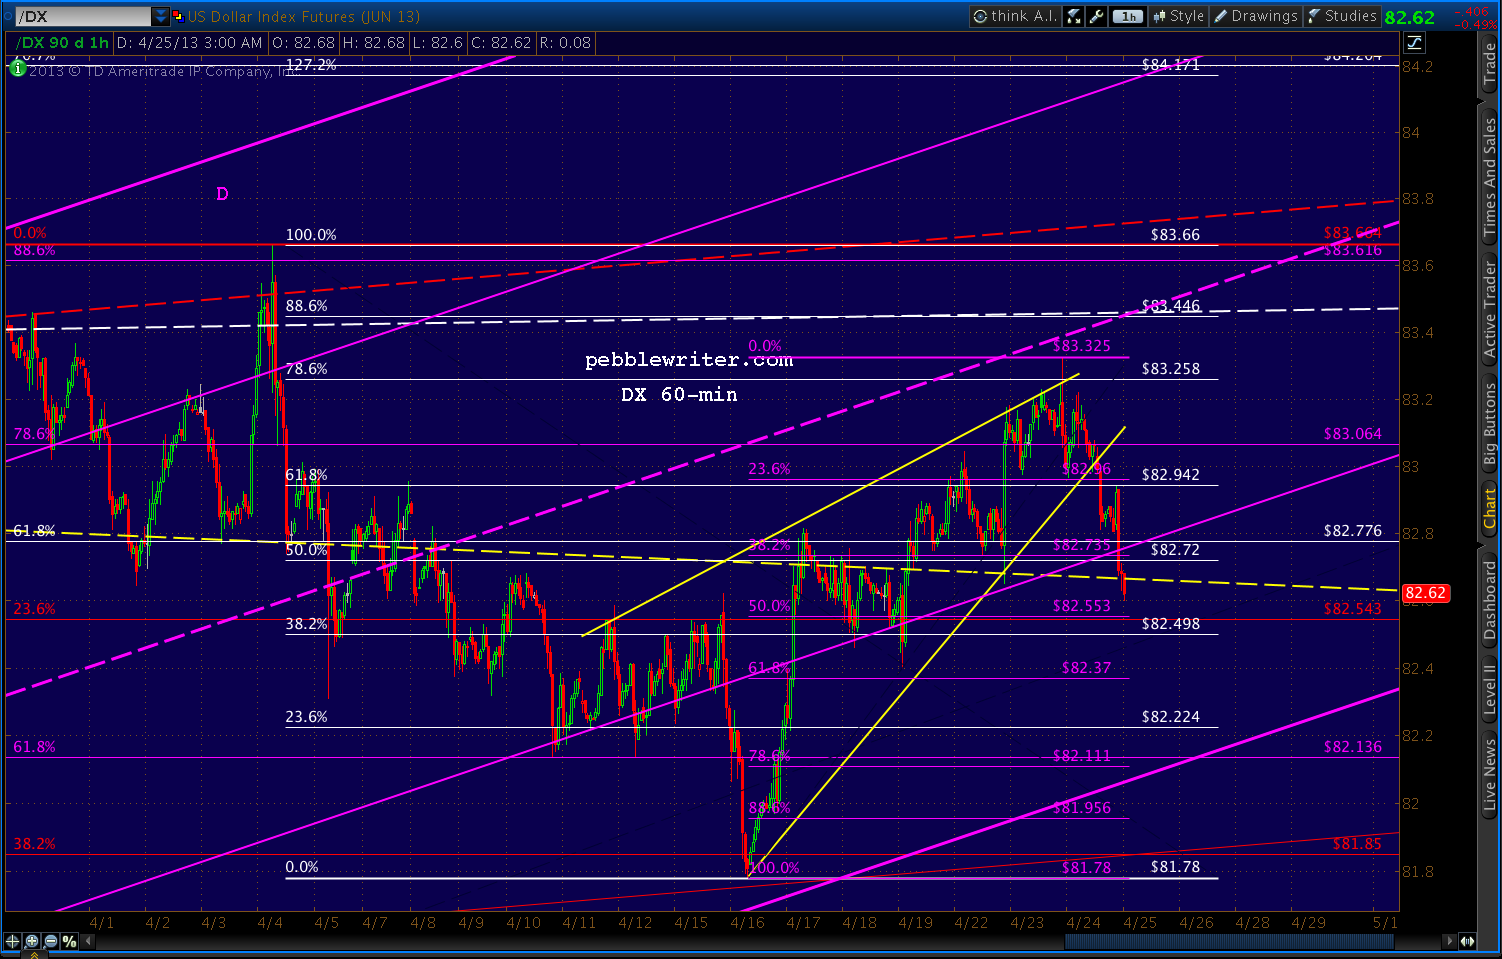
The wedges we've been watching on DX and EURUSD are playing out. EURUSD has broken out...
...and DX has broken down.
But, it's the USDJPY that I'm watching especially closely this morning. It still hasn't broken 100 since our Apr 8 observation [USDJPY update] that it was running out of steam:
"...there is growing risk of a downturn as it approaches 100... it appears the pair might have hit at least interim resistance at today’s high."It topped out 3 sessions later at 99.94, and two weeks later is in danger of a larger pullback.
Remember, weakening the yen was a critical element of the BOJ's stimulus program that was supposed to generate inflation, boost Toyota sales and send Japanese investment funds flooding into foreign markets.
Instead, Japanese investors are repatriating their funds from abroad -- a net Y9.5 trillion ($95 billion) since the first of the year. Why? As any US investor could tell you, QE might not inflate economies, but it sure as hell inflates markets.
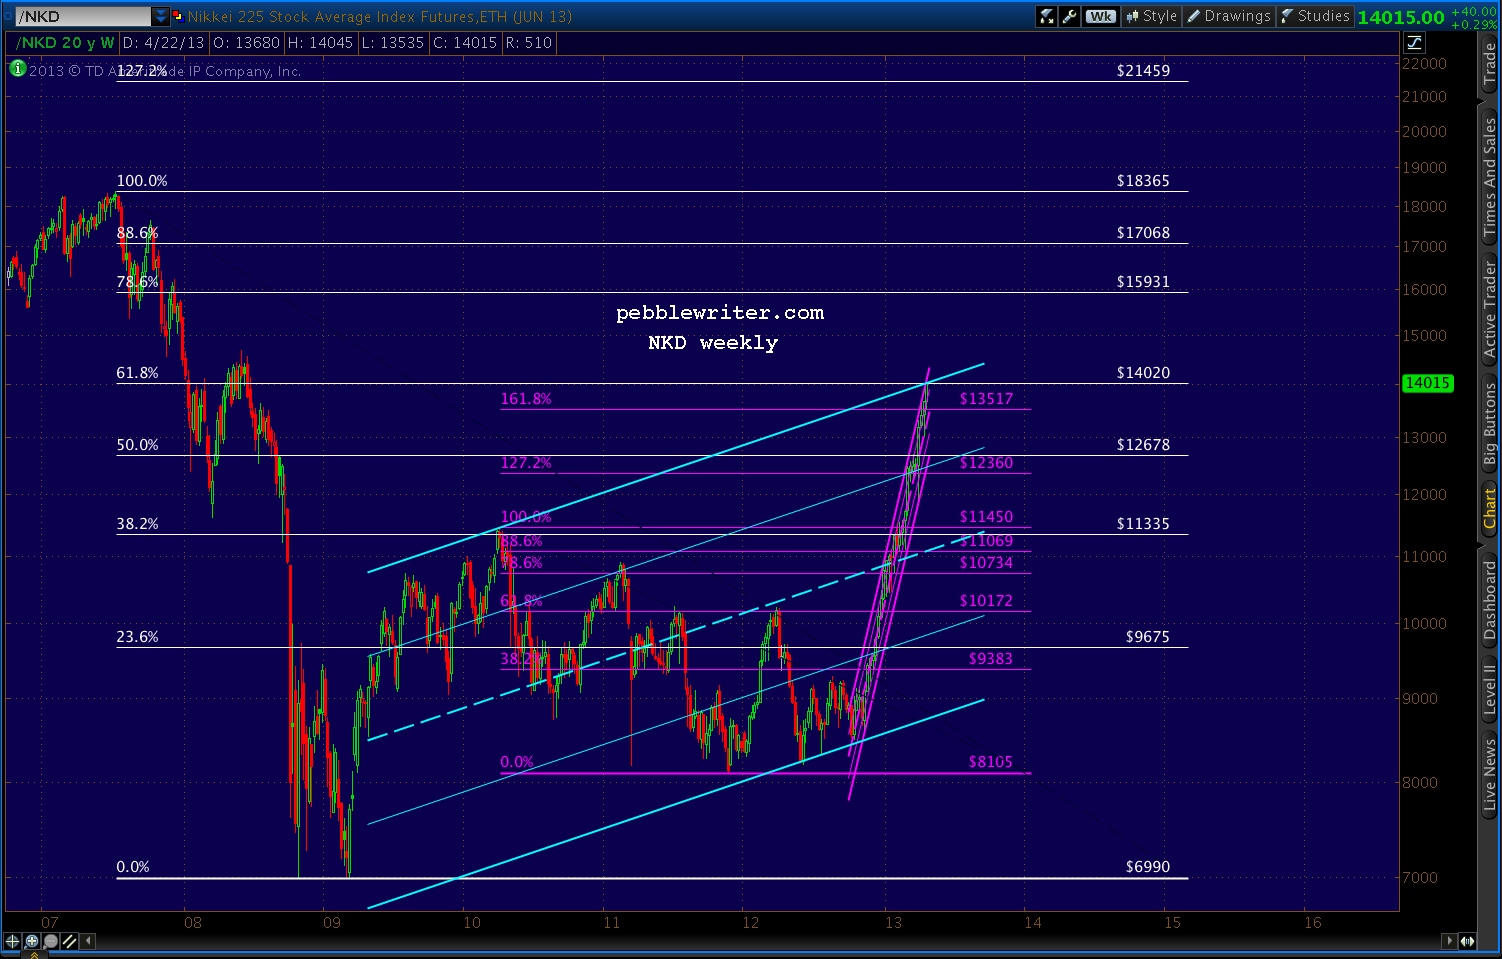
The Nikkei 225 is up 65% since last October's lows....
...and, still hasn't even recovered 2/3 of its losses from the 2007 crash. The Dow and the S&P 500, by contrast, have recovered all of them -- and, then some. So, to many, the Nikkei still seems the better value. It's hard to argue with success.
But, I'll do it anyway. In reaching 14,020 a few hours ago, NKD tagged the .618 Fibonacci retracement of its 2007-2009 crash from 18,365 to 6990.
To those not familiar with harmonics, this tends to be a big deal. When SPX reached the equivalent point in April 2010, it plunged 17%. The DJIA fell almost 15%. The USD, represented by DX, soared 9.3%.
But, the yen positively soared. USDJPY started a 17-month slide that took the pair down 20% from 94.98 to 75.78. NKD, which had just reached its .382 Fib, shed 23% over the next 4 months, eventually reaching almost 30% in Nov 2011.
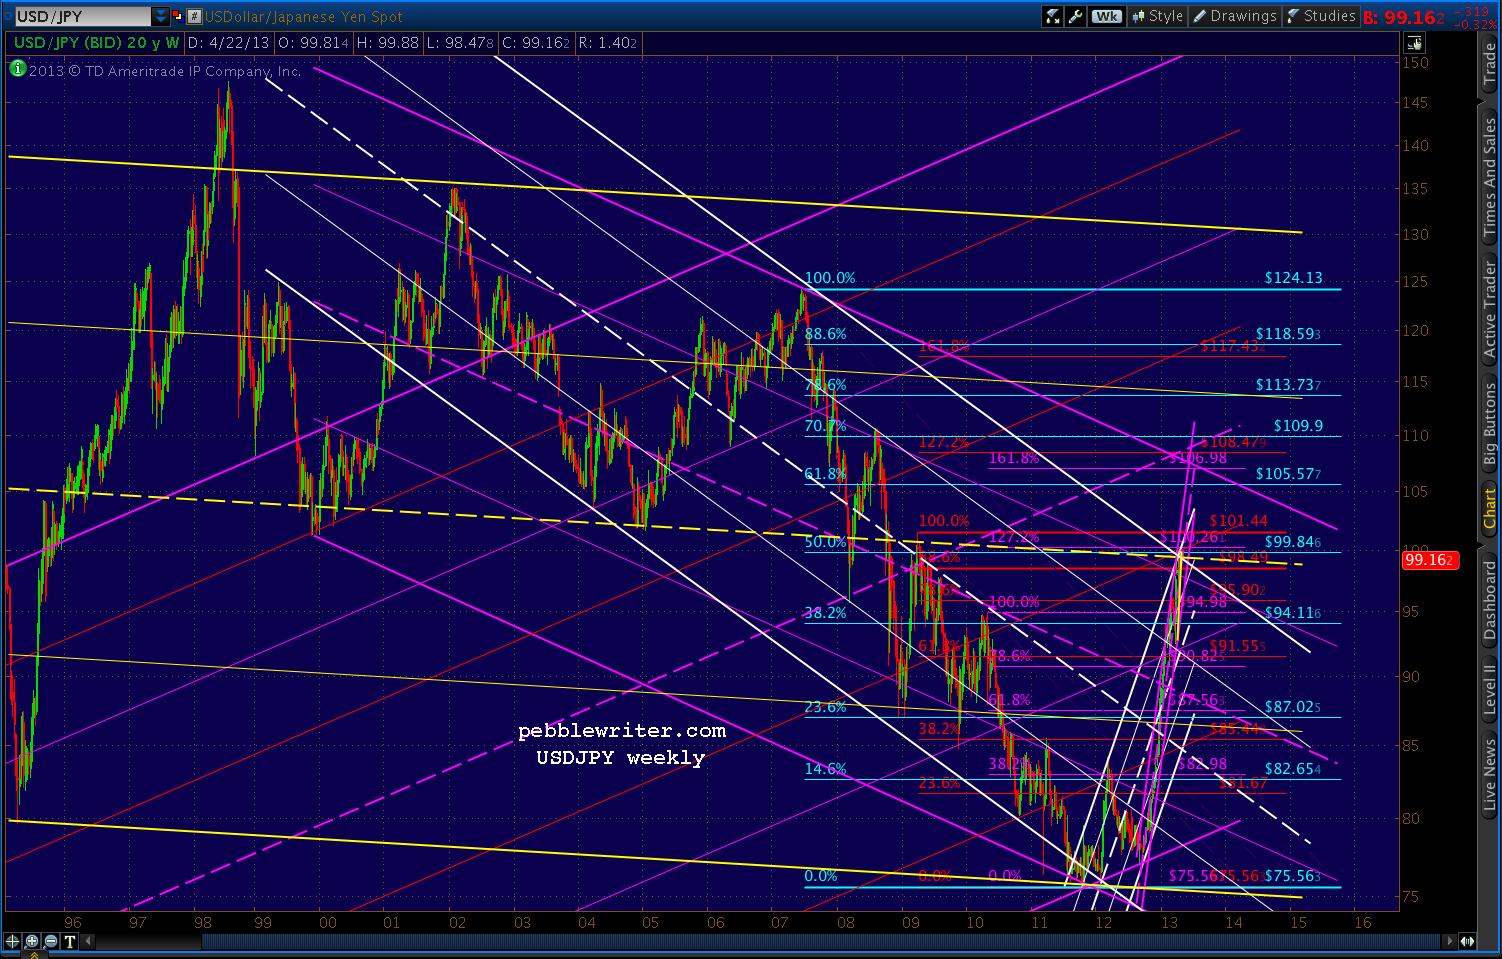
Could the USDJPY's failure to break 100 be telling us something? You better believe it. I called a top a few weeks ago because the pair had reached several important Fib levels as well as the midline of an important channel (in yellow, below)...
...that dates back to 1995.
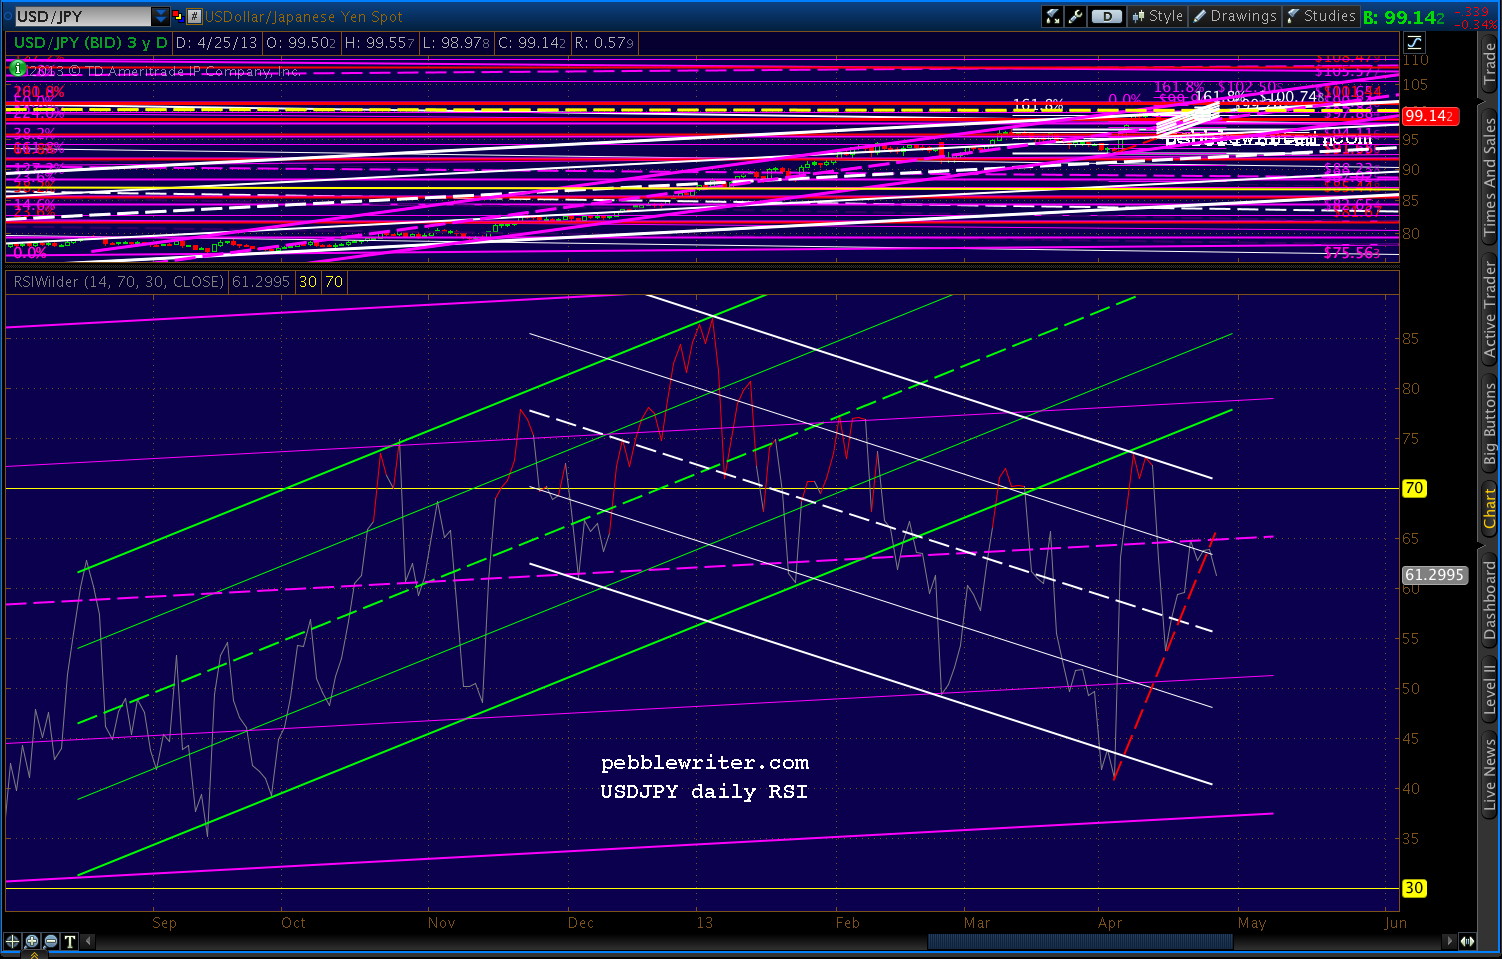
There's no guarantee it won't push through instead of retreating, but the RSI picture supports the danger of a significant retreat.
Daily RSI has backtested the broken yellow channel twice, but the trend is clearly down -- with the latest push being rebuffed by the purple midline.
And, a close-up reveals that a breakdown has already started.


