PEBBLEWRITER.COM IS LIVE!


*************** PEBBLEWRITER.COM IS LIVE! TO SIGN UP, CLICK HERE ***************


Showing posts with label gartley bat butterfly crab pattern technical analysis. Show all posts

Wednesday, June 26, 2013

Update on Gold: Jun 26, 2013

reposted from pebblewriter.com~

It's been over a month since I last focused on gold.  The equities markets have kept me working overtime, and I assumed our May 15 forecast had long since jumped the tracks.

At the time, gold had plunged 270 to 1321 per ounce in only 4 sessions, bounced at 1321 (the day after our bottom call) to within 13 of our upside target, and was returning for a second bounce -- or not.   From that post [Update on Gold: May 15, 2013]:
Now, at 1373, it has reached a critical juncture that should result in either a sharp rally to 1560 or a plunge to 1141 in the coming month or so.
GC was closing in on the .786 retracement of the the rise off the 1321 bottom.  Playing the bounce was a low risk trade as long as one used trailing stops.
Long positions could be played from the .786 (1357) or .886 (1340) as long as stops are watched very carefully and updated frequently.
 The downside case is probably stronger.  If the current plunge continues past 1321, there are only a few key levels of support before things get really nasty:
  • horizontal support at 1302-1309
  • potential Fib targets of 1276 (the 1.272) or 1219 (1.618)
  • Fib support at 1141-1157
  • Fib support at 947
The bounce came a few days later at the .886 (1336) and despite gaining 84, couldn't clear the big white channel midline, much less the smaller red channel (white in previous charts) it had been in since last September.

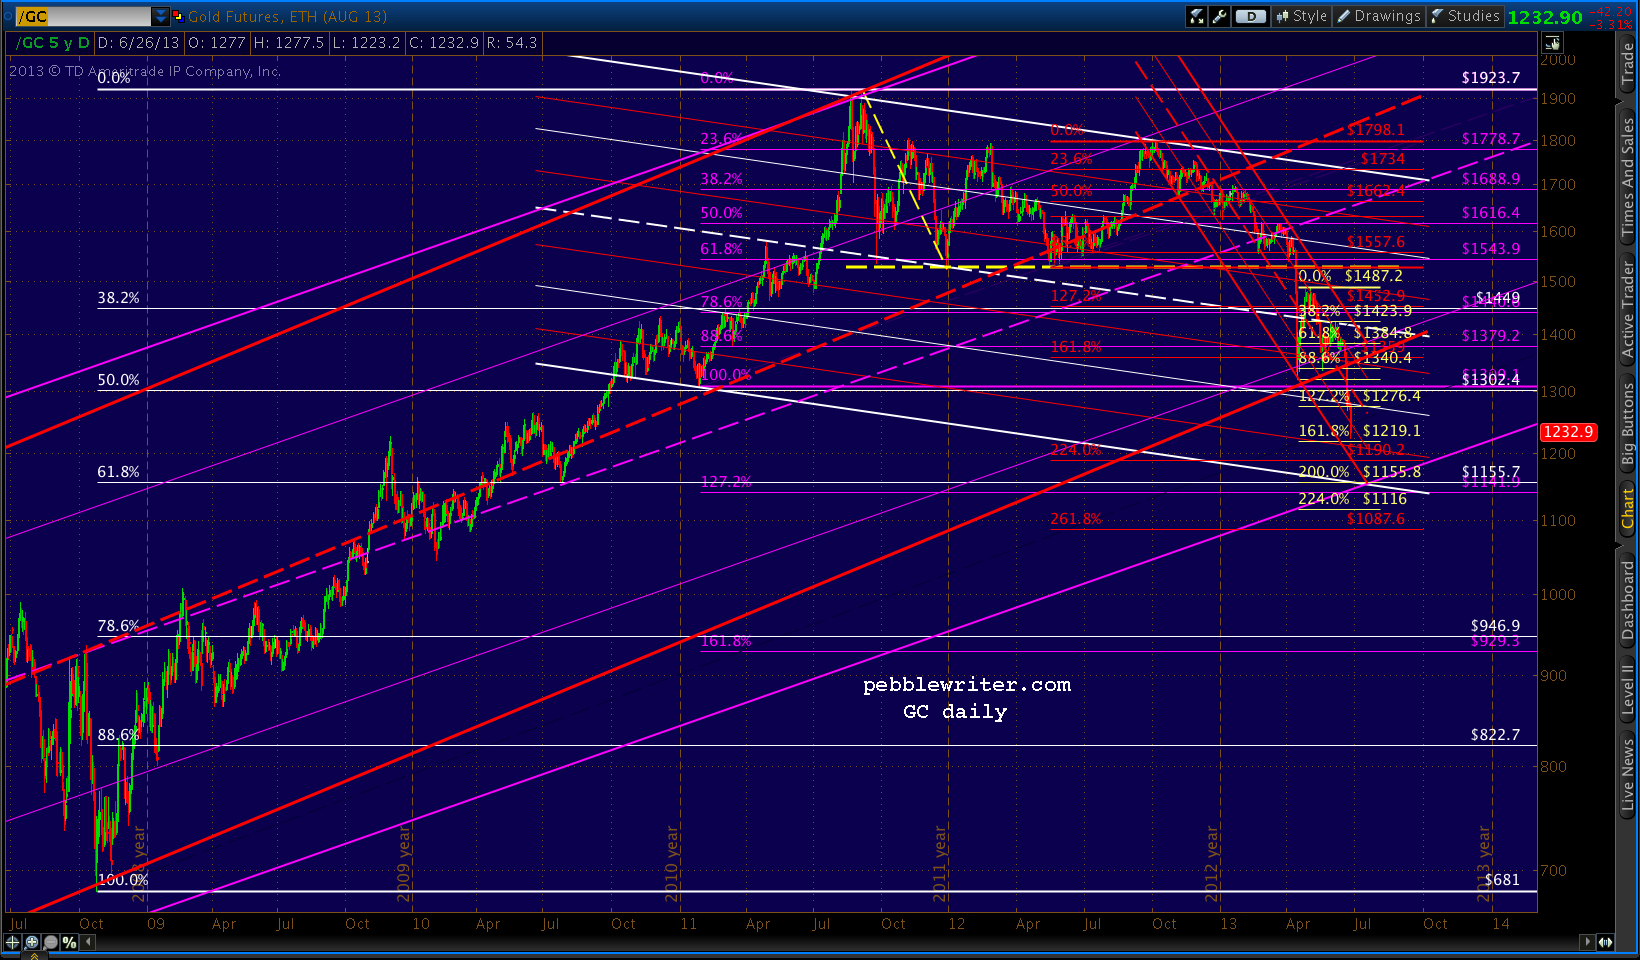
When the big red channel from 1999 broke down on Jun 20, GC plunged again.  It failed to catch a bid at the first support level, but is approaching the second one this morning: the yellow 1.618 that completes the Crab Pattern at 1219.10.


This seems like an opportune time to update the forecast, as gold's price action continues to provide valuable clues as to investors' expectations about QE, the value of the dollar and inflation.  Are the many calls for gold to fall below $1000 per ounce well-founded?

Probably not.  We should get a decent bounce beginning at or near 1219 today that could take prices as high as 1320 or so by July 5-8.  A continued rally through the red midline would mean additional gains to 1357-1385 by mid-July.

But, there's a better chance of a plunge to 1155 instead -- and it need not respect the Crab Pattern about to complete, especially if today's equity rally falters (gold certainly isn't buying the More QE! snake oil.)

Remember that 1155 is the .618 retracement (in white below) of the huge rally from 681 in 2008 to last September's 1923 all-time high. Around July 15, the bottom of the big white channel and the bottom of the red channel intersect there with the bottom of the big purple channel (it replaced the red one that failed on Jun 20.)

This is the same price target we identified in our April 15 Update on Gold.


We can speculate about what circumstances might provide for a floor.  The prevailing wisdom these days is yet another round of QE -- or at least inflation of some variety. With interest rates on the rise, that seems likely enough.  We'll stick a pin in the idea of a mid-July market calamity that necessitates Fed intervention.

...continued on pebblewriter.com...

Monday, April 15, 2013

Gold Melting Down

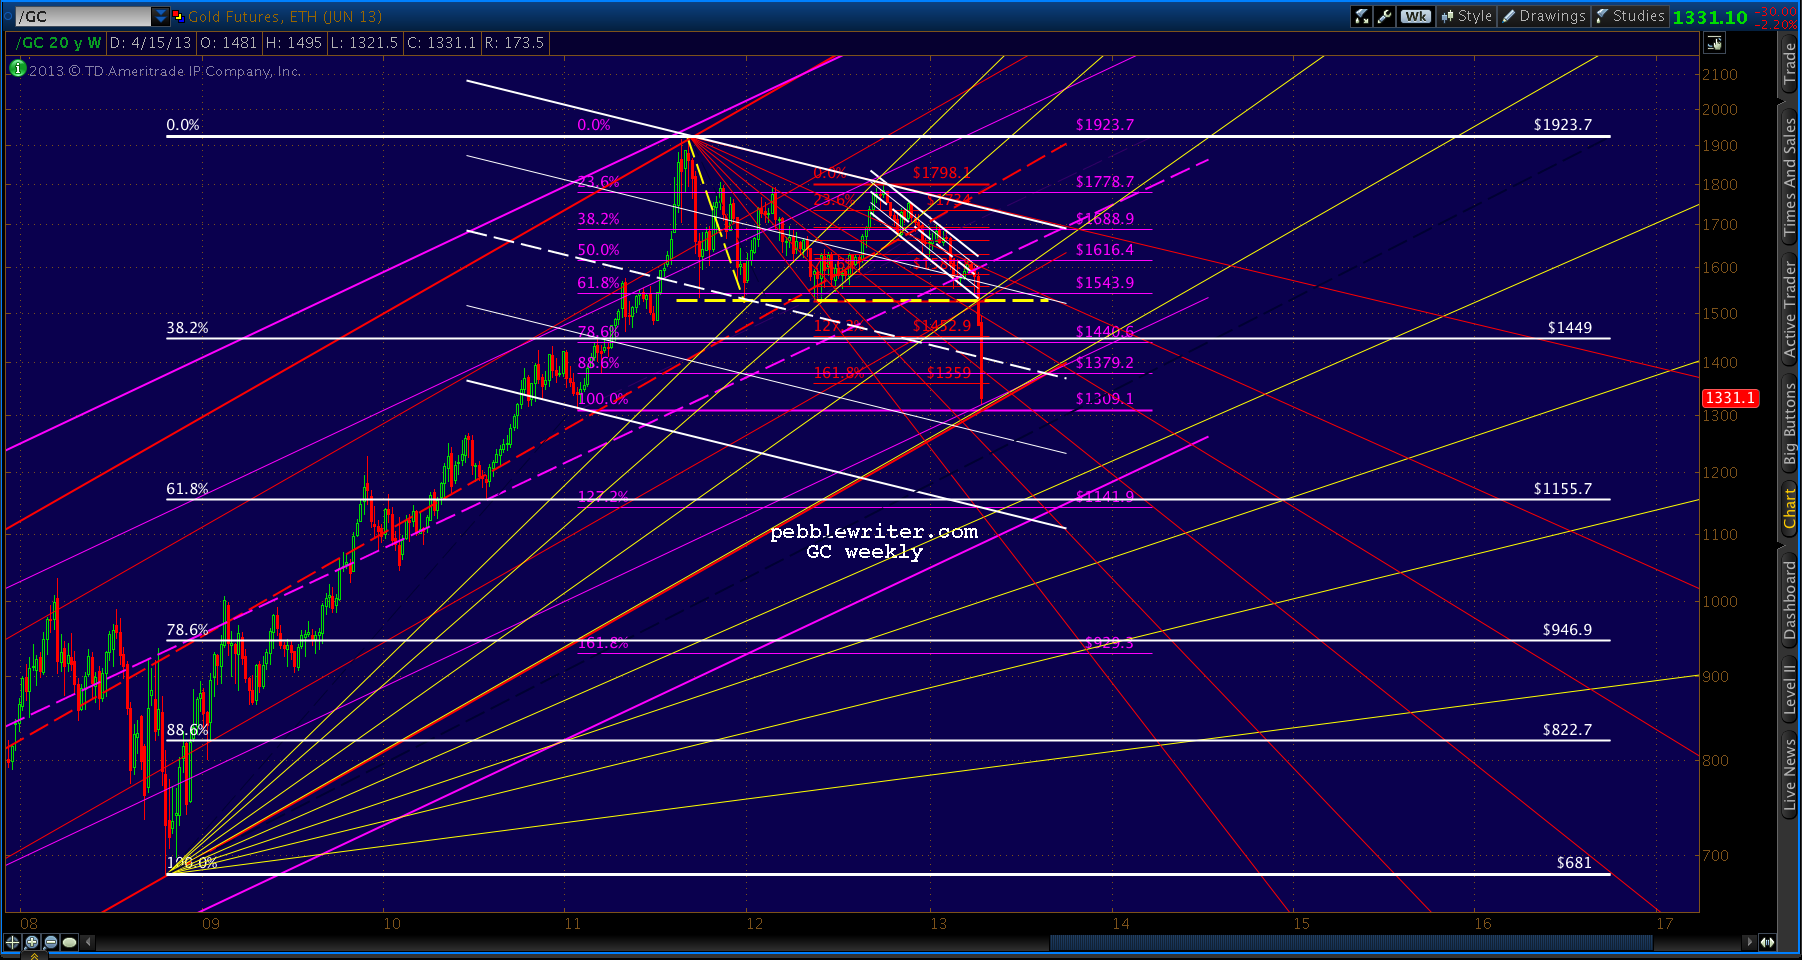
Gold continued to melt down today, shedding another $126 and continuing the plunge that started on Friday with the critical loss of the LT channel we discussed last week, the horizontal support at 1520-1535, and the psychologically important 1500 level.


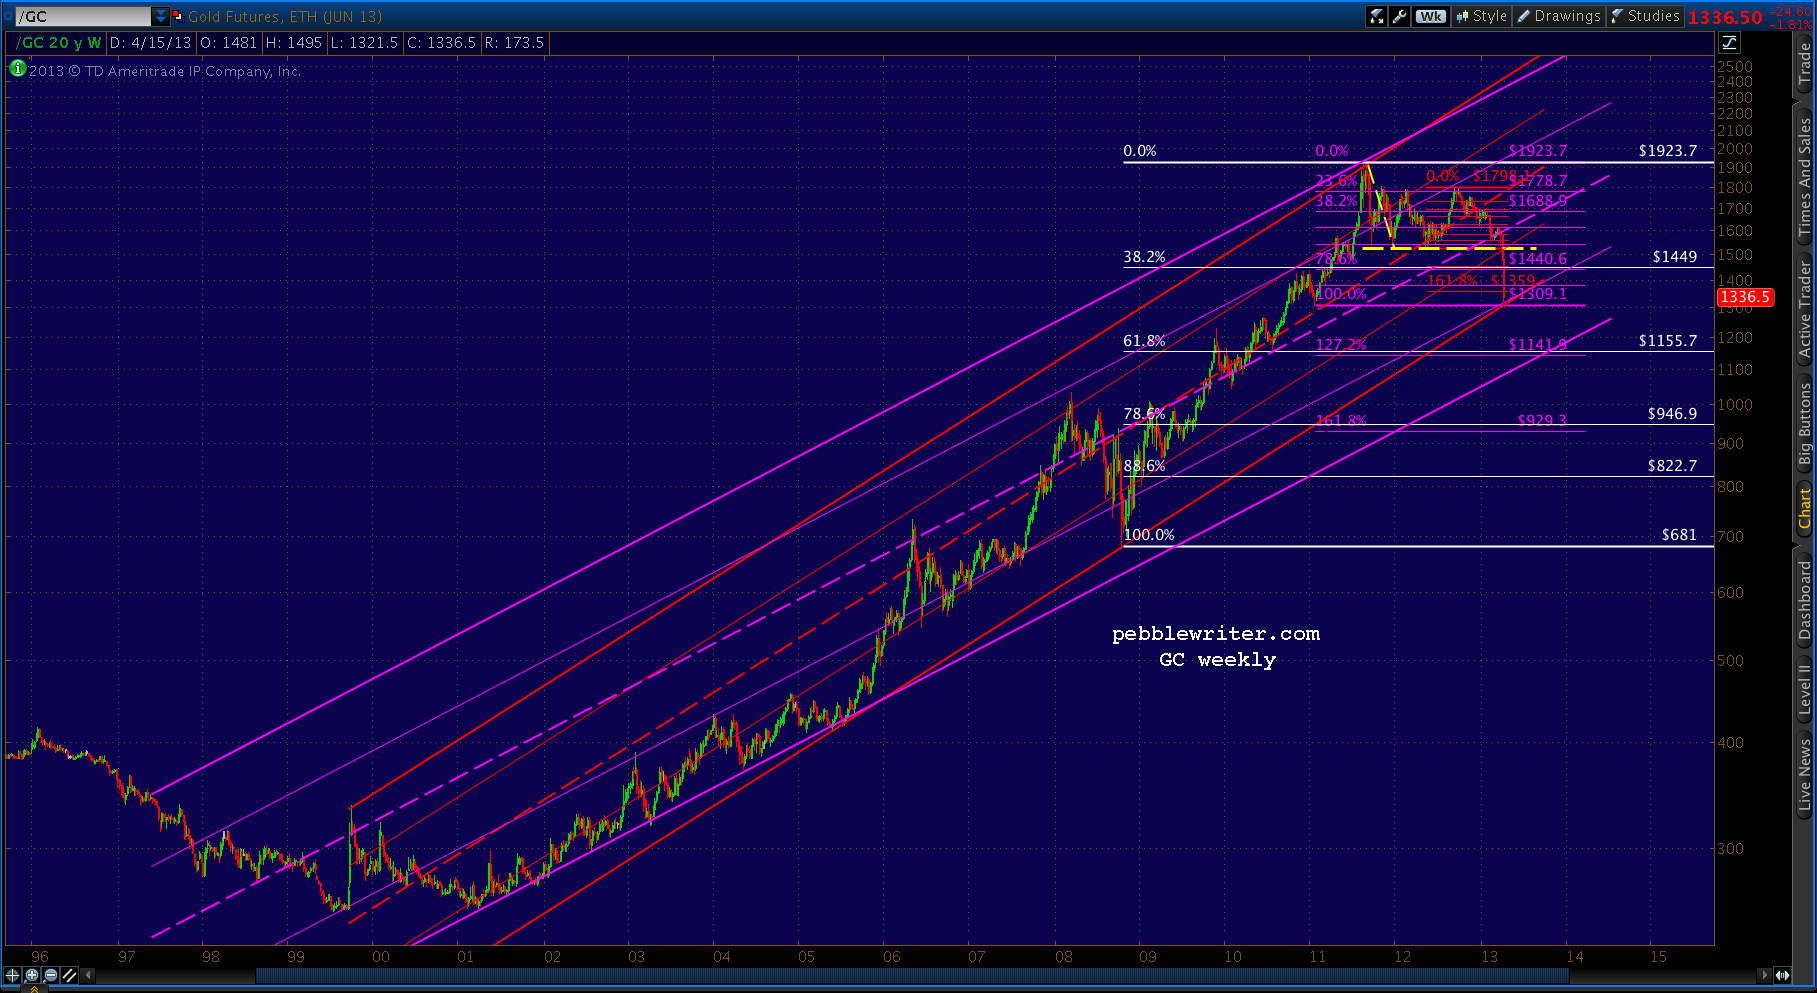
Gold had a nice bounce from 1539 to 1590 after reaching the bottom of the channel and the horizontal support of several prior bounces on Apr 4.  In a dramatic demonstration of what can happen when channel support is lost, it has since shed almost $270/oz.

The red channel below represents my best shot at the new operative channel.  It supports the idea of a bounce at the Jan 2011 low of 1309 -- 3rd on our list of potential bounce spots during today's onslaught.
The next best available channel is well below the current one, but supports the idea of a bounce at 1379 or 1359 -- the Bat Pattern and Crab Pattern completions shown in the first chart above.  If those levels should fail to hold, the next major support levels are 1309 and 1155.
We got good bounces earlier today at the first two: the Fib retracements at 1359 and 1379  But, along came the CME with announcements of increased margins and that was the end of that.


Please note, I am not a gold bug.  I don't advocate the purchase of gold. I shy away from most assets that increase exponentially in price -- especially those backed with the kind of religious fervor as is gold.  They can drop with just as much enthusiasm.

The time may come when inflation is taking hold and it makes sense to switch everything you own into the metal... but, we're not there yet.  It's a crowded trade, and IMO, today's price action underscores the risk.

So, the following is offered in the same spirit as my picks for NCAA champion, Best Picture, and  Westminster Best in Show (the affenpinscher, really!?)

There's another channel (below, in purple) that kinda sorta supports the first, but shows the potential downside in the event that 1300 can't handle the pressure.


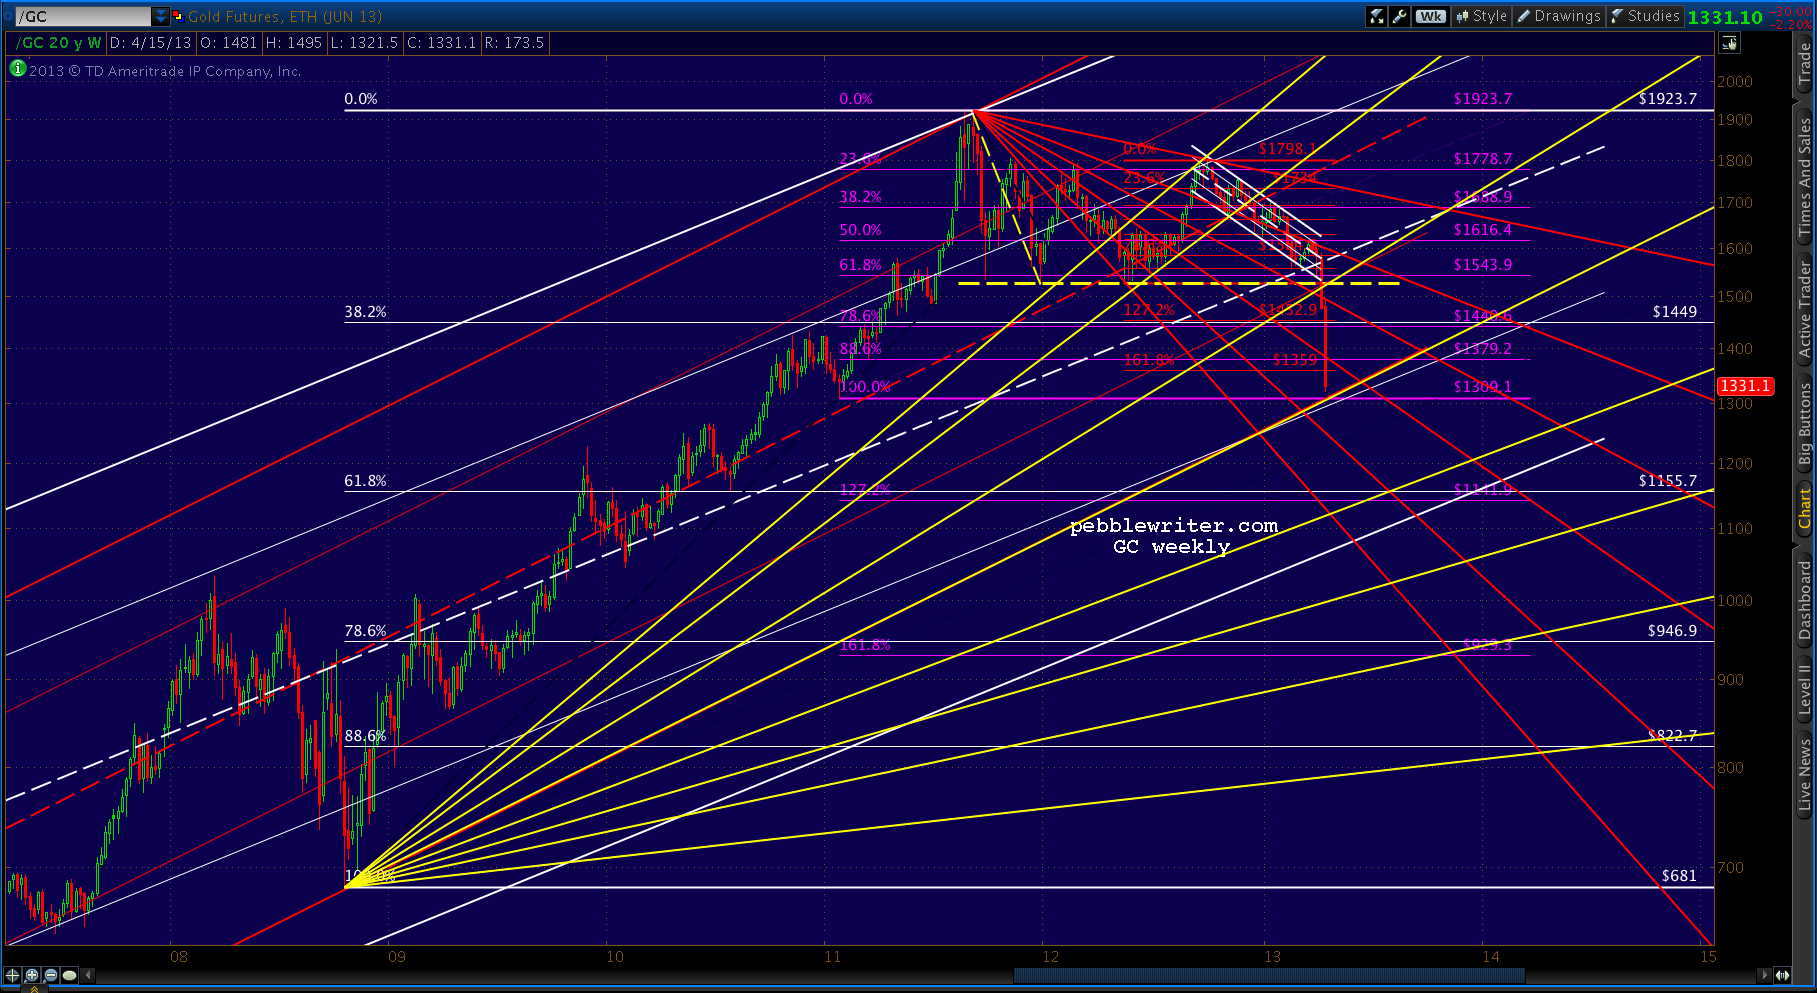
It's speculative, for sure.  But, I like the fact that it crosses the white .618 at a key point in time, so I'll leave it up for now.What's interesting to me is the Fibonacci Fans that can be drawn on this chart.  The ones from 681 low (yellow) have done a pretty decent job of guiding the bounces on the way down.


And, the ones from the 1923 high (red) have done well at halting several attempts at a breakout.


I could almost believe we've seen the worst of the drop, but I wonder about this potential channel...


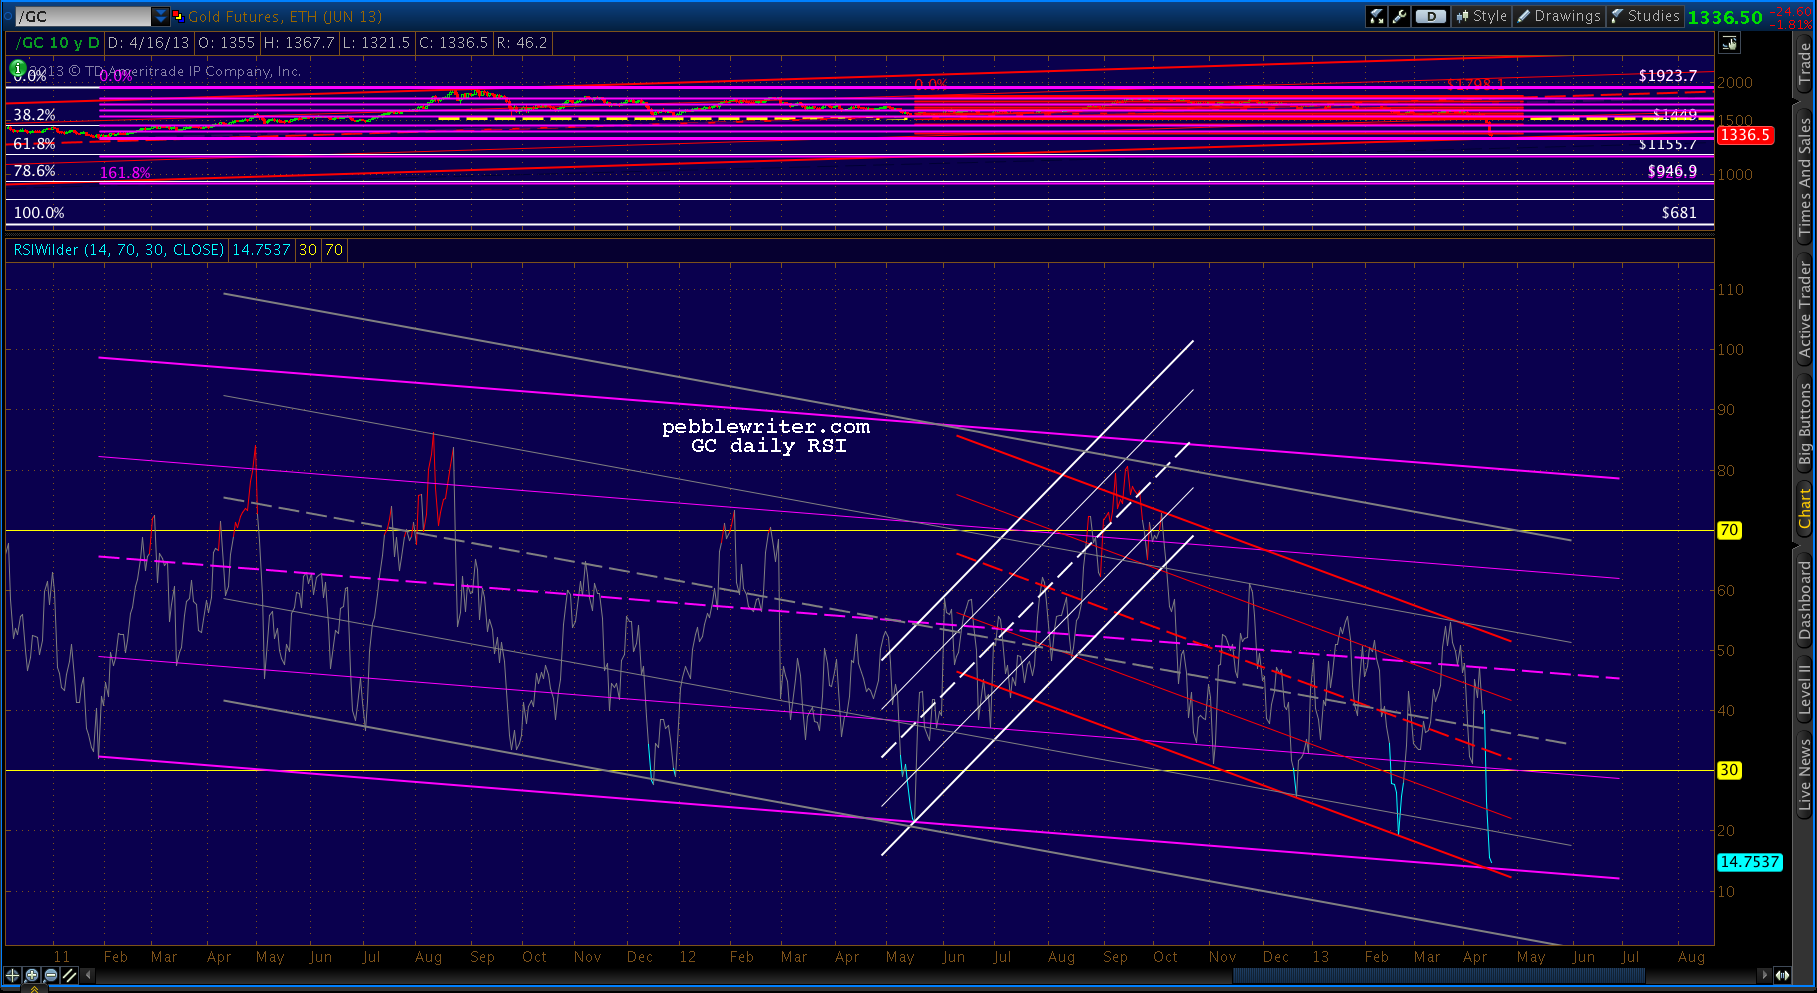
...and, the daily RSI -- which suggests at least a little more potential downside any way you slice it.  The bottom of the purple and red channels probably correlates to 1309, while the bottom of the gray channel represents something much more ominous.


So, where do we go from here?

continued on pebblewriter.com...
Tuesday, August 7, 2012

Gartley Patterns

The Gartley Pattern offers early warning of potentially significant reversals in price trends.  Like all Harmonic patterns, it is formed by a series of specific Fibonacci reversals of price moves.  It is thought to be successful about 70% of the time -- much better than house odds.  Combined with solid technical analysis and sound trade management technique, it can provide significant returns with limited risk.

It's a rare week that I can't find a decent looking Gartley Pattern setting up.  On November 7, 2011, I saw one forming on SPX and posted about it here.  With SPX at 1261, the Gartley indicated prices would rise to 1276.13 and reverse.  Here's the chart I posted that afternoon; the purple line shows the forecast move.


The following morning, SPX opened at 1261.12, raced up to 1277.55 and closed at 1275.92.  The next day saw a 50-point reversal.  Each $1 invested in at-the-money SPY puts on the afternoon of the 8th was worth $3 the next day on the 9th.  Pretty cool, huh?

Let's take a look at how Gartley Patterns work, using the actual prices from October 27 - November 9, 2011.  I'll use the daily chart from that period to illustrate.


A Gartley begins with a significant directional move.  The origin is labelled X, and the terminus is labelled A.  The size and timing of the original move isn't crucial; I've played some Gartley's that spanned years and others that spanned an hour.

The reversal at Point A establishes the low of the pattern and our first leg, known as XA.  Next comes a move back towards the origin price -- aka a retracement.  In a Gartley Pattern, a retracement always occurs at the Fibonacci 61.8% of the XA leg -- meaning simply that we have recovered 61.8% of the initial price drop.

Note, Point B can be off a little, but a very big miss means it's probably going to be some other kind of pattern -- or none at all.   Here, our Point B came in very, very close to the .618 level: 1263.21 versus the ideal 1263.15.  At this point, we start to wonder if we have a potential Gartley on our hands.

The ideal BC leg will typically range from 23.6 to 88.6% of the AB leg -- although this is the least critical measurement of the entire pattern.  I've seen Gartley's successfully play out with tiny little BC legs, and others that retraced almost the entire AB leg.  Here, we saw a 31.5% retracement.  It's not a Fibonacci number but, again, it's just not that important as long as it looks like a significant reversal.

The next phase of the pattern -- the CD leg -- is the most exciting.  We know, as we pass our previous Point B at the 61.8% level, that the 78.6% level waits up above.  Knowing a reversal is coming, especially when everyone else is getting more and more bullish, is both scary and exciting.

In this case, the ideal Point D was 1276.13.  Again, this represents a 78.6% retracement of the initial price drop from X to A.  We surpassed it just a little, hitting 1277.55.   A little overrun isn't unusual, especially -- as happened here after a 16-point gain -- the market has a head of steam on it.

The next phase is the fun part.  After reaching Point D, a typical Harmonic Pattern reversal is 61.8% of the AD distance.  In this case, that would have been a 39-point drop.  Instead, we had a 81.9% drop the next day for a whopping 50-points (3.9%).   At times, reversals can go beyond Point A for a 1.272, 1.618, etc. extension of the AD distance.  In fact, over the following 11 sessions, SPX fell an additional 64 points for a nearly 200% extension -- a remarkable 5:1 return for those at-the-money puts.

As mentioned earlier, Gartley's don't always work.  So, it's prudent to plan your trades carefully.  Many traders, for instance, will jump in just before a target is hit and place a stop just on the other side of their target.  I have several rules that I typically follow to limit my risk when putting on such a trade. I also look for corroboration from other chart pattern and technical analysis.

The Gartley is just one of several Harmonic patterns I watch for.  Some, such as the Butterfly and the Crab, can result in much larger reversals.  More on each in the coming weeks.

 * * * * * * * * *

On the new pebblewriter.com, I discuss a variety of harmonic patterns -- using actual examples from the past few months.  For a few dollars a day, members are alerted to patterns I see setting up on various indices; often, they are able to anticipate reversals and position themselves for profitable trades.

Today, I posted about SPX -- which just completed a Bat Pattern at 1404.64.  Several other indices are very close to completing Gartleys.   The following require only a very small move:

RUT:         0.27%
COMP:     0.61%
NYA:         0.52%
DX:           0.07%

The odds favor broad reversals across all markets in the next day or two.  For detailed charts and discussion, consider becoming a pebblewriter.com member today.