PEBBLEWRITER.COM IS LIVE!


*************** PEBBLEWRITER.COM IS LIVE! TO SIGN UP, CLICK HERE ***************


Tuesday, July 2, 2013

Fireworks Ahead!

NOTE:  Only about half the discounted annual memberships are left.  Many of you have memberships expiring this month.  If you plan on upgrading or extending or haven't completed your order yet, don't forget it's first come-first served. 

The sale will be announced outside the membership tomorrow if any memberships are left at the discounted price.  This will likely be the last sale before the Fund goes live and memberships to the current website will no longer be accepted.  CLICK HERE

Also, I intended to post the May and June performance last night, but ran out of time.  I should get it posted later this afternoon.  Check back HERE.  I have put together a page describing the basic investment philosophy and strategy underlying this site that some might find interesting: HERE


Reposted from pebblewriter.com...

Everything is going according to plan this morning, with all currency pairs approaching their targets from last week.

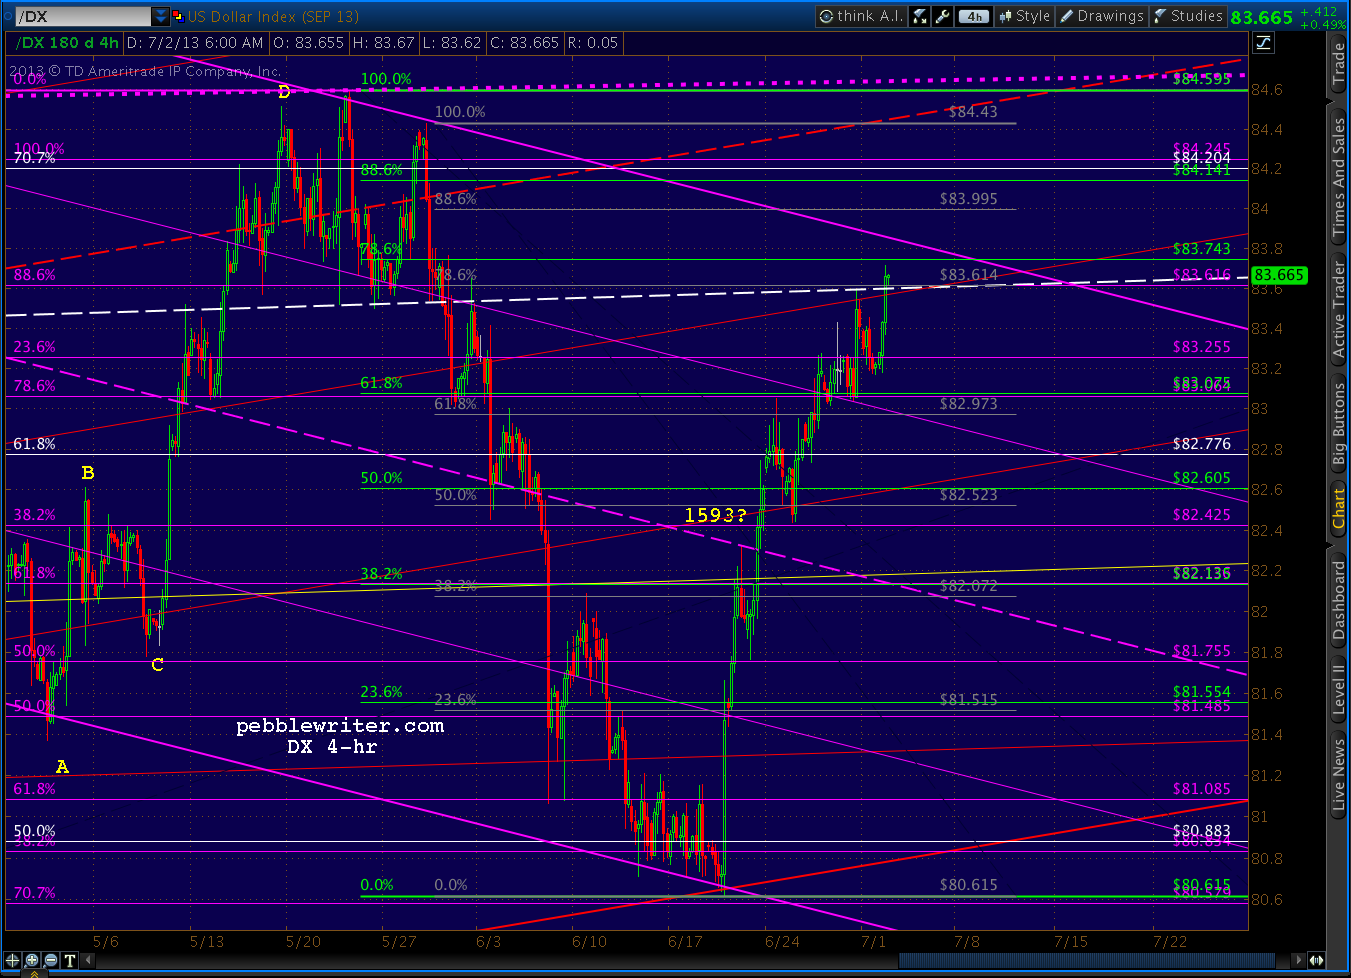
The dollar is back to the white channel midline where exciting things happen.  The last squirt higher led to 84.595 on May 23, the day after SPX topped out at 1687.

This time, however, there's a falling purple channel and the .786 Fib line to consider.
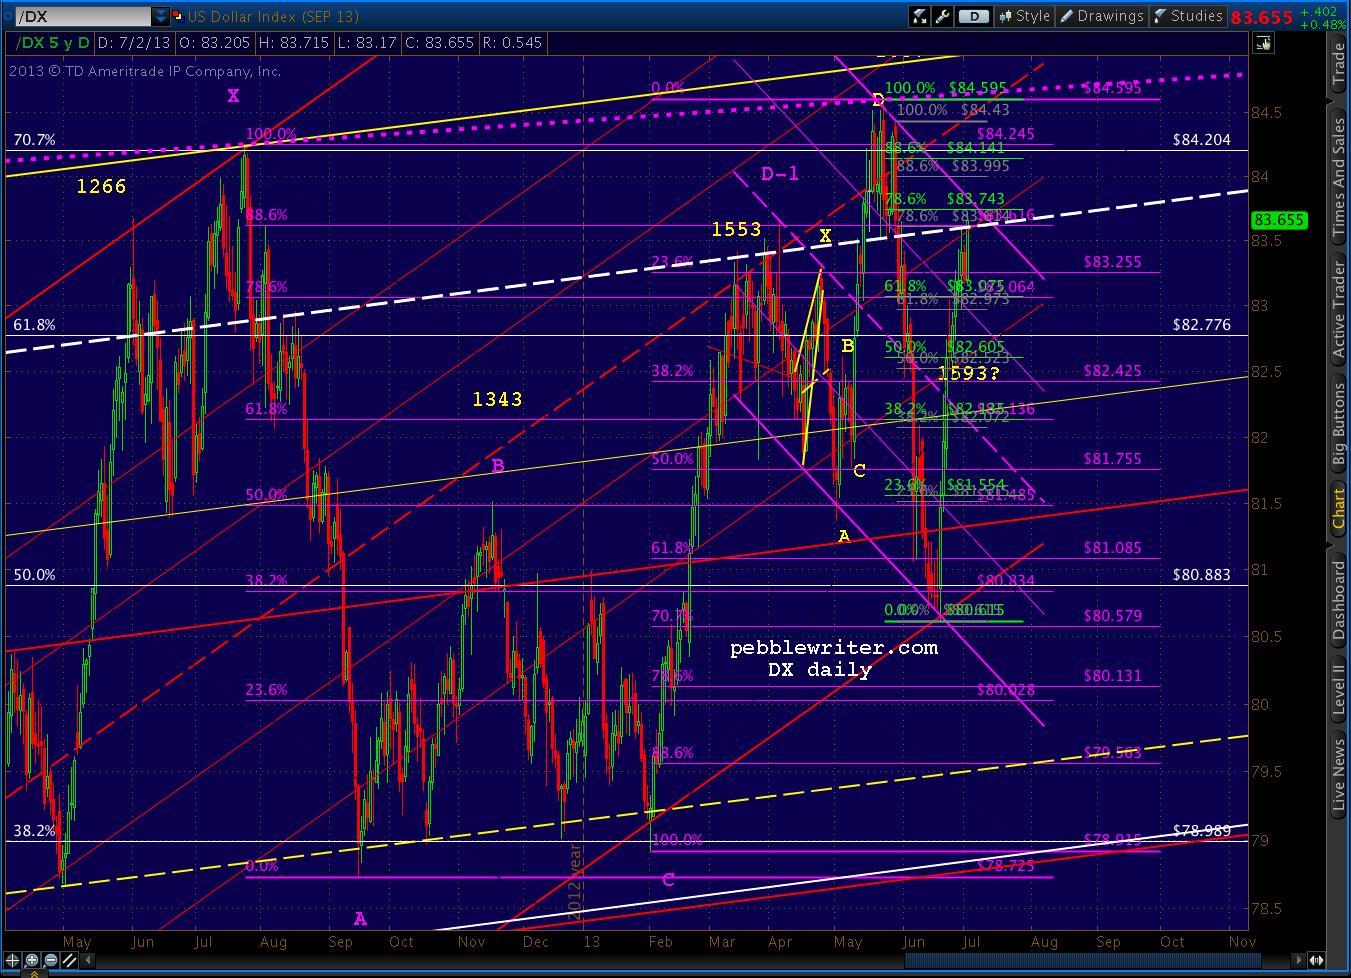


A close up reveals that DX is also pushing up through the red channel .382 line.


While the EURUSD is approaching the .786 retracement of its rally from the 1.2795 low, the red channel midline and the bottom of the light blue channel.


A close up...


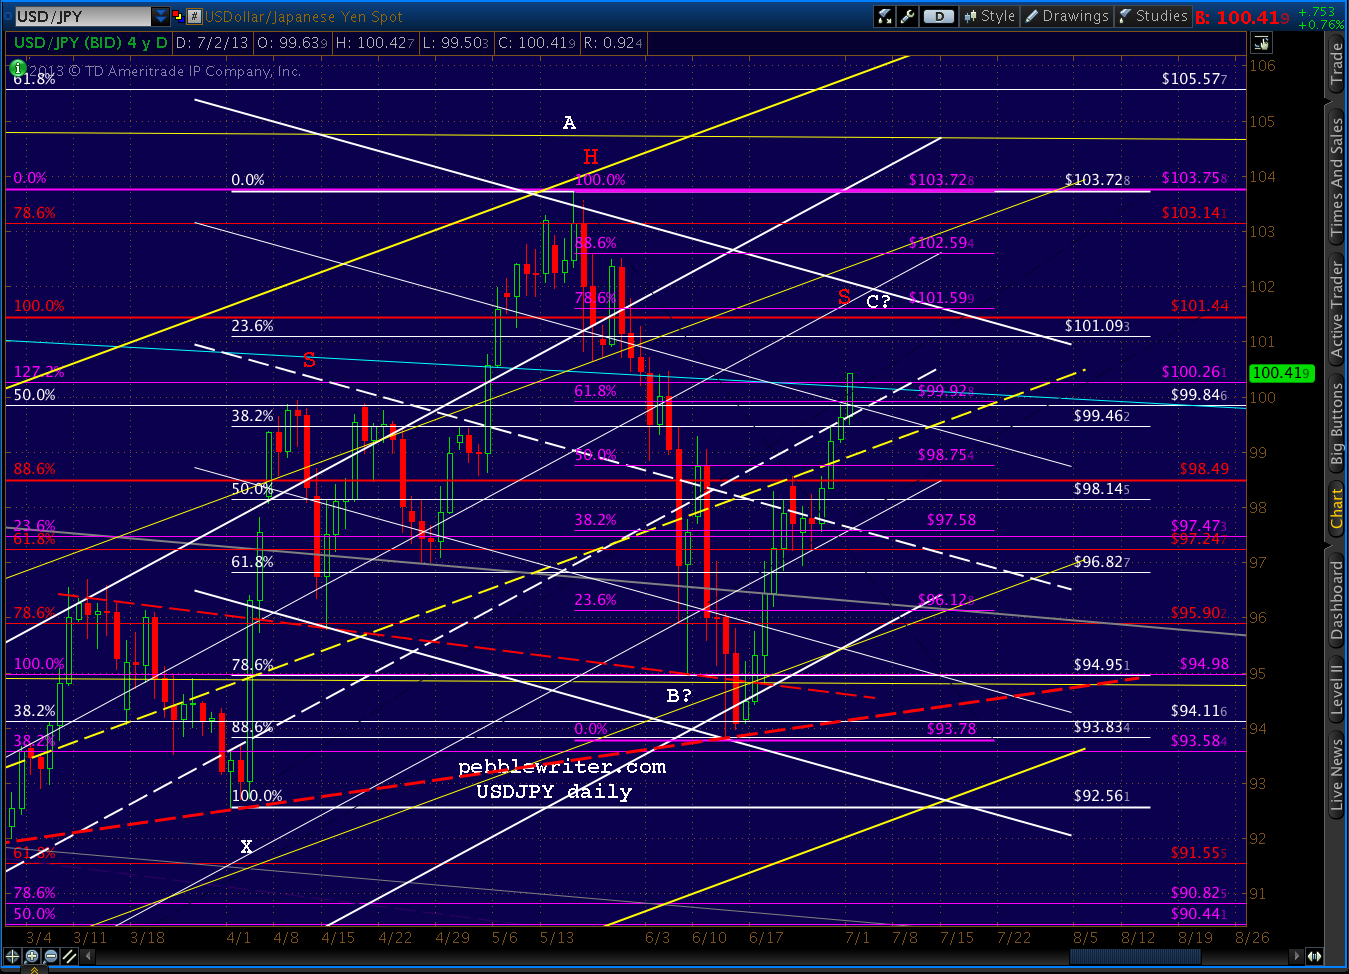
The USDJPY is closing in on our 101.59 target at the .786 Fib.

The e-minis, which back-tested the bottom of their purple channel at the white .500 Fib yesterday, took another run overnight but fell short -- reaching only the top of the falling red channel.


We'll see if SPX has enough juice left to take its own shot.  The first test this morning will be pushing through the top of the red channel -- at least intra-day -- at about 1621.50.

UPDATE:  9:52 AM

SPX reached the red channel and is debating whether to push through or take a breather.
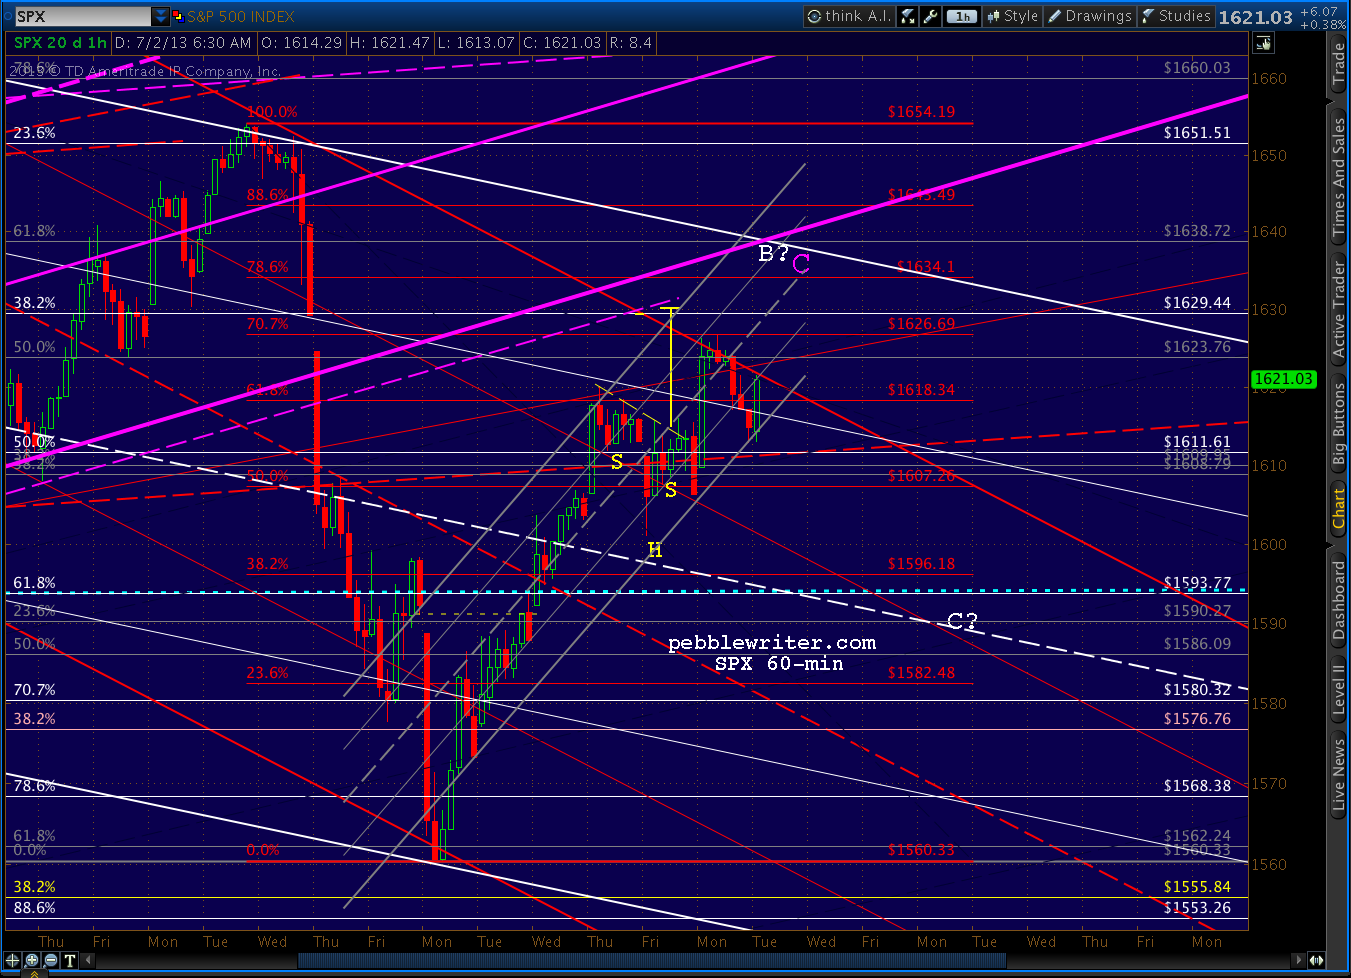

Recall, the cluster of targets we discussed last week includes:
  • the gap fill at 1629.22
  • the IH&S target at 1631.67
  • the red .786 Fib at 1634.10
  • the grey .618 at 1638.72
SPX came within 3 points of filling the gap yesterday, but ran into the same channel top and fell back to close at the bottom of the grey channel in the 5th such stop-clearing exercise in a week and the 9th close at or near the daily low in a fortnight.

It also tagged the .500 grey Fib (of 1687-1560) yesterday, where it (so far) reacted less than it did at the red .618.

So, the red pattern is assumed to be the one in charge, with a Gartley Pattern completion at the red .786 (1634.10) the next major Fib target on the radar.

UPDATE:  10:15 AM

A close up shows two smaller patterns also pointing to the 1631-1635 range if SPX can poke through the red channel top.  Note also the presence of the pink .618 here -- contributing to the pause.


We've had a few pieces of economic news this morning.  First, the Fed is set to vote on Basel III this morning.  While significantly watered down, it could still be construed as a speed bump on the road to global financial domination.

Also, Census released the factory orders survey for May. The managed (a.k.a. seasonally adjusted) version came in slightly higher than expected, at +2.1% versus 2.0% consensus and 1.3% for April.


There is bound to be some concern that the slight beat undermines support for QE (does anything else matter?)

This explains why the less-managed, de-emphasized, and not seasonally adjusted number, at +5.4% month-over-month, is the better number for a change.  Remember the good old days when they massaged the numbers to make things look better?

Wednesday, June 26, 2013

Update on Gold: Jun 26, 2013

reposted from pebblewriter.com~

It's been over a month since I last focused on gold.  The equities markets have kept me working overtime, and I assumed our May 15 forecast had long since jumped the tracks.

At the time, gold had plunged 270 to 1321 per ounce in only 4 sessions, bounced at 1321 (the day after our bottom call) to within 13 of our upside target, and was returning for a second bounce -- or not.   From that post [Update on Gold: May 15, 2013]:
Now, at 1373, it has reached a critical juncture that should result in either a sharp rally to 1560 or a plunge to 1141 in the coming month or so.
GC was closing in on the .786 retracement of the the rise off the 1321 bottom.  Playing the bounce was a low risk trade as long as one used trailing stops.
Long positions could be played from the .786 (1357) or .886 (1340) as long as stops are watched very carefully and updated frequently.
 The downside case is probably stronger.  If the current plunge continues past 1321, there are only a few key levels of support before things get really nasty:
  • horizontal support at 1302-1309
  • potential Fib targets of 1276 (the 1.272) or 1219 (1.618)
  • Fib support at 1141-1157
  • Fib support at 947
The bounce came a few days later at the .886 (1336) and despite gaining 84, couldn't clear the big white channel midline, much less the smaller red channel (white in previous charts) it had been in since last September.

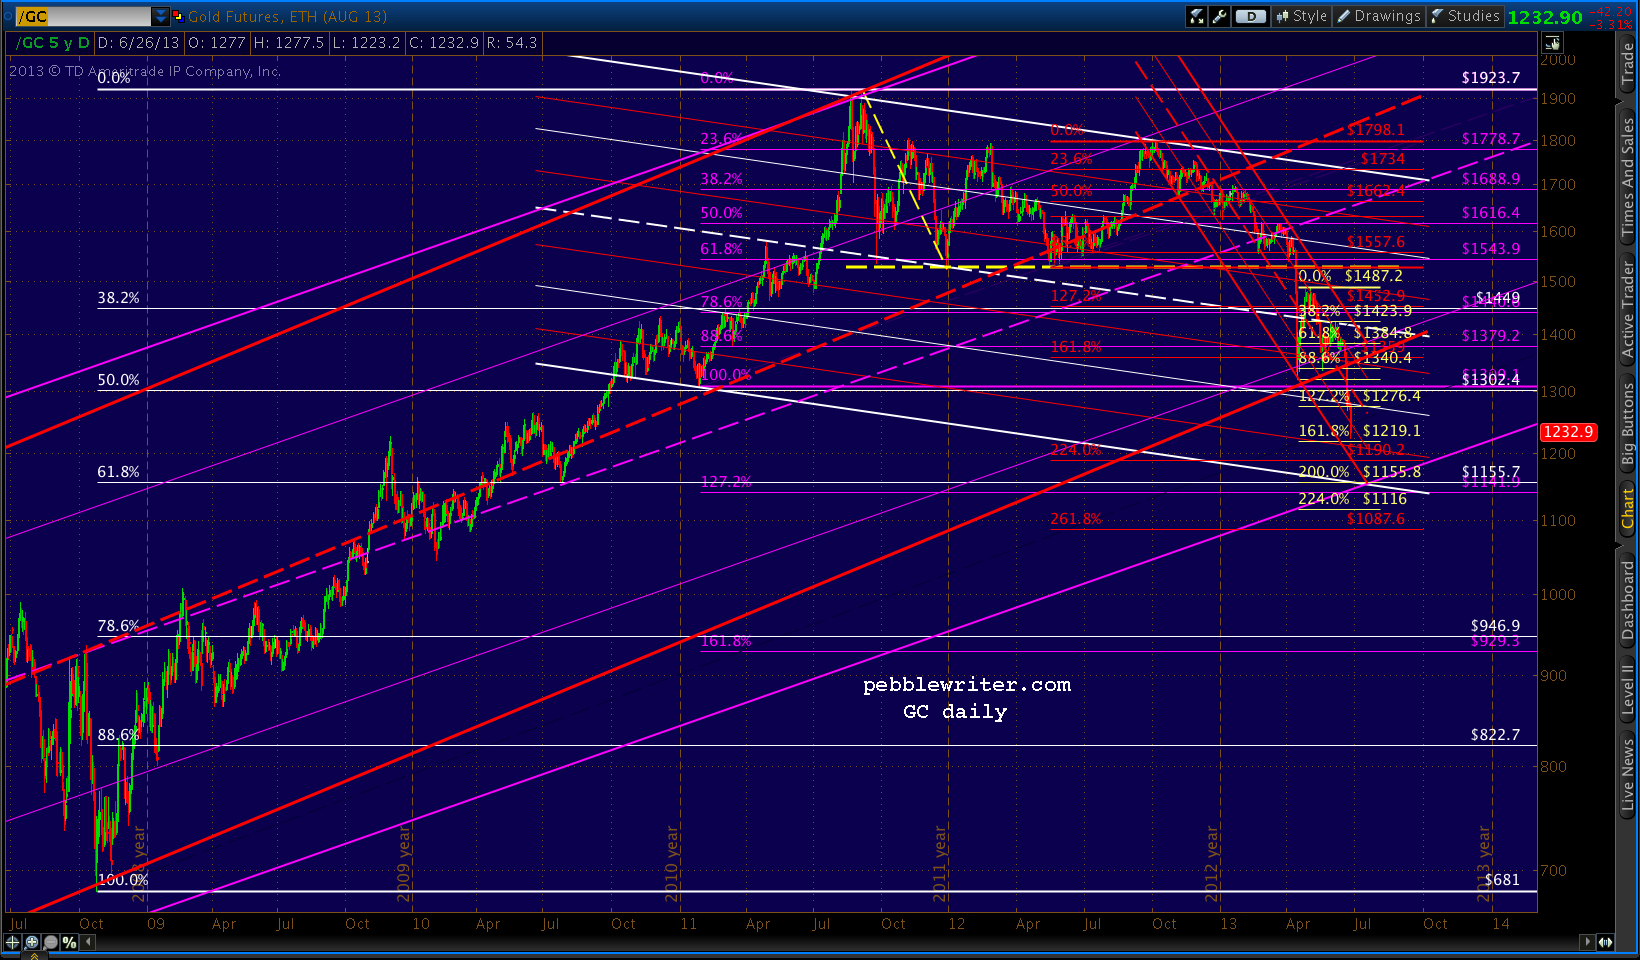
When the big red channel from 1999 broke down on Jun 20, GC plunged again.  It failed to catch a bid at the first support level, but is approaching the second one this morning: the yellow 1.618 that completes the Crab Pattern at 1219.10.


This seems like an opportune time to update the forecast, as gold's price action continues to provide valuable clues as to investors' expectations about QE, the value of the dollar and inflation.  Are the many calls for gold to fall below $1000 per ounce well-founded?

Probably not.  We should get a decent bounce beginning at or near 1219 today that could take prices as high as 1320 or so by July 5-8.  A continued rally through the red midline would mean additional gains to 1357-1385 by mid-July.

But, there's a better chance of a plunge to 1155 instead -- and it need not respect the Crab Pattern about to complete, especially if today's equity rally falters (gold certainly isn't buying the More QE! snake oil.)

Remember that 1155 is the .618 retracement (in white below) of the huge rally from 681 in 2008 to last September's 1923 all-time high. Around July 15, the bottom of the big white channel and the bottom of the red channel intersect there with the bottom of the big purple channel (it replaced the red one that failed on Jun 20.)

This is the same price target we identified in our April 15 Update on Gold.


We can speculate about what circumstances might provide for a floor.  The prevailing wisdom these days is yet another round of QE -- or at least inflation of some variety. With interest rates on the rise, that seems likely enough.  We'll stick a pin in the idea of a mid-July market calamity that necessitates Fed intervention.

...continued on pebblewriter.com...