~reposted from pebblewriter.com:
9:00 AM EDT
The ECB's vow to do "whatever it takes"apparently translates into strong-arming the Russians into bailing out Cyprus. Still no break out on the EURUSD, though.
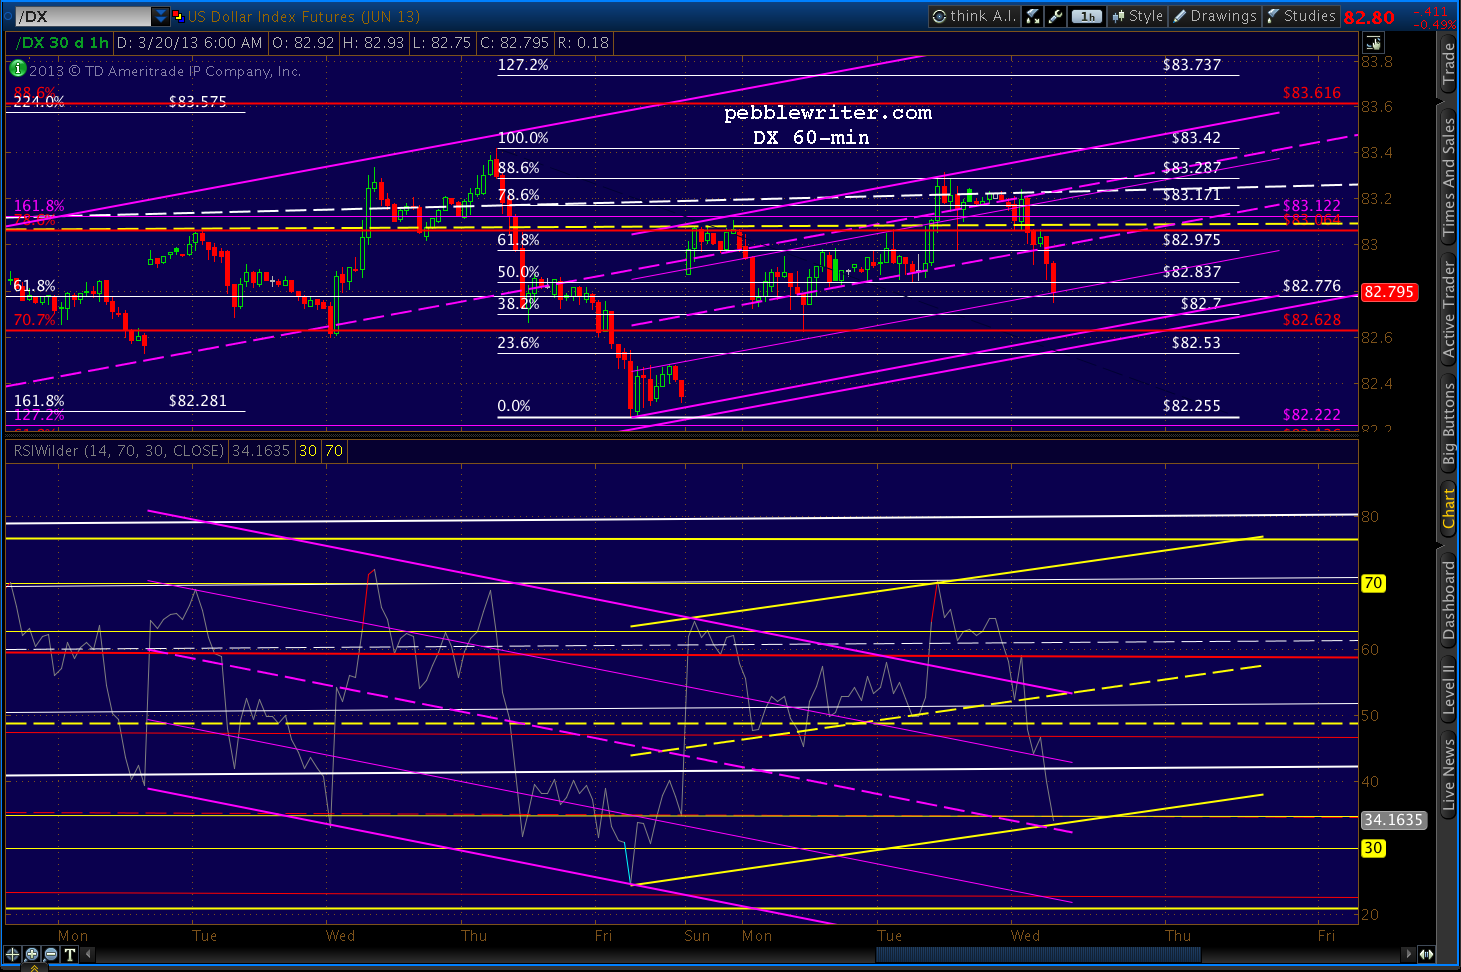
It makes sense to play along with the upside on SPX, but keep stops close. Not sure whether this rally will have legs. The dollar looks like it's finding support here.
UPDATE: 09:33 AM
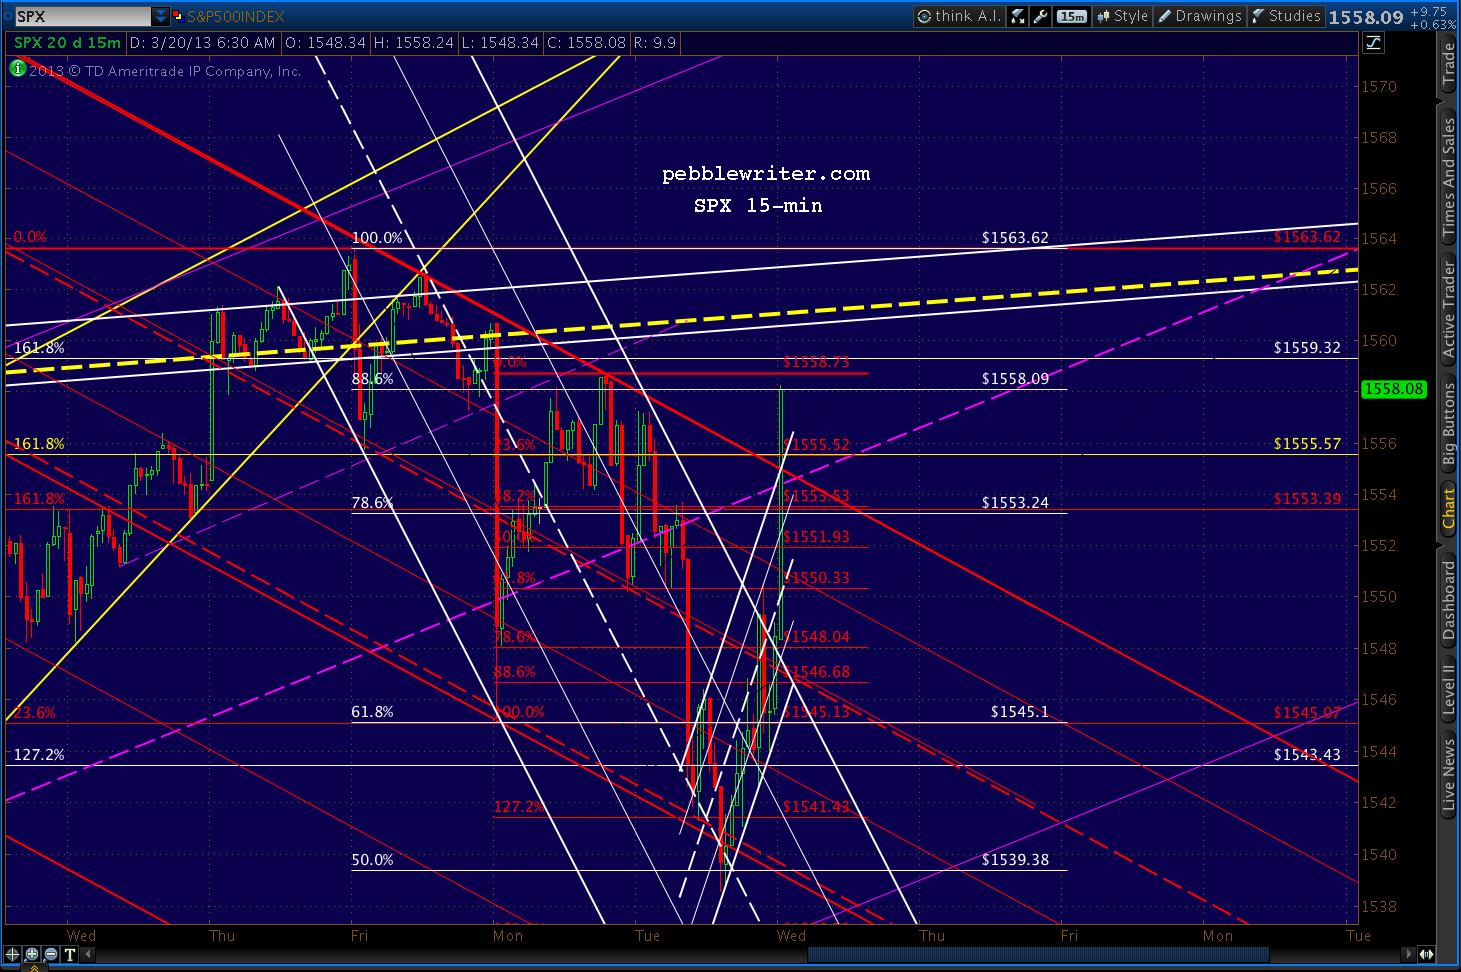
Just reached the .786 of the move down from 1563.62 (purple) and the .886 of our proposed path to 1576 (white.) Full short again, stops at 1561ish. Revised charts in a few...

UPDATE: 09:55 AM
The daily chart tells the story. The most prominent features include:
UPDATE: 11:10 AM
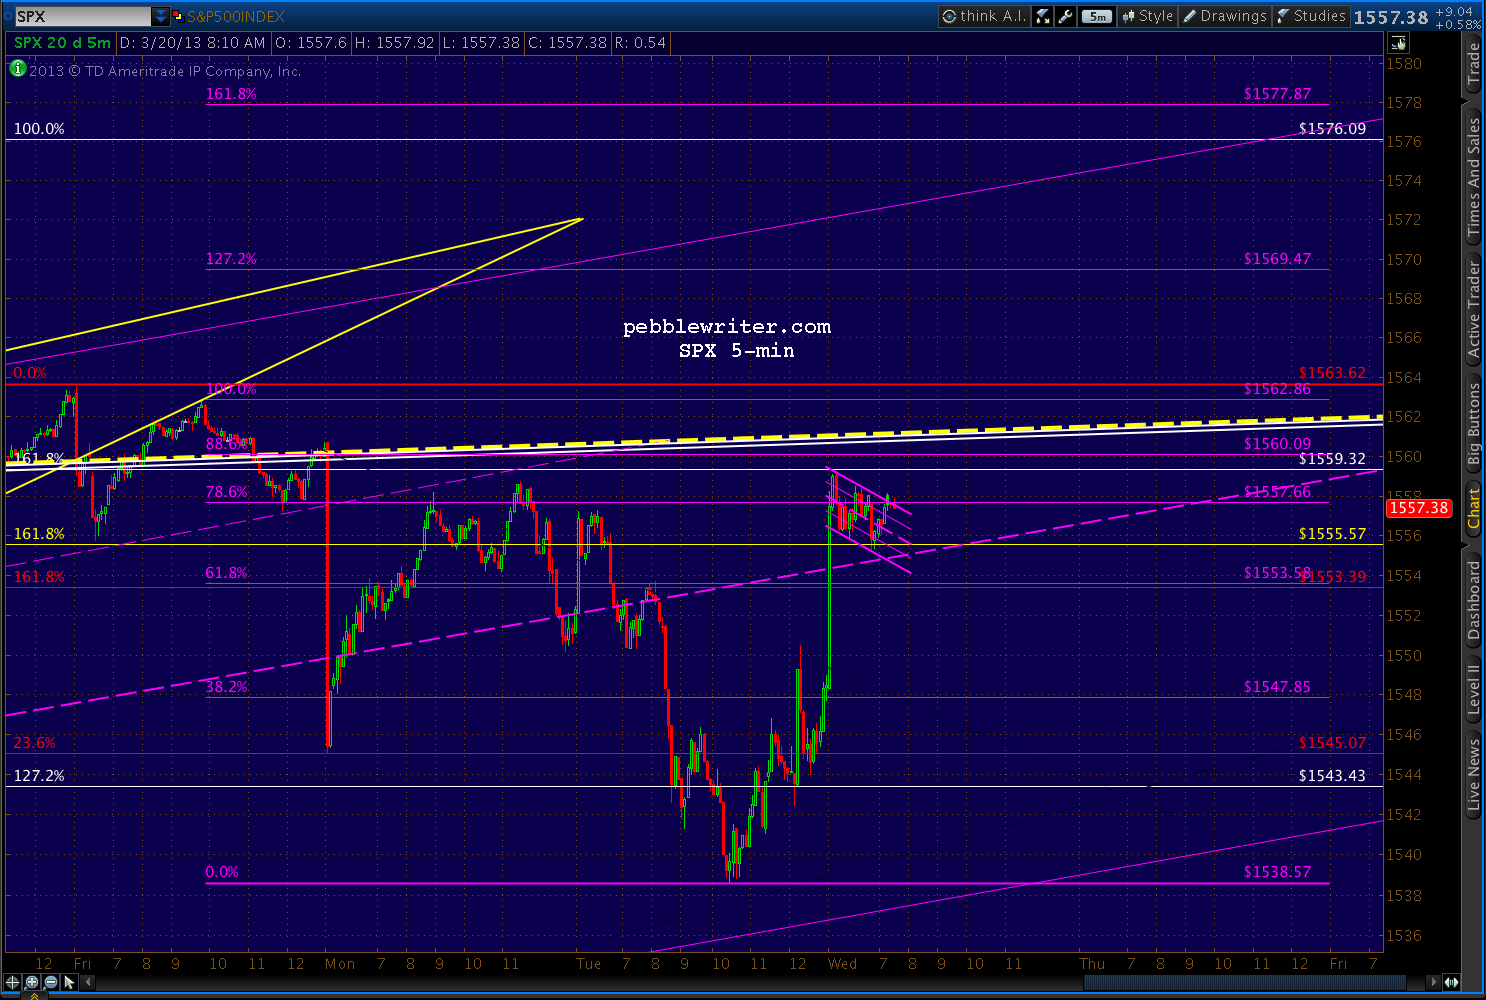
SPX continues to position itself for a run at 1576. The 5-min chart shows a small potential Crab Pattern with a 1.618 at 1577 and a Flag Pattern targeting 1576.
It has broken back above and backtested the purple channel midline and retraced nearly .886 of its drop from 1562 and a little more than .786 of the drop from 1563.62.
While it's positioned for 1576, there is no more certainty than when we first broke 1555 on the Mar 14 overnight ramp job. The large, bearish patterns listed above have still not produced the kind of sell-off they normally do.
And, it's all because of theFed's media's cheerleaders' TPTB's determination to be able to tout a swell new all-time high for the S&P 500.
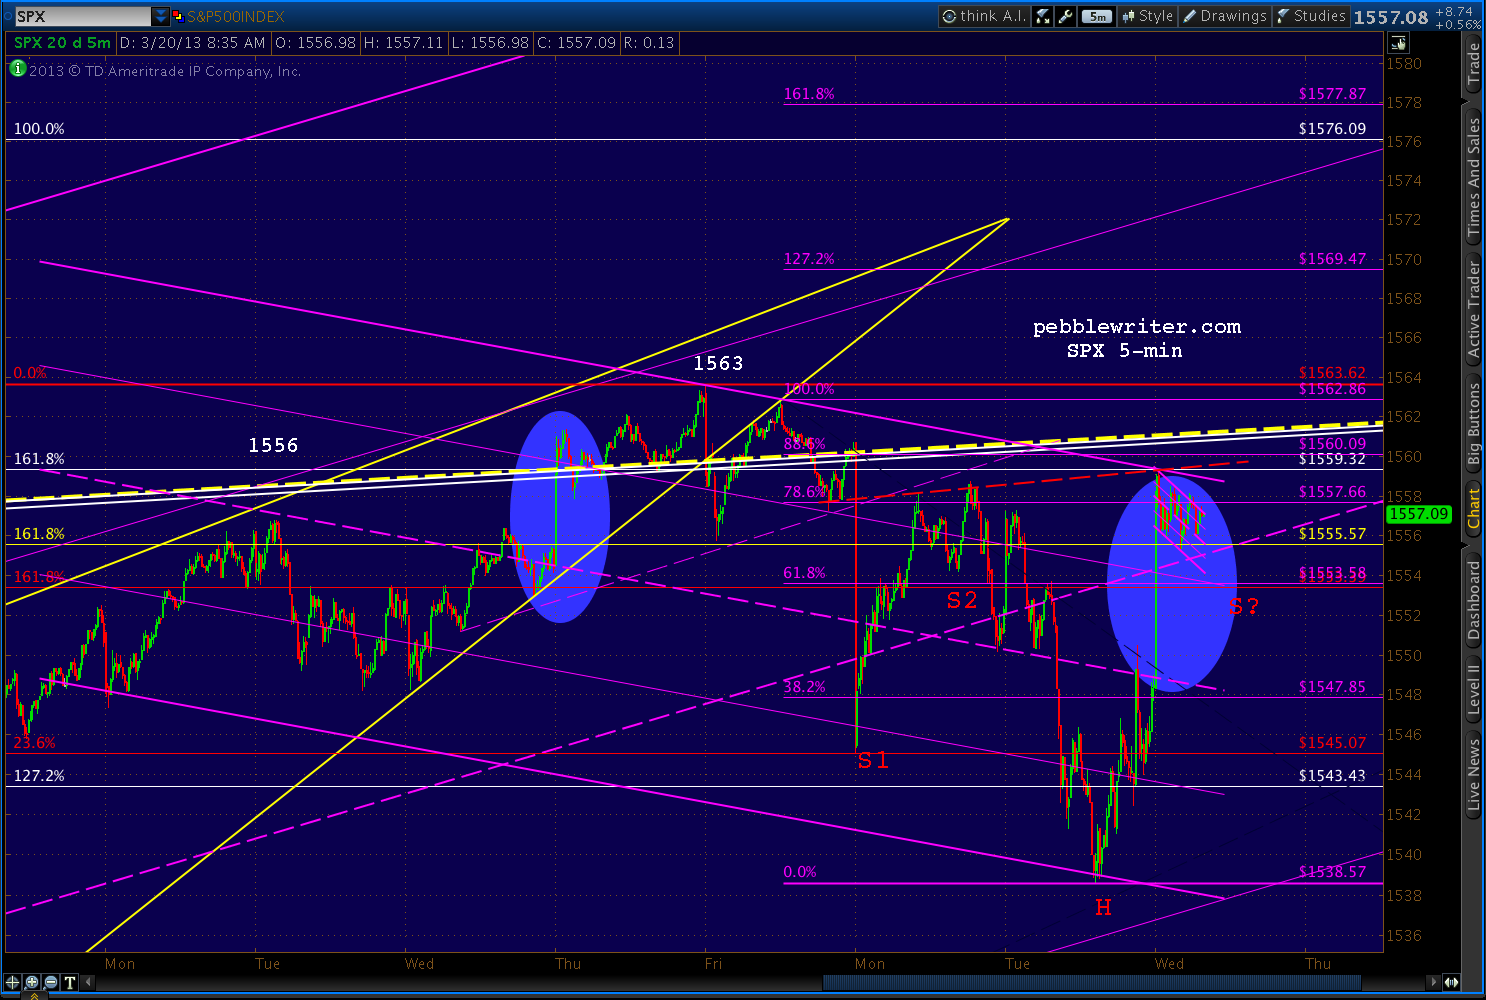
In addition to the little Crab Pattern (purple) that targets 1577 and the flag pattern targeting 1576, there's an obvious effort to construct an IH&S pattern targeting 1580. It could benefit from a lower right shoulder, but bulls must beware of crossing back beneath the purple channel midline.
The S2 shoulder isn't quite legit, BTW, as the neckline doesn't quite connect on the left side. But, the S1 shoulder is quite a ways down there. So, if the pattern plays out, be prepared for some serious chop.
UPDATE: 1:00 PM
With the FOMC announcement a little over an hour away, let's resume our chat about the big picture. If it seems like we're "lost in the reeds" as one reader so aptly put it, it's because we are.
The large Crab Pattern completions promised a good-sized dump last week at 1553/1555. Instead we've inched higher. Why? These patterns completed in the middle of harmonic no-man's land: the gap between an .886 retracement and a double-top.
The .886 retracement (of the 1576-666 crash) produced a 9% reversal back on Sep 14. Since then, SPX came screaming back to retake the 1576 all-time high -- but slammed into the Crab Patterns and a very important channel line along the way.
Now, it doesn't know what to do.
Double tops usually produce reversals, too -- sometimes meaningful ones as we found out on October 11, 2007, when SPX scooted up past the 1552 top from 2000 by a whopping 24 points before dropping 58%.
The 2000 top itself shows just how "messy" tops can be. Here's the finished picture in perfect hind-sight. It's a very crowded chart, but every pattern on there had a say in how the top unfolded.
Once SPX broke out of the falling purple channel, it had "permission" to pursue several harmonic patterns in the works. SPX shot up 66 points in that one day -- blowing through every Fib level between .618 and 1.000.
It finally came to rest at 1458, completing a Bat Pattern at the purple .886. But, the small white 1.272 was just above at 1477, as was the rising purple channel midline and the 1.272 from a much larger pattern seen below. An IH&S target waited at 1497 - tantalizingly close to the nice round number of 1500. The all-time high of 1478 from two months earlier beckoned.
SPX got up to 1477.33 before reacting, falling to 1466 over the next two days. Close, but not quite. Someone watching closely might have noticed the Flag Pattern it constructed, targeting 1562. Someone else probably pointed out the biggest Crab Pattern target of all -- the 1.618 extension of the 13% correction from 1420 to 1233 from Jul-Oct 1999.
I don't know what the catalyst was, but on Mar 21, 2000 (that date sounds awfully familiar) SPX shot up through the channel midline, the cluster of Fibs around 1477 and, importantly, the 1478 high and raced up toward those higher targets.
On Mar 24, it reached 1552.87, which cleared the IH&S target at 1497, the purple 1.272 at 1519 and the last remaining Crab Pattern at 1535. What ultimately stopped it? The .75 line from the big purple channel dating back to Jul 1999 -- almost to the penny.
Total move: 17% and 227 points in 20 sessions. Could it happen again?
continued for members...
For full access to live market commentary throughout every trading day, subscribe to pebblewriter.com.
9:00 AM EDT
The ECB's vow to do "whatever it takes"apparently translates into strong-arming the Russians into bailing out Cyprus. Still no break out on the EURUSD, though.
It makes sense to play along with the upside on SPX, but keep stops close. Not sure whether this rally will have legs. The dollar looks like it's finding support here.
UPDATE: 09:33 AM
Just reached the .786 of the move down from 1563.62 (purple) and the .886 of our proposed path to 1576 (white.) Full short again, stops at 1561ish. Revised charts in a few...

UPDATE: 09:55 AM
The daily chart tells the story. The most prominent features include:
- large 1474-1343 Crab Pattern completion at 1555.57 (yellow)
- large 1370-1074 Crab Pattern completion at 1553.39 (red)
- small 1530-1485 Crab Pattern completion at 1559.32 (white)
- small broken rising wedge -- at 1563 top
- long-term TL and channel top (white) at 1560
UPDATE: 11:10 AM
SPX continues to position itself for a run at 1576. The 5-min chart shows a small potential Crab Pattern with a 1.618 at 1577 and a Flag Pattern targeting 1576.
It has broken back above and backtested the purple channel midline and retraced nearly .886 of its drop from 1562 and a little more than .786 of the drop from 1563.62.
While it's positioned for 1576, there is no more certainty than when we first broke 1555 on the Mar 14 overnight ramp job. The large, bearish patterns listed above have still not produced the kind of sell-off they normally do.
And, it's all because of the
In addition to the little Crab Pattern (purple) that targets 1577 and the flag pattern targeting 1576, there's an obvious effort to construct an IH&S pattern targeting 1580. It could benefit from a lower right shoulder, but bulls must beware of crossing back beneath the purple channel midline.
The S2 shoulder isn't quite legit, BTW, as the neckline doesn't quite connect on the left side. But, the S1 shoulder is quite a ways down there. So, if the pattern plays out, be prepared for some serious chop.
UPDATE: 1:00 PM
With the FOMC announcement a little over an hour away, let's resume our chat about the big picture. If it seems like we're "lost in the reeds" as one reader so aptly put it, it's because we are.
The large Crab Pattern completions promised a good-sized dump last week at 1553/1555. Instead we've inched higher. Why? These patterns completed in the middle of harmonic no-man's land: the gap between an .886 retracement and a double-top.
The .886 retracement (of the 1576-666 crash) produced a 9% reversal back on Sep 14. Since then, SPX came screaming back to retake the 1576 all-time high -- but slammed into the Crab Patterns and a very important channel line along the way.
Now, it doesn't know what to do.
Double tops usually produce reversals, too -- sometimes meaningful ones as we found out on October 11, 2007, when SPX scooted up past the 1552 top from 2000 by a whopping 24 points before dropping 58%.
The 2000 top itself shows just how "messy" tops can be. Here's the finished picture in perfect hind-sight. It's a very crowded chart, but every pattern on there had a say in how the top unfolded.
Once SPX broke out of the falling purple channel, it had "permission" to pursue several harmonic patterns in the works. SPX shot up 66 points in that one day -- blowing through every Fib level between .618 and 1.000.
It finally came to rest at 1458, completing a Bat Pattern at the purple .886. But, the small white 1.272 was just above at 1477, as was the rising purple channel midline and the 1.272 from a much larger pattern seen below. An IH&S target waited at 1497 - tantalizingly close to the nice round number of 1500. The all-time high of 1478 from two months earlier beckoned.
SPX got up to 1477.33 before reacting, falling to 1466 over the next two days. Close, but not quite. Someone watching closely might have noticed the Flag Pattern it constructed, targeting 1562. Someone else probably pointed out the biggest Crab Pattern target of all -- the 1.618 extension of the 13% correction from 1420 to 1233 from Jul-Oct 1999.
I don't know what the catalyst was, but on Mar 21, 2000 (that date sounds awfully familiar) SPX shot up through the channel midline, the cluster of Fibs around 1477 and, importantly, the 1478 high and raced up toward those higher targets.
On Mar 24, it reached 1552.87, which cleared the IH&S target at 1497, the purple 1.272 at 1519 and the last remaining Crab Pattern at 1535. What ultimately stopped it? The .75 line from the big purple channel dating back to Jul 1999 -- almost to the penny.
Total move: 17% and 227 points in 20 sessions. Could it happen again?
continued for members...
* * * * * * * *
For full access to live market commentary throughout every trading day, subscribe to pebblewriter.com.


No comments:
New comments are not allowed.