~reposted from pebblewriter.com
AAPL has bounced nearly 50 points since its Jan 25 low, leading many to wonder whether the worst is over. When I started this post about a week ago, all the talking heads were talking "breakout." We'll give the old crystal ball a polish and see whether that's likely.
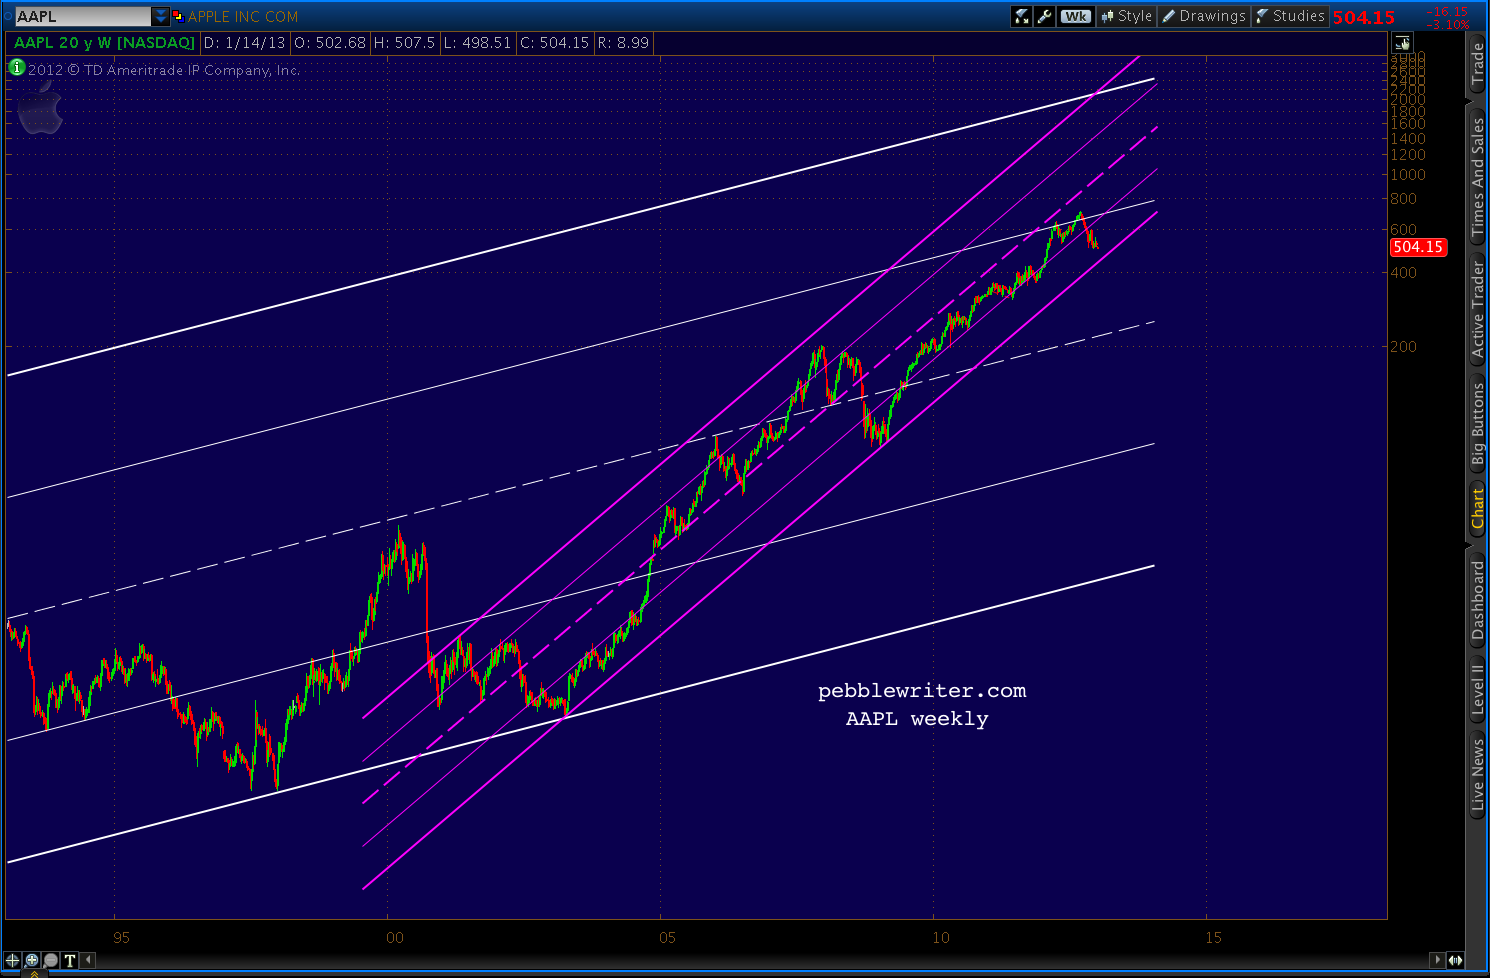
When I posted that AAPL seemed to finding support back on the 24th, it was because of the long-term channel (in purple, below) that's guided its upside since the year 2000 [see: That All You Got?] The top of it, by the way, is up around 1775.
AAPL bottomed the next day at 435 (one point from our Nov 27 forecast), and obviously still hasn't broken that channel. The channel top, by the way, is currently up around 1880.

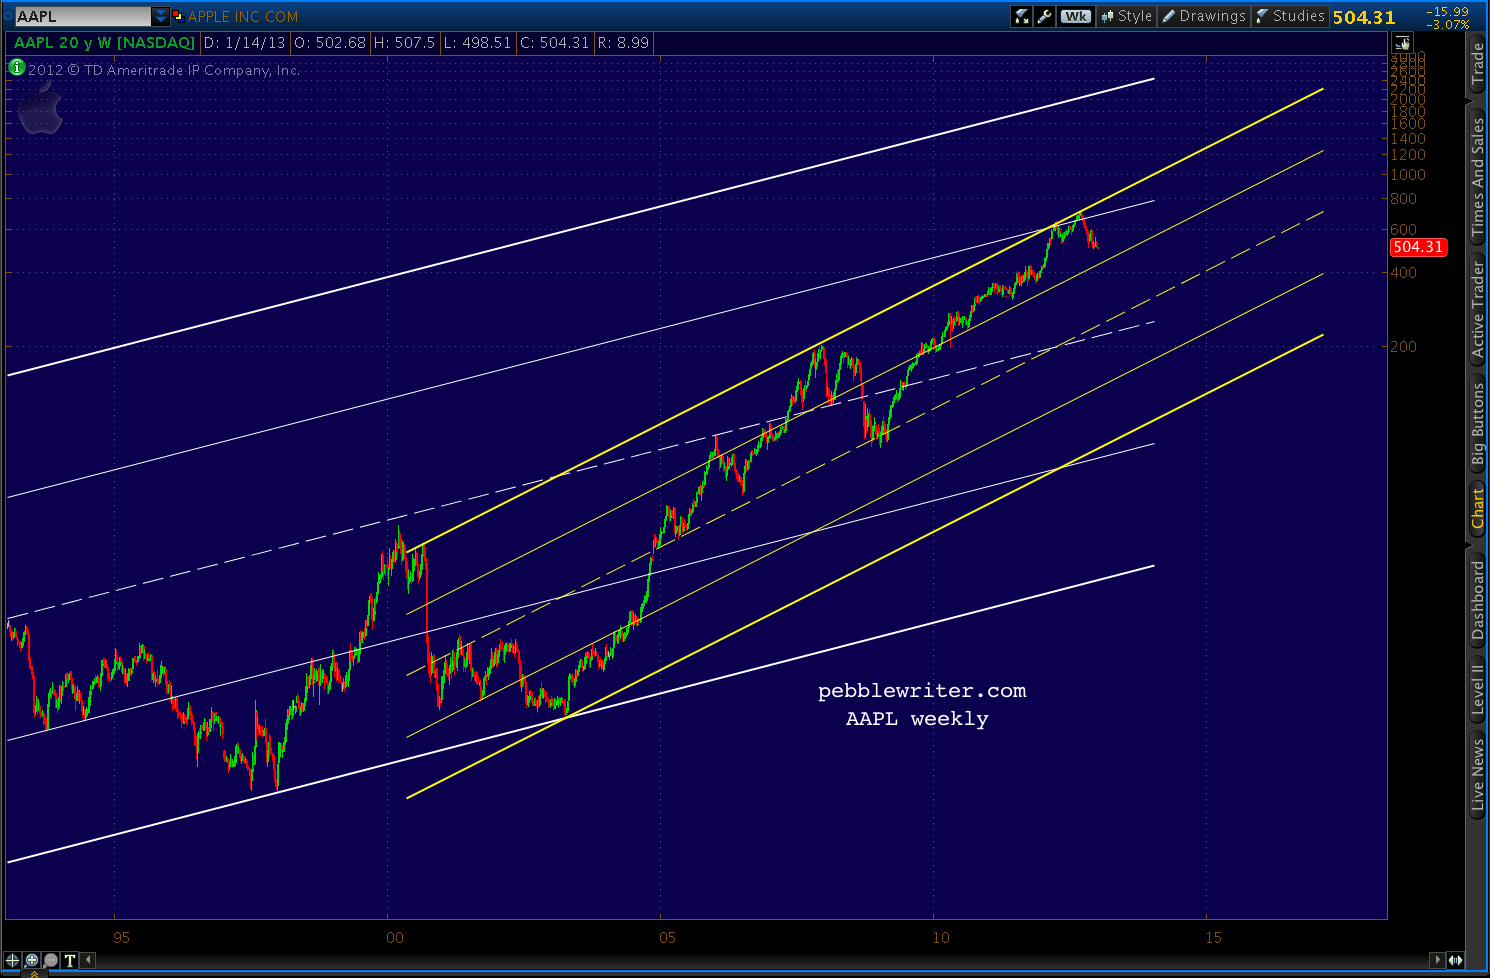
As we've noted before, there are other long-term channels at play, too. Note the white channel casts a rather bearish pall, while the yellow channel promises at least a bounce here. So, which to believe?

GETTING HERE
We've been very fortunate in forecasting AAPL over the past several months, calling several significant tops and bottoms with decent accuracy.
Nov 8: Harmonics Are Your Friend:
It looked like AAPL was about to bottom out, followed by a sizable bounce.
Nov 27: Update on AAPL:
As AAPL approached our 600 target, I anticipated a reversal and completion of a Head & Shoulder Pattern that would bounce first at the neckline before plunging below.
It back-tested the neckline for a week before taking a "more serious plunge" down to 435, one point from our original Nov 27 target.
GOING FORWARD
The purple channel has done its job so far. Can it continue to stave off the damage of the completed Head & Shoulder Pattern? H&S Patterns commonly back test their necklines. Back tests can even exceed the neckline, as has AAPL's in several cases.
As we've discussed many times, AAPL has been in a fairly tight price channel all the way down from 705 (below, in white.)

The upper bound of this channel intersects with the H&S neckline at about 498-500 around Feb 19 (there is some wiggle room, depending on exactly how the channel is drawn.) This likely represents the extent of any short-term upside.
As for the downside, the white channel midline intersects with the purple channel at about 450-452 around Feb 20. The white upper bound intersects with the purple channel bottom 465 on Mar 18.
But, note the large red falling channel. It's dicey to consider it well-established, since the "top" consists of only one tag. But, it looks to me like it has potential over the medium-term.
Today, AAPL is testing its 25% line; and, a close above 473 or so would be positive -- arguing for the more bullish of the two scenarios above.

The daily RSI recently poked up through the white midline and the yellow 75% line, but appears to be backtesting both. This would be consistent with a dip to 450, where AAPL could back-test the white price channel midline and the purple channel bottom (the purple circle.)
From there, the top of the yellow RSI channel beckons -- which probably corresponds with a return to test the neckline around 500. As noted above, this could occur as soon as Feb 19 if prices are to remain in the white channel.
And, what if prices break out of the white channel? Keep an eye on the RSI. A break above the neckline would probably require a break out from the yellow RSI channel. While, remaining in the yellow channel probably means a period of consolidation until early May, when the purple channel and neckline intersect at about 490.
One other issue often discussed is the expiration of the 30-day wash sale period. The biggest volume spikes in the past few months were the plunges of Nov 16, Dec 6, Dec 14 and Jan 24-25. So, the only remaining relevant buyers who might rush back in are those who sold in the 435-465 range on Jan 24-25.
Since the stock has gained a few points since then, these sellers might be expected to believe the worst is over and that it's safe to re-enter at these levels -- especially since the rest of the market is setting new highs.
AAPL has bounced nearly 50 points since its Jan 25 low, leading many to wonder whether the worst is over. When I started this post about a week ago, all the talking heads were talking "breakout." We'll give the old crystal ball a polish and see whether that's likely.
When I posted that AAPL seemed to finding support back on the 24th, it was because of the long-term channel (in purple, below) that's guided its upside since the year 2000 [see: That All You Got?] The top of it, by the way, is up around 1775.
AAPL bottomed the next day at 435 (one point from our Nov 27 forecast), and obviously still hasn't broken that channel. The channel top, by the way, is currently up around 1880.

As we've noted before, there are other long-term channels at play, too. Note the white channel casts a rather bearish pall, while the yellow channel promises at least a bounce here. So, which to believe?
GETTING HERE
We've been very fortunate in forecasting AAPL over the past several months, calling several significant tops and bottoms with decent accuracy.
Nov 8: Harmonics Are Your Friend:
It looked like AAPL was about to bottom out, followed by a sizable bounce.
"AAPL should get a brief bump higher as SPX does — perhaps to 600 or 620. Of course, if it stalls there, it will have formed 5/6 of a huge H&S pattern... "It bottomed 6 sessions later when the S&P 500 dropped down to tag our 1344 target [see: Charts I'm Watching Nov 15.] From there, we were looking for a bounce to 600.
Nov 27: Update on AAPL:
As AAPL approached our 600 target, I anticipated a reversal and completion of a Head & Shoulder Pattern that would bounce first at the neckline before plunging below.
"A reversal here could quite likely spell a return to the channel bottom — which will be around 434...AAPL topped out two sessions later at 594 and plunged to the neckline at 501 where it failed to "seal the deal," bouncing for two weeks before finally falling below the neckline on Jan 15.
...it’s easy to imagine a scenario where prices drop to [the neckline at] 500 into the end of the year, but can’t quite seal the deal on the H&S pattern...
If, on the other hand, AAPL breaks down below [the neckline], look for a back test followed by a more serious plunge."
It back-tested the neckline for a week before taking a "more serious plunge" down to 435, one point from our original Nov 27 target.
GOING FORWARD
The purple channel has done its job so far. Can it continue to stave off the damage of the completed Head & Shoulder Pattern? H&S Patterns commonly back test their necklines. Back tests can even exceed the neckline, as has AAPL's in several cases.
As we've discussed many times, AAPL has been in a fairly tight price channel all the way down from 705 (below, in white.)
The upper bound of this channel intersects with the H&S neckline at about 498-500 around Feb 19 (there is some wiggle room, depending on exactly how the channel is drawn.) This likely represents the extent of any short-term upside.
As for the downside, the white channel midline intersects with the purple channel at about 450-452 around Feb 20. The white upper bound intersects with the purple channel bottom 465 on Mar 18.
But, note the large red falling channel. It's dicey to consider it well-established, since the "top" consists of only one tag. But, it looks to me like it has potential over the medium-term.
Today, AAPL is testing its 25% line; and, a close above 473 or so would be positive -- arguing for the more bullish of the two scenarios above.
The daily RSI recently poked up through the white midline and the yellow 75% line, but appears to be backtesting both. This would be consistent with a dip to 450, where AAPL could back-test the white price channel midline and the purple channel bottom (the purple circle.)
From there, the top of the yellow RSI channel beckons -- which probably corresponds with a return to test the neckline around 500. As noted above, this could occur as soon as Feb 19 if prices are to remain in the white channel.
And, what if prices break out of the white channel? Keep an eye on the RSI. A break above the neckline would probably require a break out from the yellow RSI channel. While, remaining in the yellow channel probably means a period of consolidation until early May, when the purple channel and neckline intersect at about 490.
One other issue often discussed is the expiration of the 30-day wash sale period. The biggest volume spikes in the past few months were the plunges of Nov 16, Dec 6, Dec 14 and Jan 24-25. So, the only remaining relevant buyers who might rush back in are those who sold in the 435-465 range on Jan 24-25.
Since the stock has gained a few points since then, these sellers might be expected to believe the worst is over and that it's safe to re-enter at these levels -- especially since the rest of the market is setting new highs.