~reprinted from pebblewriter.com
Those who have followed this blog for any length of time know about our focus on the Japanese economy and the yen. I presented this chart in December, which shows the impact on stocks of the last three USDJPY reversals off a trend line (or top of a channel, depending on how bearish you are) it recently tagged a 4th time.

The latest out of Japan is the BOJ deciding to hold easing at current levels (60-70 trillion yen or $590-690 billion.) This surprised many, given that exports have fallen off a cliff on the eve of a 60% consumption tax increase (from 5 to 8% on Apr 1.)
This article from Reuters sums up very well the problem Japan faces: trashing the yen can't undo the systemic economic imbalances of a stagnating economy with way too much debt on its hands. Japan exports have leveled off, producing record trade deficits (in spite of a weaker yen), while the cost of imports continues to rise (thanks to the weaker yen.)
Japan's CPI conveniently leaves out fresh food, which has soared over 17% since the Nov 2012 assault on the yen (Japan imports 40% of its food.) Is it any surprise that consumer confidence is moving in the opposite direction?

And, fuel prices have soared -- exacerbated by the continuing fallout (pun very much intended) from Fukushima. The consumer, who also faces next month's 60% tax hike mentioned above, is already getting crushed by QE. So, why not scrap it?

If they do, rates will skyrocket. Outstanding debt is 242% of GDP, and annual debt service (23 trillion yen) is already greater than 50% of tax receipts (43 trillion.) With QE of 60-70 trillion yen, the BOJ is essentially monetizing all of Japan's debt directly or indirectly (issuance of 41 trillion yen is anticipated this year.) In short, QE is the only thing keeping rates "manageable."

In sum, the BOJ is in a box from which there is increasingly no escape. They can make ends meet by issuing much more debt to fund the 43% of expenditures not covered by tax revenues. Issuing that debt keeps rates low enough to be able to pay the interest. But, a rock bottom yen bites the consumer in the ass and, in the end, means tax revenues go sayonara, increasing the need for more debt... Wash, rinse, repeat.
As BOJ's Kuroda put it in his latest "let's play make-believe" press conference:
Those who have followed this blog for any length of time know about our focus on the Japanese economy and the yen. I presented this chart in December, which shows the impact on stocks of the last three USDJPY reversals off a trend line (or top of a channel, depending on how bearish you are) it recently tagged a 4th time.

The latest out of Japan is the BOJ deciding to hold easing at current levels (60-70 trillion yen or $590-690 billion.) This surprised many, given that exports have fallen off a cliff on the eve of a 60% consumption tax increase (from 5 to 8% on Apr 1.)
This article from Reuters sums up very well the problem Japan faces: trashing the yen can't undo the systemic economic imbalances of a stagnating economy with way too much debt on its hands. Japan exports have leveled off, producing record trade deficits (in spite of a weaker yen), while the cost of imports continues to rise (thanks to the weaker yen.)
Japan's CPI conveniently leaves out fresh food, which has soared over 17% since the Nov 2012 assault on the yen (Japan imports 40% of its food.) Is it any surprise that consumer confidence is moving in the opposite direction?

And, fuel prices have soared -- exacerbated by the continuing fallout (pun very much intended) from Fukushima. The consumer, who also faces next month's 60% tax hike mentioned above, is already getting crushed by QE. So, why not scrap it?
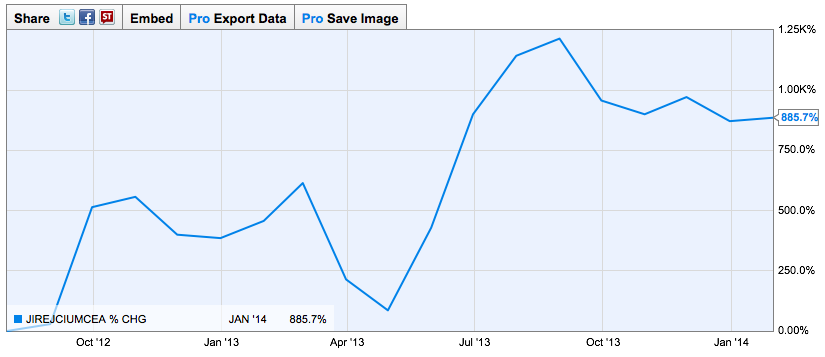
If they do, rates will skyrocket. Outstanding debt is 242% of GDP, and annual debt service (23 trillion yen) is already greater than 50% of tax receipts (43 trillion.) With QE of 60-70 trillion yen, the BOJ is essentially monetizing all of Japan's debt directly or indirectly (issuance of 41 trillion yen is anticipated this year.) In short, QE is the only thing keeping rates "manageable."
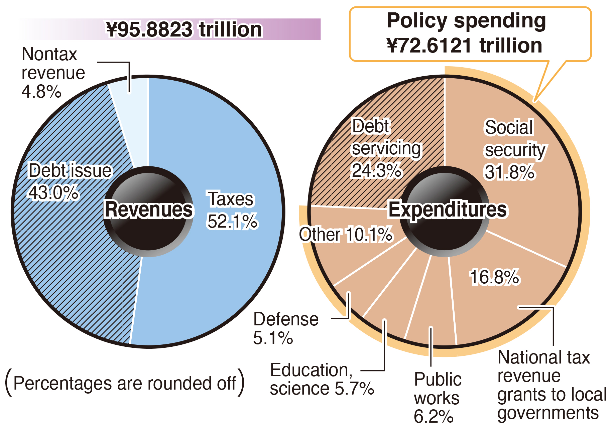
In sum, the BOJ is in a box from which there is increasingly no escape. They can make ends meet by issuing much more debt to fund the 43% of expenditures not covered by tax revenues. Issuing that debt keeps rates low enough to be able to pay the interest. But, a rock bottom yen bites the consumer in the ass and, in the end, means tax revenues go sayonara, increasing the need for more debt... Wash, rinse, repeat.
As BOJ's Kuroda put it in his latest "let's play make-believe" press conference:
When the sales tax hike was raised to 5 percent from 3 percent in April 1997, Japan's economic growth turned negative in April-June but rebounded in July-September. But, the Asian currency crisis erupted in the summer that year and Japan fell into a recession as it faced its domestic banking crisis in the autumn.He assures us that this time will be different, but I think it's wishful thinking. I think Japan is very much on the path to default or depression, and there's no amount of debt issuance that can alter that outcome. When the money spigot turns off, the primary beneficiaries of Japan's QE hot money (Thailand, Singapore, Philippines, Malaysia, Korea... not to mention China, Japan's biggest trading partner) will go tapioca. The Asian currency crisis will come roaring back in a big way.


