~reposted from pebblewriter.com
First, an important caveat: I'm not a bond guy. Never have been, never will be -- at least with long bonds under 8%. To me, the idea of sinking even one dollar into a security (which should be downgraded, mind you) that guarantees less than 2% for 10 years borders on insanity.
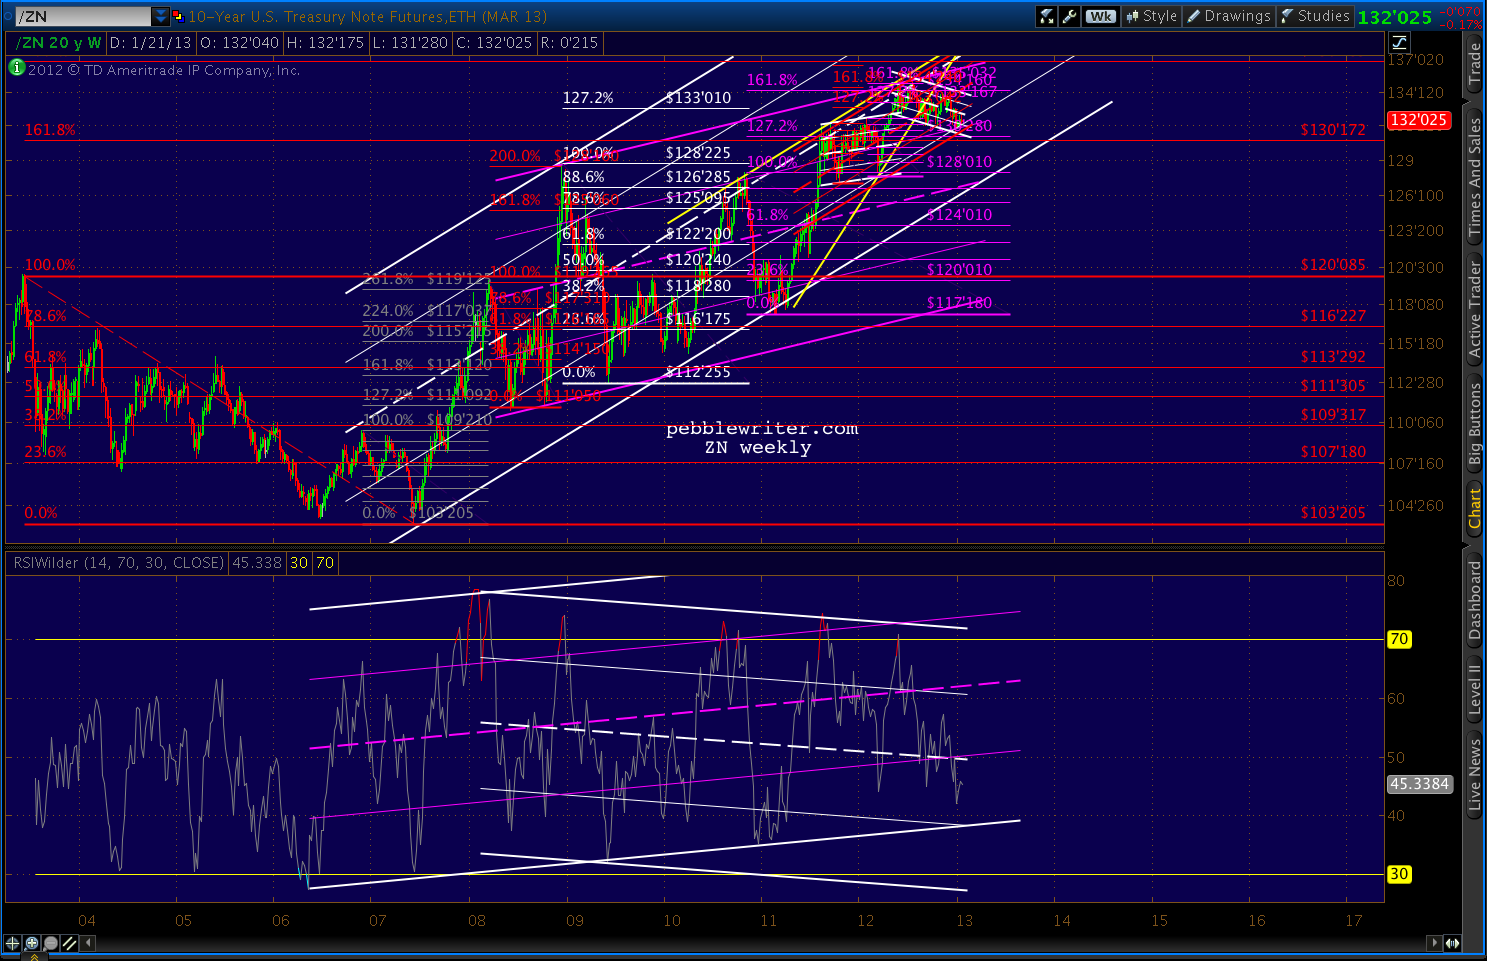
But, different strokes and all that. Plus, bonds can be a good window on equities and currencies, so I don't mind charting them once in a while. The 10-yr has obviously been on a tear for several years. It's settled back from the 2008-09 spike into the bottom half of a channel that dates back to 2005 (white.)
The big question is whether the white channel is still in charge, or the less aggressively sloped purple one has taken over. Making things interesting, there's a pretty well-formed rising wedge that broke down in August.
But, the RW is slightly suspect because the July 25 high was slightly exceeded on Nov 16 and Dec 6, meaning there are two higher highs and a higher low in place since the August break (though both highs came on negative divergence relative to the July high.)
Harmonics have performed pretty well with the 10-yr note. The chart below shows a big Crab (grey), followed by another Crab (red), a Bat (white) and another Crab (purple.) Each previous Crab Pattern completion has been followed by a significant retreat, so we might suspect one here with the purple pattern completion.
The only potential hitch is whether the white pattern is still in play. Bats can and do go on to form Crabs, and the white 1.618 is way up at 138'170 -- a 4.5% increase from current levels.
There is a significant amount of negative divergence on the daily and weekly channels, so I suspect not. But, obviously, a strong equities sell-off would turn that assumption on its head.
A return to the top of the red channel would take daily RSI to the purple midline. On negative divergence, that could easily line up with the white 1.618.
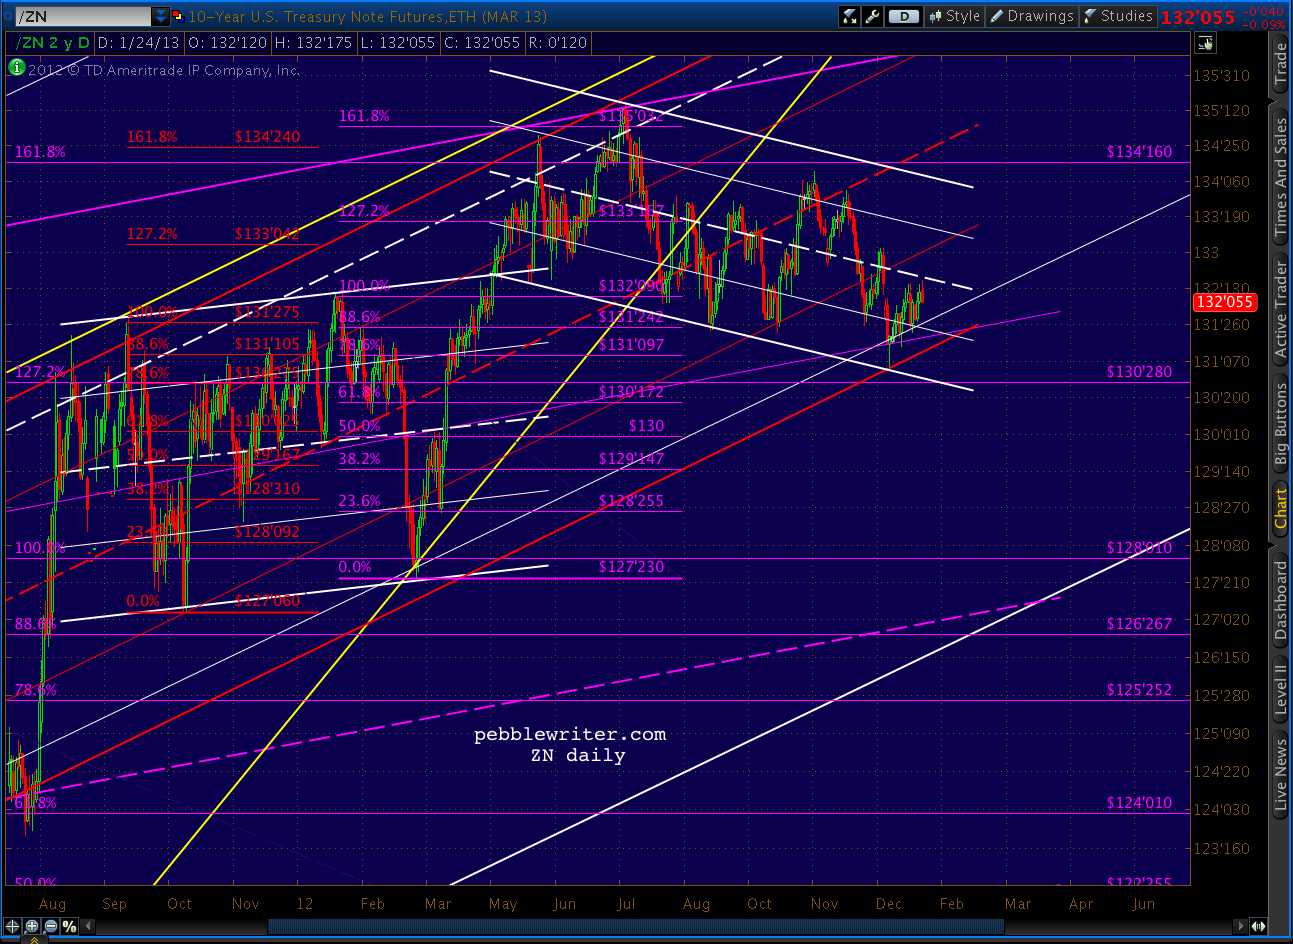
The close-up shows a potential channel since the most recent Crab Pattern reversal and the impact of the white 25% channel line. The easiest call is for a bounce off this line as well as the small channel bottom. If that occurs, the 138'170 level is in the cards.
Otherwise, the bottom of the white channel and the middle of the purple channel intersect at the 126-127 area (the purple .886 is 126'267 and the white .886 is 126'285) around the middle of March.


