Everyone's heard the expression: "the markets can stay irrational longer than you can stay solvent." Most of us have lost money on occasion by not observing that truism -- watching markets veering off on a tangent from our brilliantly calculated forecasts.
But what about the Yin to that Yang? Every once in a while, the market does exactly what I expect -- but in a way that makes me question the results. This morning's ramp was like that.
Although we went long last Friday at 1426 with an initial target of 1455.80 on the way higher, the action of the EURUSD and DX this morning had me thinking about fading this rally.
At times like this, it's best to let the market prove itself. Find a channel you can live with, and resolve to not even think about bailing unless the market breaks from that channel. Keep an eye on divergence -- a great early warning tool. And, as always, use stops wisely.
It's fine to be nervous when there are inconsistencies between markets. But, those excesses (usually stocks getting ahead of themselves) can yield some of the juiciest returns. If my thinking was sound in the first place and I follow my own advice, there's no reason to second-guess the results.
reposted from pebblewriter.com...
ORIGINAL POST: 7:45 AM
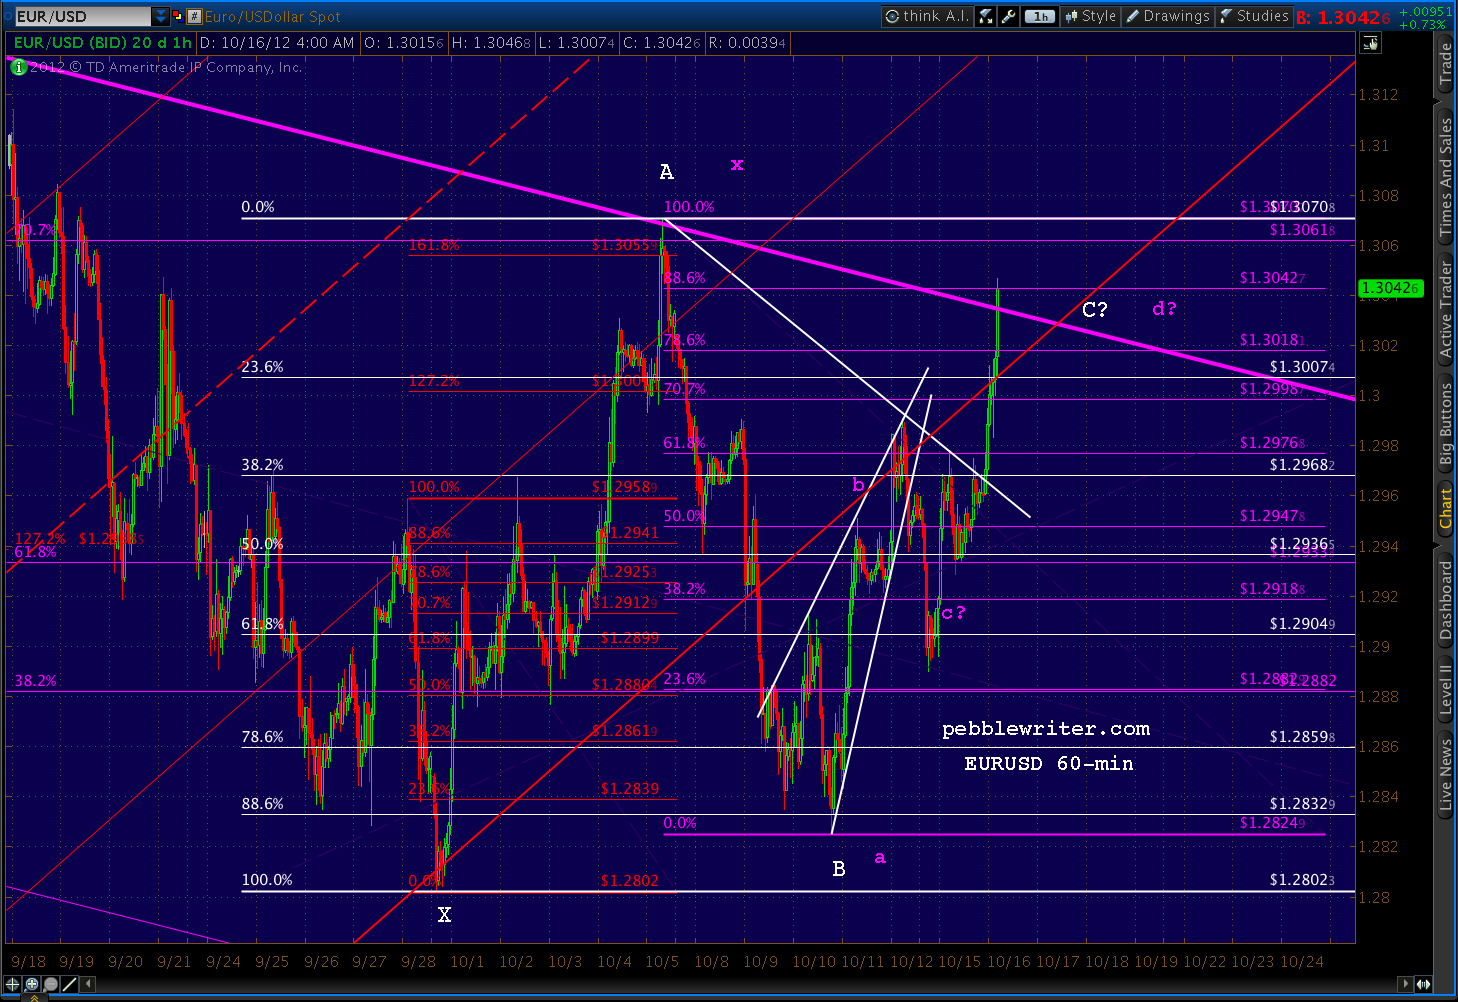
EURUSD has reached our targets (C? and d? below) two days ahead of schedule, but has also reached serious resistance just beyond the .886 of the decline since the 5th and is bumping up against the long-term channel.
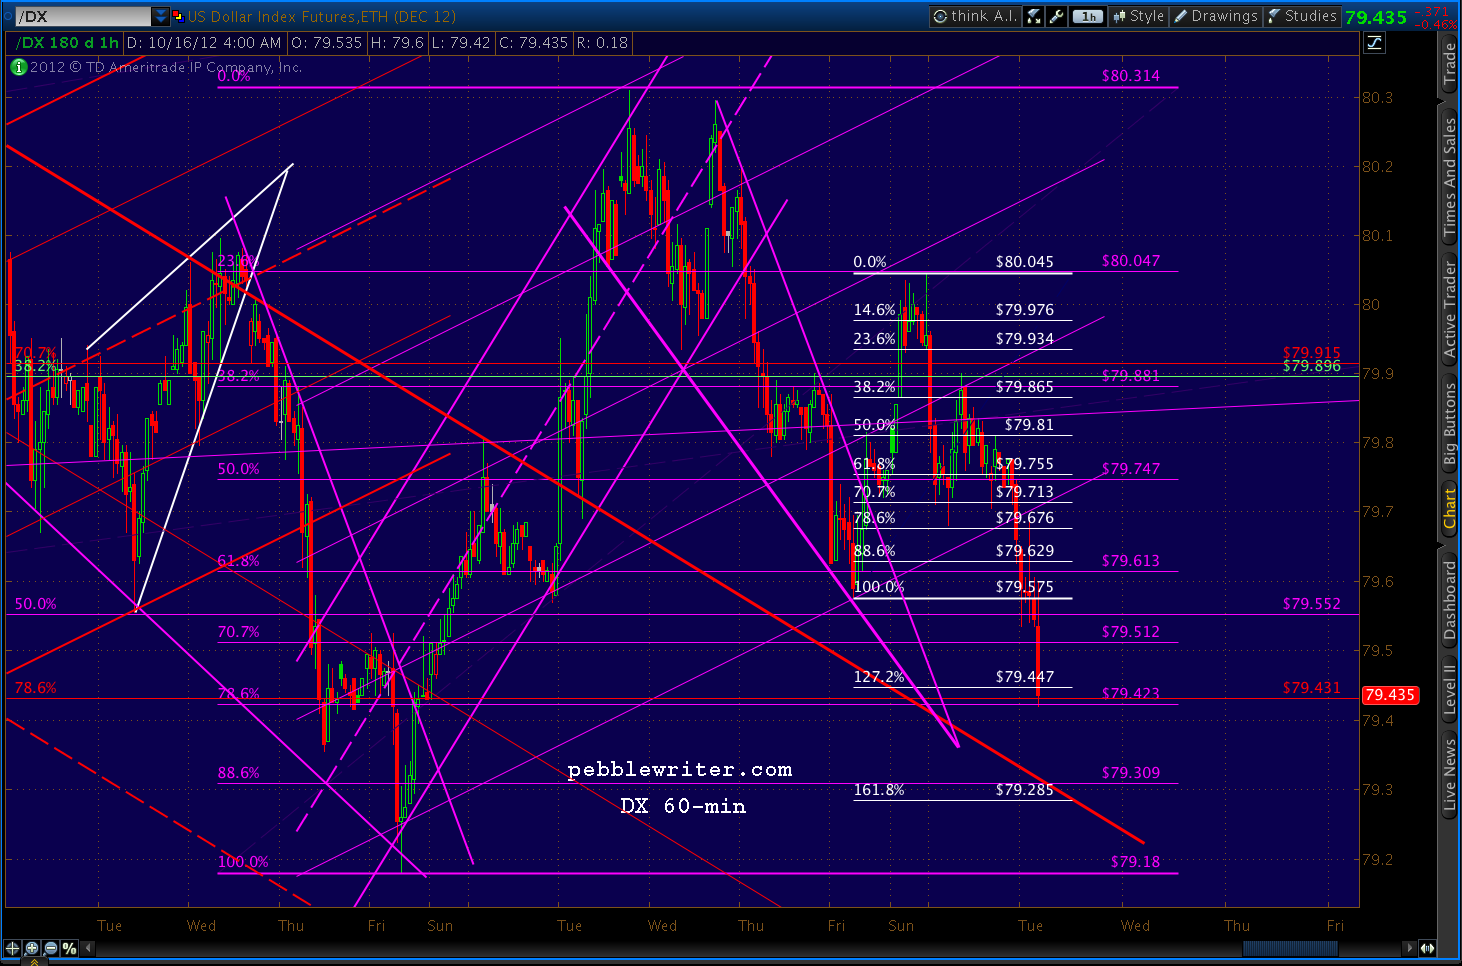
The dollar has also reached a potential turning point, the .786 of the rise since the 5th for a potential Gartley -- though the potential exists for a Bat completion down at 79.309.
UPDATE: 9:50 AM
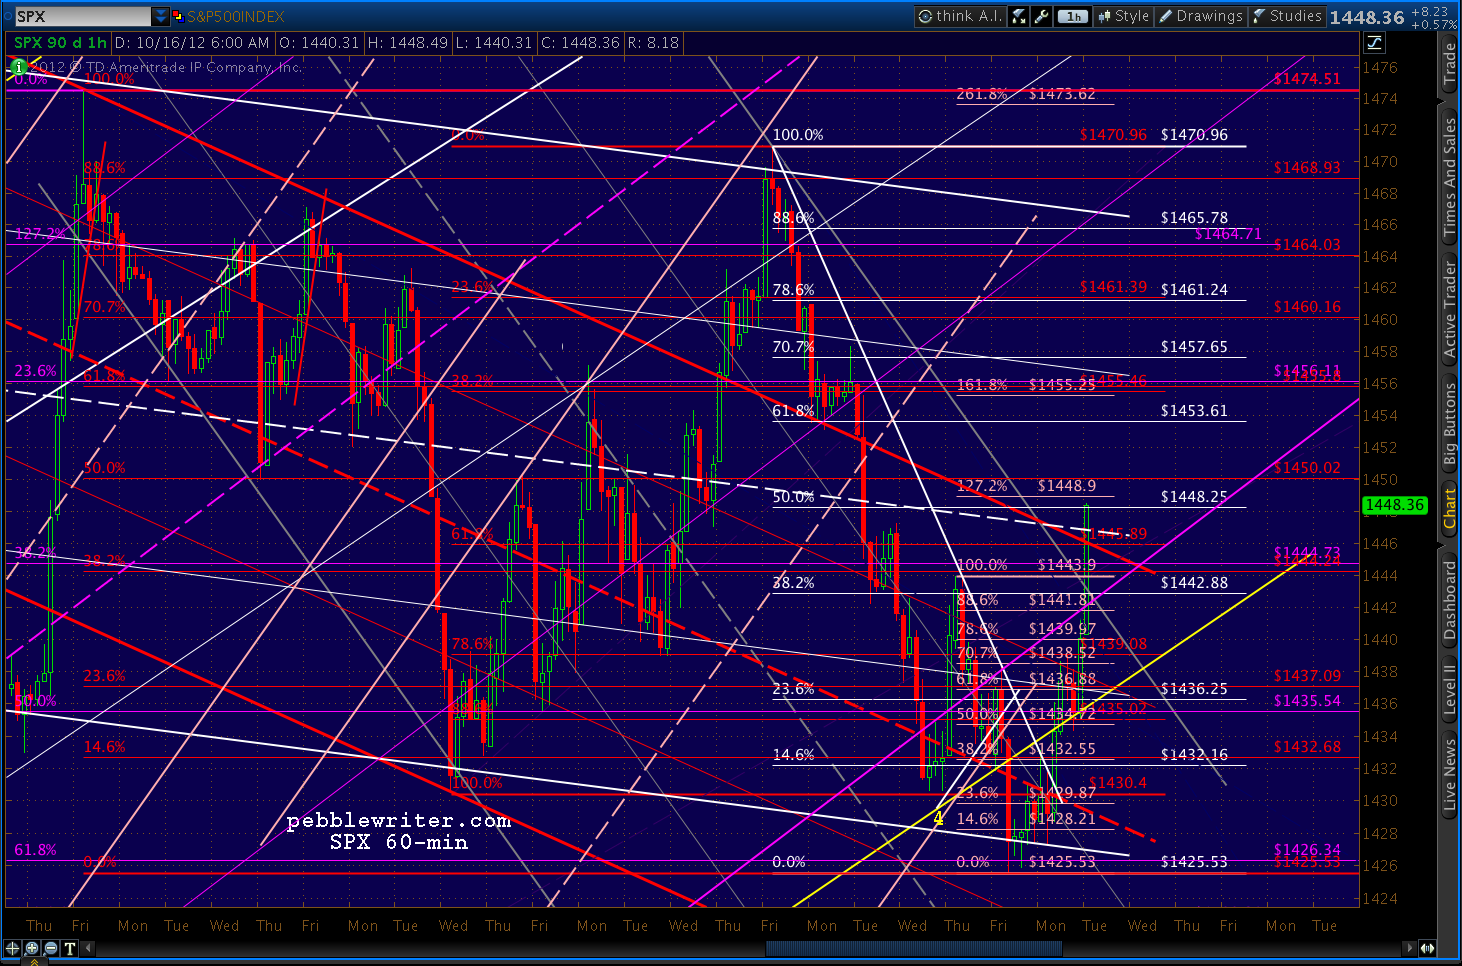
We've reached the top of the former red channel and the white channel midline. If we break through here, look for at least a back test of either/both.
UPDATE: 10:05 AM
Just topped 1450 and the .500 Fib of the 1474 to 1425 drop. This would be a likely spot for the market to turn. If it pushes any further, the first .618 is just ahead at 1453.61.
EURUSD just tagged the original apex of the rising wedge from last week -- still hasn't broken through the last high and is beginning to look quite extended.
DX hasn't quite reached its .886/1.618 channel back-test at 79.309. However, it did also reach its apex from last week. It's not only not moving inversely to equities at the moment, it's actually strengthening.
When SPX turns, don't be surprised if we get a back-test all the way to 1443-1445.
UPDATE: 11:05 AM
This is likely the final thrust. Two .618's just ahead: the .618 of 1470-1425 drop @ 1453.61 and the .618 of the 1474 to 1425 drop is 1455.80. The .382 of the 1430-1470 is right in there, too, at 1455.46. The higher target level of 1455ish is therefore the more likely.
We probably need a pull-back first to gather strength. SPX is running on fumes as it is. Yet, there's still no negative divergence to be seen on any time frame. So, if/when we pull back, the prognosis is for more upside.
Haven't decided yet whether to play the expected pull back from 1455 to 1434ish. Probably so, as the last time SPX tagged a .618 after a big ramp like this (morning of Oct 1, retraced .618 of 1474-1430 on its way to completing a Bat at 1470) it tumbled a good 18 points.
That .618 tag, by the way, came up .57 short. With this one, don't be surprised if we also turn before quite reaching it.
UPDATE: 12:10 PM
There would have been nothing wrong with taking profits at 1447 on the opening. We went long last week at 1426, so it would have made for a nice 1.5% addition to a month where we're already up 10%. But, 2% is better. And, those half percents here and there really add up.
We won't get all of them, but if we get enough of them over the course of a week/month/year, they can easily add 10-20% annually -- making up for some of the many times when the market doesn't do what I expect.
Join pebblewriter.com now to take advantage of our unique harmonic and chart pattern-based technical analysis that has produced dramatic results: +75% since inception March 22, 2012 for our unleveraged model portfolio.
Discounted annual memberships are available until the opening bell on Wednesday, October 17.
But what about the Yin to that Yang? Every once in a while, the market does exactly what I expect -- but in a way that makes me question the results. This morning's ramp was like that.
Although we went long last Friday at 1426 with an initial target of 1455.80 on the way higher, the action of the EURUSD and DX this morning had me thinking about fading this rally.
At times like this, it's best to let the market prove itself. Find a channel you can live with, and resolve to not even think about bailing unless the market breaks from that channel. Keep an eye on divergence -- a great early warning tool. And, as always, use stops wisely.
It's fine to be nervous when there are inconsistencies between markets. But, those excesses (usually stocks getting ahead of themselves) can yield some of the juiciest returns. If my thinking was sound in the first place and I follow my own advice, there's no reason to second-guess the results.
* * * * * * * * * * * * *
reposted from pebblewriter.com...
note: we entered this morning's session long SPX from Friday [see: CIW Oct 12] after capturing 54 points since our Oct 5 short at 1469 [see: Target 2.]
ORIGINAL POST: 7:45 AM
I'll likely fade this rally. The prospect of a breakout is there, but
there's just as great a chance that it falls back. Best to follow with
tight stops and see where it takes us.
EURUSD has reached our targets (C? and d? below) two days ahead of schedule, but has also reached serious resistance just beyond the .886 of the decline since the 5th and is bumping up against the long-term channel.
The dollar has also reached a potential turning point, the .786 of the rise since the 5th for a potential Gartley -- though the potential exists for a Bat completion down at 79.309.
UPDATE: 9:50 AM
We've reached the top of the former red channel and the white channel midline. If we break through here, look for at least a back test of either/both.
The
currencies are standing back and watching, meaning this rally is
nearing a pause at least, and likely needs to gather more strength
before advancing any further. I'm guessing this is just about it for now,
and am raising my stops to 1449.
UPDATE: 10:05 AM
Just topped 1450 and the .500 Fib of the 1474 to 1425 drop. This would be a likely spot for the market to turn. If it pushes any further, the first .618 is just ahead at 1453.61.
EURUSD just tagged the original apex of the rising wedge from last week -- still hasn't broken through the last high and is beginning to look quite extended.
DX hasn't quite reached its .886/1.618 channel back-test at 79.309. However, it did also reach its apex from last week. It's not only not moving inversely to equities at the moment, it's actually strengthening.
When SPX turns, don't be surprised if we get a back-test all the way to 1443-1445.
UPDATE: 11:05 AM
This is likely the final thrust. Two .618's just ahead: the .618 of 1470-1425 drop @ 1453.61 and the .618 of the 1474 to 1425 drop is 1455.80. The .382 of the 1430-1470 is right in there, too, at 1455.46. The higher target level of 1455ish is therefore the more likely.
We probably need a pull-back first to gather strength. SPX is running on fumes as it is. Yet, there's still no negative divergence to be seen on any time frame. So, if/when we pull back, the prognosis is for more upside.
Haven't decided yet whether to play the expected pull back from 1455 to 1434ish. Probably so, as the last time SPX tagged a .618 after a big ramp like this (morning of Oct 1, retraced .618 of 1474-1430 on its way to completing a Bat at 1470) it tumbled a good 18 points.
That .618 tag, by the way, came up .57 short. With this one, don't be surprised if we also turn before quite reaching it.
UPDATE: 12:10 PM
We just tagged 1455.51, which is good enough for me. I'm taking profits on the longs we established last Friday at 1426. I'll try a little short position to play the downside over the next day or two (tight stops, though!) Forecast for the rest of the week coming up...
* * * * * * * * * * * * *
There would have been nothing wrong with taking profits at 1447 on the opening. We went long last week at 1426, so it would have made for a nice 1.5% addition to a month where we're already up 10%. But, 2% is better. And, those half percents here and there really add up.
We won't get all of them, but if we get enough of them over the course of a week/month/year, they can easily add 10-20% annually -- making up for some of the many times when the market doesn't do what I expect.
Join pebblewriter.com now to take advantage of our unique harmonic and chart pattern-based technical analysis that has produced dramatic results: +75% since inception March 22, 2012 for our unleveraged model portfolio.
Discounted annual memberships are available until the opening bell on Wednesday, October 17.
Click here for more information.


