I had a phone call from an old Wall Street buddy this afternoon. He's a big money manager, runs large pension plans and such. He's very smart. And, he's been earning seven figures for years, so I assume he's still held in high regard.
After the requisite catching up, we got to talking about the market. We're both CFA's and received our MBA's from the same business school, so we're equally well-trained in fundamental analysis, economics, MPT, CAPM, etc. -- just like 98% of the analysts and portfolio managers on Wall Street.
You've seen them. They're on every trading floor in every investment bank, not to mention all the window/corner offices. They sit courtside with their clients at Knicks and Lakers games, get their pictures in Insitutional Investor and are interviewed by Trish Regan and Erin Burnett. They live large.
Technical analysts tend to sit in temporary space -- generally windowless and out of sight of the real analysts. They speak oddly and dress shabbily because they're rarely allowed to meet or talk with actual clients. If interviewed, it's by old guys whose age can be determined by their number of chins, like redwoods.
My friend is a traditional guy, so he uses fundamental analysis exclusively, while I... well, I usually ignore it. It's not that I think it's worthless. It's just that I support my family with the results of my daily trading. So, I need to actually make money.
As I explained technical analysis, chart patterns and harmonics, my friend began to sound concerned for my welfare. I swear I could hear him typing instructions to one of his secretaries to send me a complimentary copy of A Random Walk Down Wall Street.
Suddenly, the clicking of his keyboard came to a screeching halt. He asked me to repeat myself. I did, explaining again that our techniques have done pretty darned well the past six months -- about 66% since the new pebblewriter.com was birthed last March 22 [see: Results.]
"But, you're a bear" he sputtered. He's right, I am. In my opinion, the economic road ahead has potholes almost as huge as the Fed's hubris. At some point, the market will begin to reflect reality. But, that doesn't mean we can't play the upside when the charts suggest it -- as on March 18 when technical (not fundamental) analysis suggested an upside of 1472 [see: Big Picture.]
Of course, I also play the downside when it makes sense -- like the tops we called on September 14 at 1474, May 1 at 1415 and July 21, 2011 at 1347. Once in a while, technical analysis offers a great forecast for a series of moves, like the amazing 2011 as 2007 analog or the more recent 2012 as 2010 analog. These are less frequent, but when they hit they're a thing of beauty.
I guess I finally wore him down, because my friend is now a pebblewriter.com member. He knows better than to discuss Gartley Patterns or Fibonacci Time Ratios in an investment committee meeting (he likes his corner office), but he finds technical analysis "interesting," even if promulgated by nut jobs who can't get a table at Le Bernardin.
ORIGINAL POST: 9:00 AM
EURUSD running out of steam... Would love to short around 1.2971.
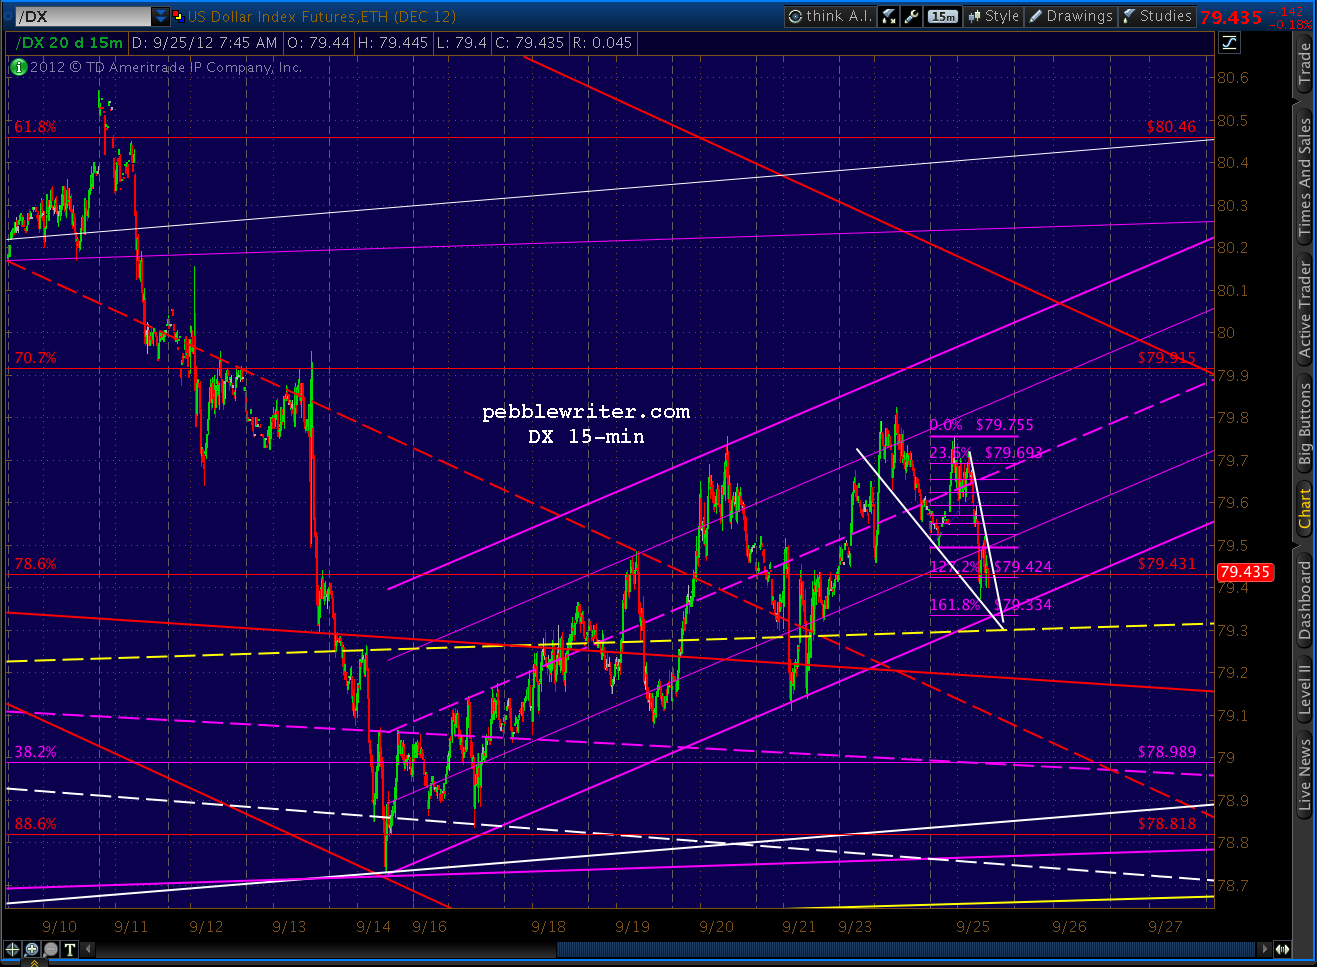
DX finding support for continued push higher...stands a very good chance of breaking out of the channel today or tomorrow... I'm an aggressive buyer at 79.33.
e-minis hitting resistance...
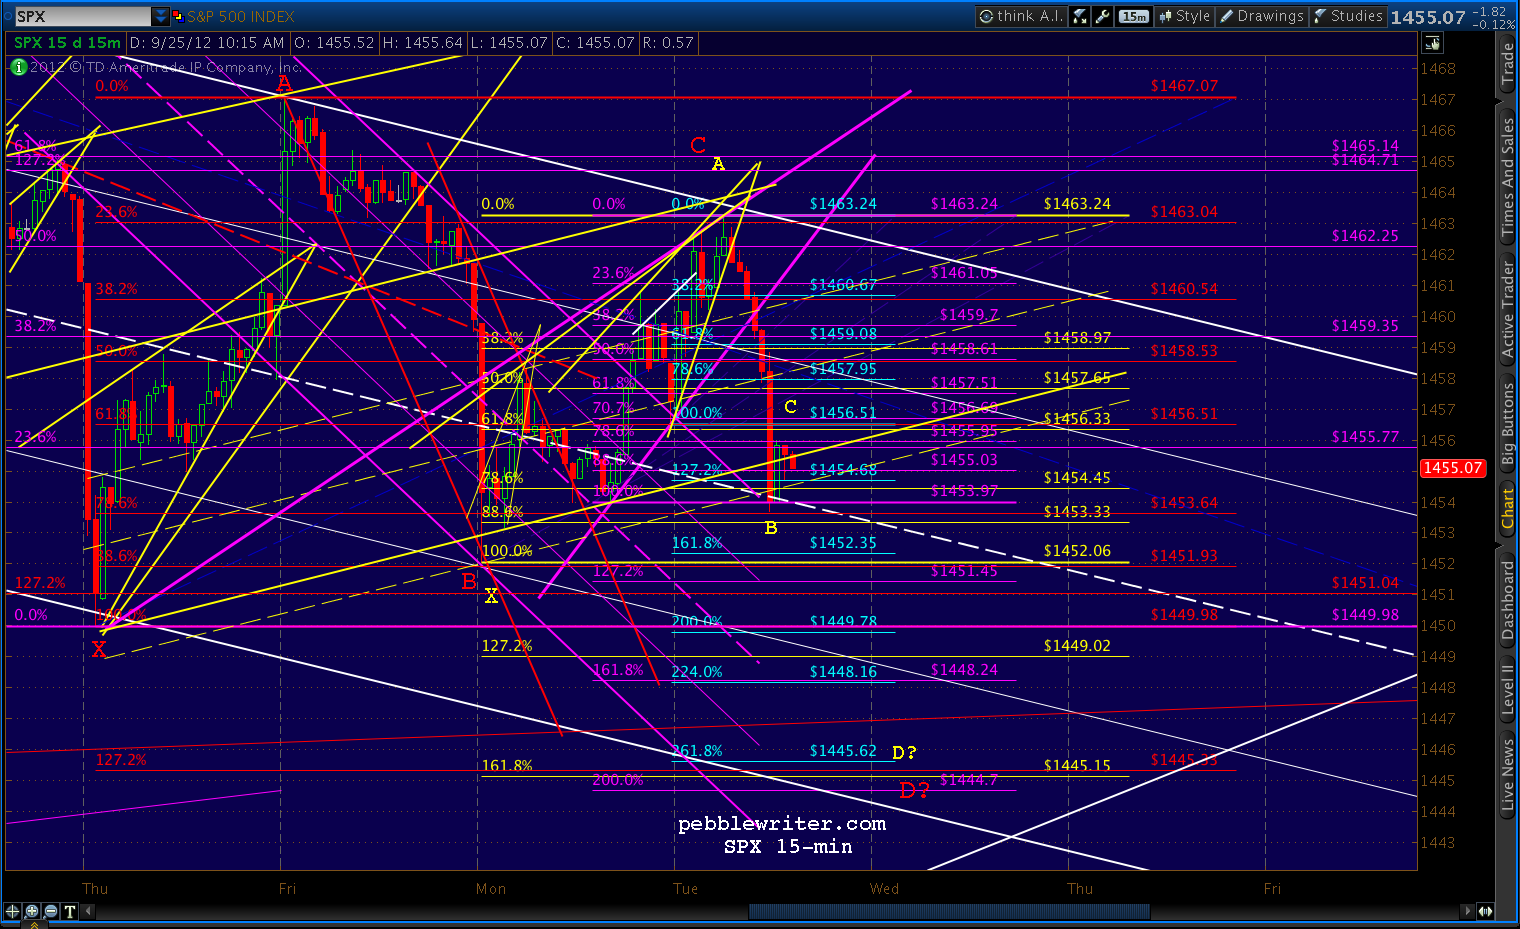
Fading this rally unless we break out of the triangle... currently ranges from 1454-1464 with apex of 1459 on Friday. Decent chance we'll tag the upper bound at 1463-1464 before reversing...
More after the open.
UPDATE: 10:20 AM
Ideal spot for reversal: the .786 and white channel bound at 1463.86.
UPDATE: 10:40 AM
EURUSD in the final throws -- looking for a butterfly completion at the top of the channel in a rising wedge. Should get a reversal between now and 1:00 PM EDT, ideally at 1.2970. Immediate potential to the bottom of the channel -- currently around 1.28.
The dollar is similarly working towards a Crab Pattern completion at the lower bound of its channel -- while in a falling wedge. Idealized reversal would be at 79.334 between 12-2 PM EDT.
Immediate potential to the top of the two channels (small purple and larger red) around 80.06.
SPX is completing a rising wedge at the upper (white) channel bound -- harmonic targets for 1.618/.886/.786 patterns between 1463.32-1463.86.
UPDATE: 11:20 AM
Any minute now...
UPDATE: 12:00 PM
Each of this morning's targets was reached. Should get some back tests, but the next move is down.
The rising wedge on SPX broke down and it just broke through the support I was worried about -- the lower bound of a larger rising wedge (purple.)
The EURUSD rising wedge broke down, peaking within .0002 of our 1.2971 target.
DX broke out of its falling wedge higher than I anticipated, at 79.375 rather than 79.334. I have redrawn the channel to reflect the new bottom -- ignoring the after-hours plunge on the 21st.
SPX and DJIA should turn negative on the day very soon.
I hope everyone was able to make a few bucks this morning. Downside targets coming up in a few minutes...
UPDATE: 1:20 PM
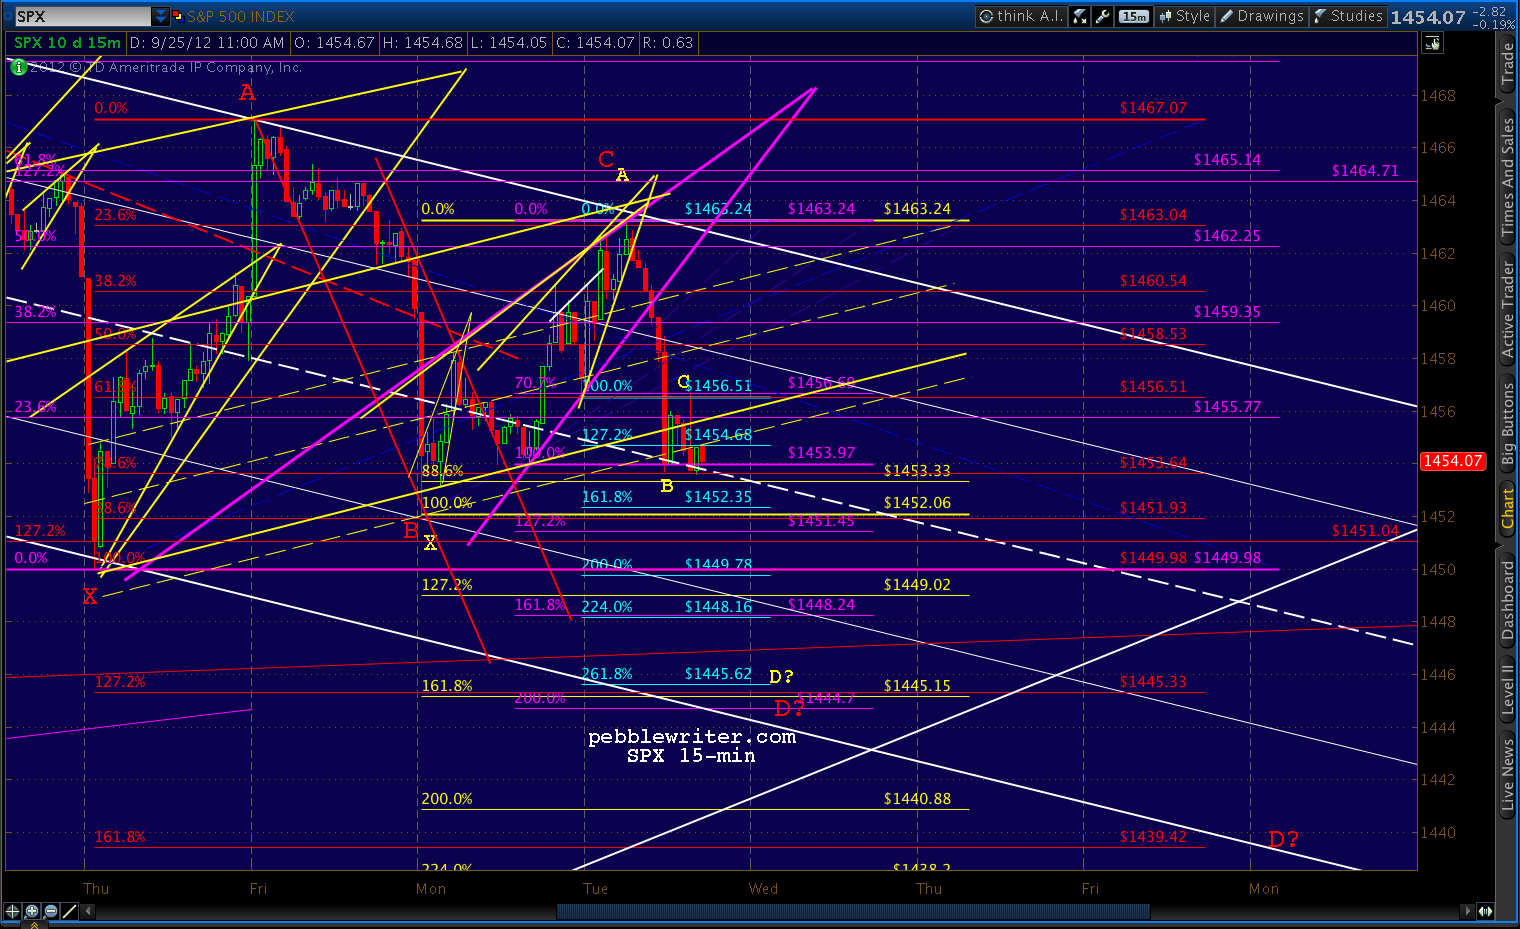
The harmonics are shaping up pretty nicely, with multiple patterns targeting the same area -- my 1444-1446 target from last week.
This is a pretty busy chart. But, focus on the red and the yellow grids. The red 1.272 and the yellow 1.618 intersect there today -- with the potential red Crab Pattern (B is at the .886) targeting 1439 by Monday the 1st.
UPDATE: 1:55 PM
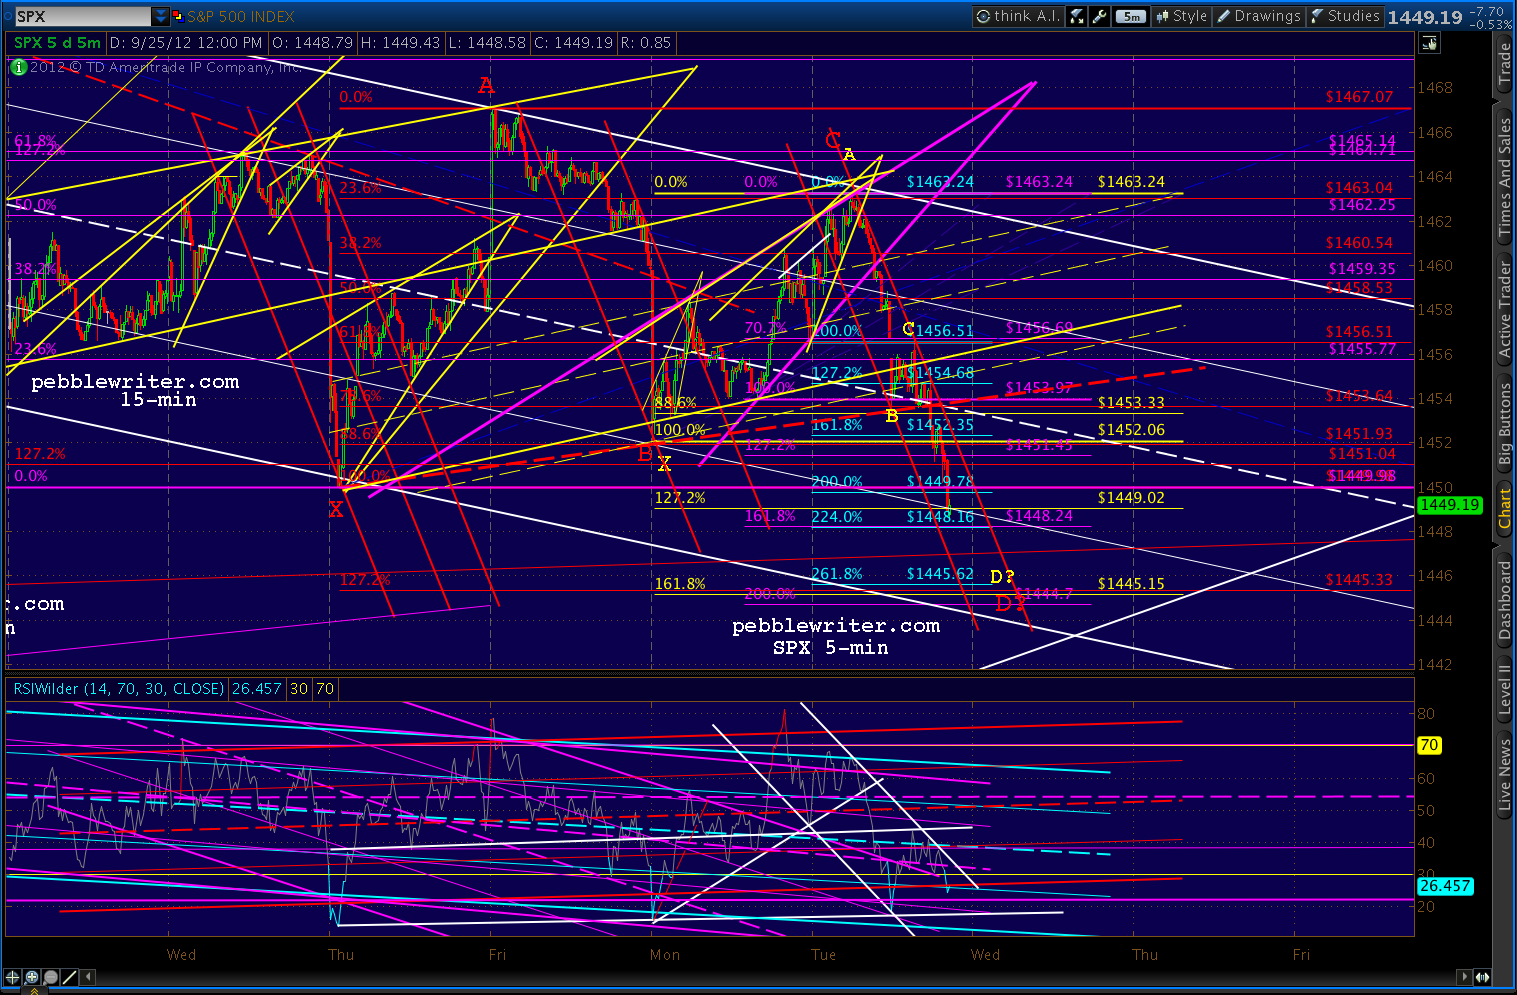
We dropped to the white channel midline and got a bounce there -- back-testing the .618 of the red Crab Pattern (where I had charted the yellow Crab's Point C.) We also back-tested one of our broken yellow channel lines.
If we can punch through the white channel midline currently at 1553.82 we can call the back-test over and get on with the downside. We should next run into support around 1452 -- the previous low -- but have the potential to get as low as 1448-1449 by the end of the day and still stay within the red channel down and our large white channel.
This is a very narrow channel within which we're falling, and we'll need to turn down again within the next few minutes if we're to keep it that way. I believe we will.
No idea what the overall wave count is, but the initial move down from 1463 to 1453 looks like a wave 1 to me -- meaning the bigger, faster wave 3 is still ahead of us.
More in a few...
UPDATE: 2:25 PM
Just took out the previous low of 1452.06. We might get a back-test of the white midline up to 1453.60, but it's not necessary.
Next white channel line is 1449. But, the previous low (Sep 20) is 1449.98. Expect at least a bounce there.
UPDATE: 3:00 PM
There's the next white channel line. The 5-min RSI channel that shows plenty of room for a bounce -- and plenty of room for the 1445 target -- probably with positive divergence -- but we'll take another look when we get there.
It's also the 1.618 of the small purple pattern and the 2.24 of the light blue pattern. The bottom of the white channel is just below at 1444.37 -- right next to the yellow pattern 1.618 at 1445.15 and the red pattern 1.272 at 1445.33.
While it's possible we'll break beneath the channel bound, I don't really expect it. If we close in the vicinity of 1445, I'll close out my shorts and sit in cash overnight.
More in a few.
UPDATE: 3:15 PM
After the requisite catching up, we got to talking about the market. We're both CFA's and received our MBA's from the same business school, so we're equally well-trained in fundamental analysis, economics, MPT, CAPM, etc. -- just like 98% of the analysts and portfolio managers on Wall Street.
You've seen them. They're on every trading floor in every investment bank, not to mention all the window/corner offices. They sit courtside with their clients at Knicks and Lakers games, get their pictures in Insitutional Investor and are interviewed by Trish Regan and Erin Burnett. They live large.
Technical analysts tend to sit in temporary space -- generally windowless and out of sight of the real analysts. They speak oddly and dress shabbily because they're rarely allowed to meet or talk with actual clients. If interviewed, it's by old guys whose age can be determined by their number of chins, like redwoods.
My friend is a traditional guy, so he uses fundamental analysis exclusively, while I... well, I usually ignore it. It's not that I think it's worthless. It's just that I support my family with the results of my daily trading. So, I need to actually make money.
As I explained technical analysis, chart patterns and harmonics, my friend began to sound concerned for my welfare. I swear I could hear him typing instructions to one of his secretaries to send me a complimentary copy of A Random Walk Down Wall Street.
Suddenly, the clicking of his keyboard came to a screeching halt. He asked me to repeat myself. I did, explaining again that our techniques have done pretty darned well the past six months -- about 66% since the new pebblewriter.com was birthed last March 22 [see: Results.]
"But, you're a bear" he sputtered. He's right, I am. In my opinion, the economic road ahead has potholes almost as huge as the Fed's hubris. At some point, the market will begin to reflect reality. But, that doesn't mean we can't play the upside when the charts suggest it -- as on March 18 when technical (not fundamental) analysis suggested an upside of 1472 [see: Big Picture.]
Of course, I also play the downside when it makes sense -- like the tops we called on September 14 at 1474, May 1 at 1415 and July 21, 2011 at 1347. Once in a while, technical analysis offers a great forecast for a series of moves, like the amazing 2011 as 2007 analog or the more recent 2012 as 2010 analog. These are less frequent, but when they hit they're a thing of beauty.
I guess I finally wore him down, because my friend is now a pebblewriter.com member. He knows better than to discuss Gartley Patterns or Fibonacci Time Ratios in an investment committee meeting (he likes his corner office), but he finds technical analysis "interesting," even if promulgated by nut jobs who can't get a table at Le Bernardin.
* * * * * * * *
Have you joined pebblewriter.com yet? Here's what you missed earlier today.
Note, we originally shorted September 14 at 1474, but have played lots of bounces along the way -- earning 5.2% on a theoretical, unleveraged S&P 500 portfolio even though the index has dropped only 2.1%. All times are EDT.
EURUSD running out of steam... Would love to short around 1.2971.
DX finding support for continued push higher...stands a very good chance of breaking out of the channel today or tomorrow... I'm an aggressive buyer at 79.33.
e-minis hitting resistance...
Fading this rally unless we break out of the triangle... currently ranges from 1454-1464 with apex of 1459 on Friday. Decent chance we'll tag the upper bound at 1463-1464 before reversing...
More after the open.
UPDATE: 10:20 AM
Ideal spot for reversal: the .786 and white channel bound at 1463.86.
UPDATE: 10:40 AM
EURUSD in the final throws -- looking for a butterfly completion at the top of the channel in a rising wedge. Should get a reversal between now and 1:00 PM EDT, ideally at 1.2970. Immediate potential to the bottom of the channel -- currently around 1.28.
The dollar is similarly working towards a Crab Pattern completion at the lower bound of its channel -- while in a falling wedge. Idealized reversal would be at 79.334 between 12-2 PM EDT.
Immediate potential to the top of the two channels (small purple and larger red) around 80.06.
SPX is completing a rising wedge at the upper (white) channel bound -- harmonic targets for 1.618/.886/.786 patterns between 1463.32-1463.86.
UPDATE: 11:20 AM
Any minute now...
UPDATE: 12:00 PM
Each of this morning's targets was reached. Should get some back tests, but the next move is down.
The rising wedge on SPX broke down and it just broke through the support I was worried about -- the lower bound of a larger rising wedge (purple.)
The EURUSD rising wedge broke down, peaking within .0002 of our 1.2971 target.
DX broke out of its falling wedge higher than I anticipated, at 79.375 rather than 79.334. I have redrawn the channel to reflect the new bottom -- ignoring the after-hours plunge on the 21st.
SPX and DJIA should turn negative on the day very soon.
I hope everyone was able to make a few bucks this morning. Downside targets coming up in a few minutes...
UPDATE: 1:20 PM
The harmonics are shaping up pretty nicely, with multiple patterns targeting the same area -- my 1444-1446 target from last week.
This is a pretty busy chart. But, focus on the red and the yellow grids. The red 1.272 and the yellow 1.618 intersect there today -- with the potential red Crab Pattern (B is at the .886) targeting 1439 by Monday the 1st.
UPDATE: 1:55 PM
We dropped to the white channel midline and got a bounce there -- back-testing the .618 of the red Crab Pattern (where I had charted the yellow Crab's Point C.) We also back-tested one of our broken yellow channel lines.
If we can punch through the white channel midline currently at 1553.82 we can call the back-test over and get on with the downside. We should next run into support around 1452 -- the previous low -- but have the potential to get as low as 1448-1449 by the end of the day and still stay within the red channel down and our large white channel.
This is a very narrow channel within which we're falling, and we'll need to turn down again within the next few minutes if we're to keep it that way. I believe we will.
No idea what the overall wave count is, but the initial move down from 1463 to 1453 looks like a wave 1 to me -- meaning the bigger, faster wave 3 is still ahead of us.
More in a few...
UPDATE: 2:25 PM
Just took out the previous low of 1452.06. We might get a back-test of the white midline up to 1453.60, but it's not necessary.
Next white channel line is 1449. But, the previous low (Sep 20) is 1449.98. Expect at least a bounce there.
UPDATE: 3:00 PM
There's the next white channel line. The 5-min RSI channel that shows plenty of room for a bounce -- and plenty of room for the 1445 target -- probably with positive divergence -- but we'll take another look when we get there.
It's also the 1.618 of the small purple pattern and the 2.24 of the light blue pattern. The bottom of the white channel is just below at 1444.37 -- right next to the yellow pattern 1.618 at 1445.15 and the red pattern 1.272 at 1445.33.
While it's possible we'll break beneath the channel bound, I don't really expect it. If we close in the vicinity of 1445, I'll close out my shorts and sit in cash overnight.
More in a few.
UPDATE: 3:15 PM
Closing shorts here at 1444 and playing an expected bounce. Stops at 1443.


