PEBBLEWRITER.COM IS LIVE!


*************** PEBBLEWRITER.COM IS LIVE! TO SIGN UP, CLICK HERE ***************


Friday, September 28, 2012

3rd Quarter Results


UPDATED:  September 28, 2012

We're up 66.57% since inception -- a little over six months.   A competing "buy and hold" portfolio would have earned about 3.44%. It seems pebblewriter.com is still earning its keep.

Now that we have the QE3 decision behind us, directional trading is back on the table.  Personally, I won't miss the scalping and day trading.  Although we managed to earn 5.39% in August, and 11.93% in September, it was very labor intensive and did not lend itself to sound sleep. We can now (hopefully) get back to our evil plan to calmly out-earn the earnest and outwit the witless.

Q3 official results are in:  + 27.61% versus Q2's 38.46% and the S&P 500's 5.6%.   We didn't have the benefit of an analog this time; but, we did have all the lovely uncertainty surrounding QE3 and ESM.  With those milestones under our belt, how difficult could the Fiscal Cliff and the November elections be?

I'll post mutual fund and hedge fund universe results as soon as they're available, but I'm not personally aware of any actively managed fund that has earned 66% in the past six months.  Best of all, we did it in a broadly diversified portfolio (long or short the S&P 500), with no options or futures, no leverage and without hitching our fortunes to the iPhone.

In celebration of another great quarter, we'll run a membership special this weekend!  Keep an eye on THIS PAGE for details. 


* * * * * * * * * * * * * * * *


Inception to date:                  +66.57%

S&P 500:                                +3.44%

Differential:                            +63.13%


More details and important disclosures here.


Wednesday, September 26, 2012

What'd You Miss?

I had a phone call from an old Wall Street buddy this afternoon.  He's a big money manager, runs large pension plans and such.  He's very smart.  And, he's been earning seven figures for years, so I assume he's still held in high regard.

After the requisite catching up, we got to talking about the market.  We're both CFA's and received our MBA's from the same business school, so we're equally well-trained in fundamental analysis, economics, MPT, CAPM, etc. -- just like 98% of the analysts and portfolio managers on Wall Street.

You've seen them.  They're on every trading floor in every investment bank, not to mention all the window/corner offices.  They sit courtside with their clients at Knicks and Lakers games, get their pictures in Insitutional Investor and are interviewed by Trish Regan and Erin Burnett. They live large.

Technical analysts tend to sit in temporary space -- generally windowless and out of sight of the real analysts.  They speak oddly and dress shabbily because they're rarely allowed to meet or talk with actual clients.  If interviewed, it's by old guys whose age can be determined by their number of chins, like redwoods.

My friend is a traditional guy, so he uses fundamental analysis exclusively, while I... well, I usually ignore it.  It's not that I think it's worthless.  It's just that I support my family with the results of my daily trading. So, I need to actually make money.

As I explained technical analysis, chart patterns and harmonics, my friend began to sound concerned for my welfare.  I swear I could hear him typing instructions to one of his secretaries to send me a complimentary copy of A Random Walk Down Wall Street.

Suddenly, the clicking of his keyboard came to a screeching halt.  He asked me to repeat myself.  I did, explaining again that our techniques have done pretty darned well the past six months  -- about 66% since the new pebblewriter.com was birthed last March 22 [see: Results.]

"But, you're a bear" he sputtered.  He's right, I am.  In my opinion, the economic road ahead has potholes almost as huge as the Fed's hubris.  At some point, the market will begin to reflect reality.  But, that doesn't mean we can't play the upside when the charts suggest it -- as on March 18 when technical (not fundamental) analysis suggested an upside of 1472 [see: Big Picture.] 

Of course, I also play the downside when it makes sense -- like the tops we called on September 14 at 1474, May 1 at 1415 and July 21, 2011 at 1347.  Once in a while, technical analysis offers a great forecast for a series of moves, like the amazing 2011 as 2007 analog or the more recent 2012 as 2010 analog.  These are less frequent, but when they hit they're a thing of beauty.

I guess I finally wore him down, because my friend is now a pebblewriter.com member.  He knows better than to discuss Gartley Patterns or Fibonacci Time Ratios in an investment committee meeting (he likes his corner office), but he finds technical analysis "interesting," even if promulgated by nut jobs who can't get a table at Le Bernardin.

* * * * * * * *

Have you joined pebblewriter.com yet?  Here's what you missed earlier today.  

Note, we originally shorted September 14 at 1474, but have played lots of bounces along the way -- earning 5.2% on a theoretical, unleveraged S&P 500 portfolio even though the index has dropped only 2.1%.  All times are EDT.


ORIGINAL POST:  9:00 AM

EURUSD running out of steam... Would love to short around 1.2971.


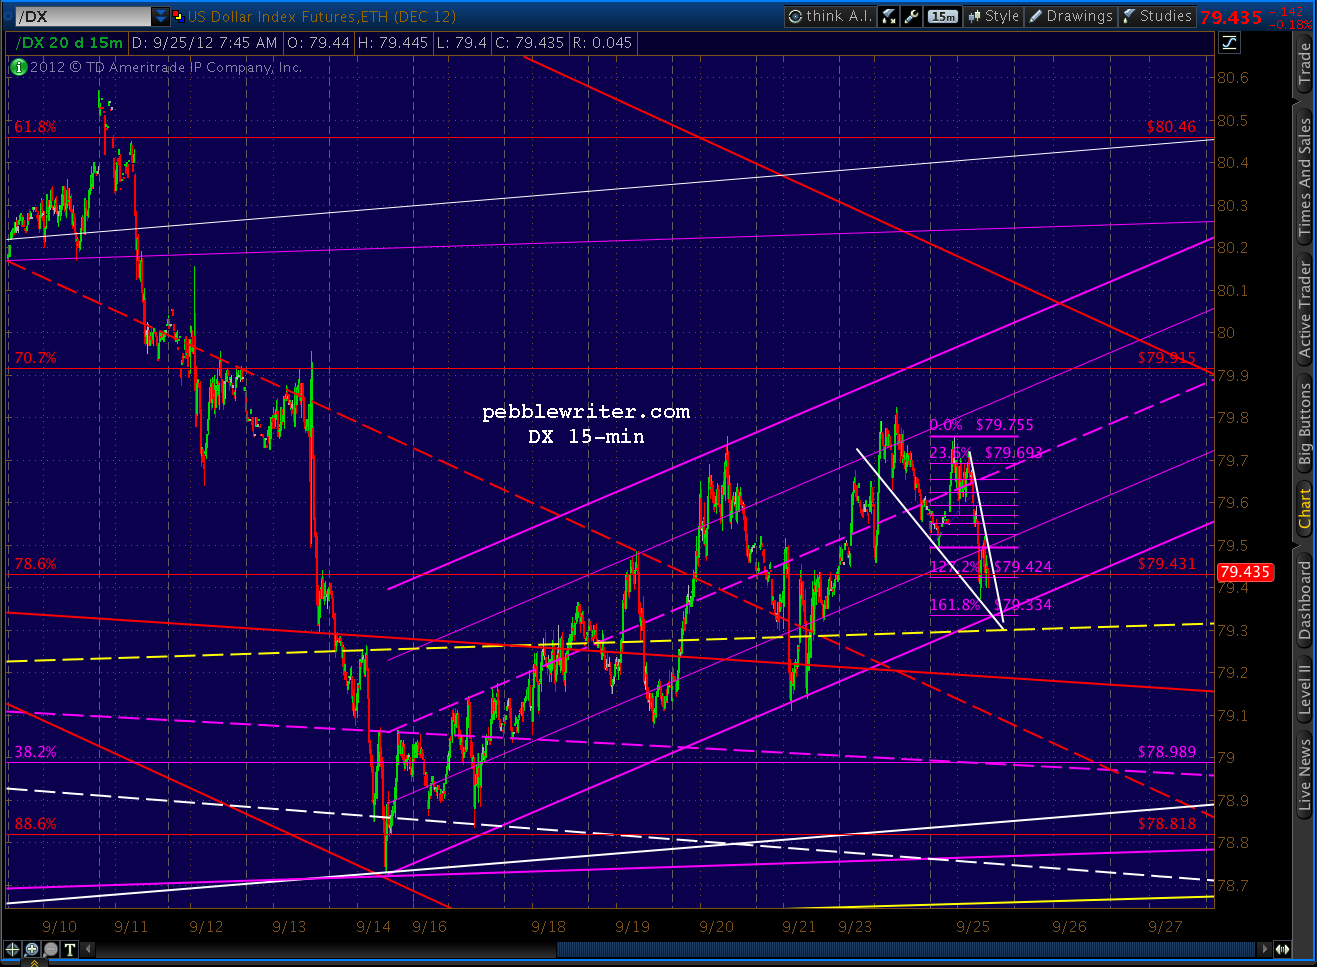
DX finding support for continued push higher...stands a very good chance of breaking out of the channel today or tomorrow...  I'm an aggressive buyer at 79.33.


e-minis hitting resistance...


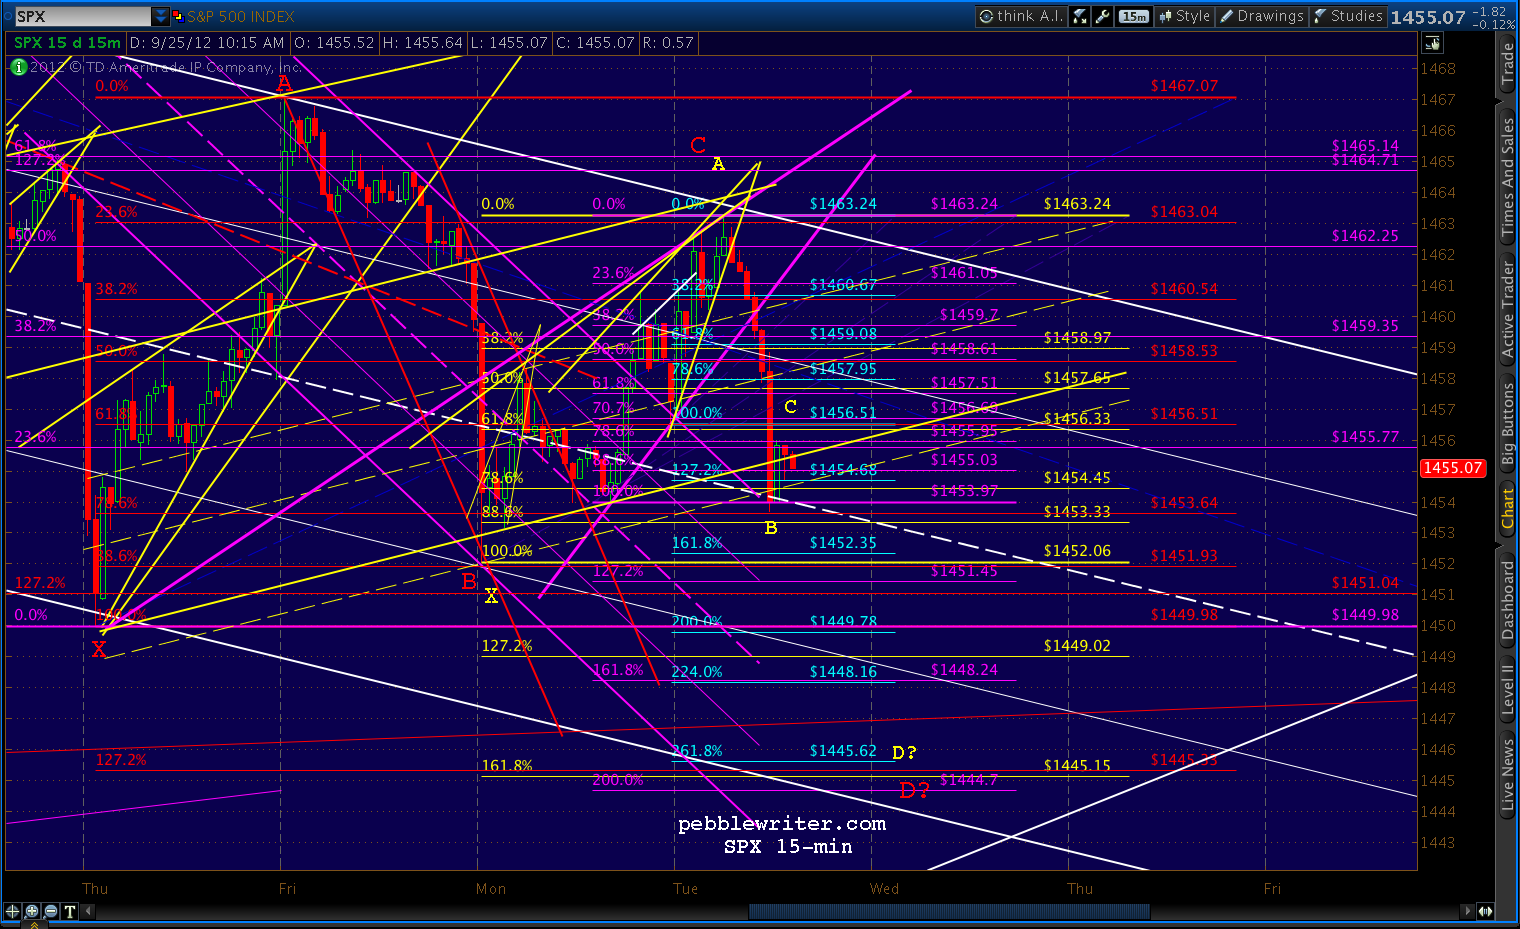
Fading this rally unless we break out of the triangle... currently ranges from 1454-1464 with apex of 1459 on Friday.  Decent chance we'll tag the upper bound at 1463-1464 before reversing...


More after the open.

UPDATE:  10:20 AM

Ideal spot for reversal: the .786 and white channel bound at 1463.86.


UPDATE:  10:40 AM

EURUSD in the final throws -- looking for a butterfly completion at the top of the channel in a rising wedge. Should get a reversal between now and 1:00 PM EDT, ideally at 1.2970.  Immediate potential to the bottom of the channel -- currently around 1.28.


The dollar is similarly working towards a Crab Pattern completion at the lower bound of its channel -- while in a falling wedge.  Idealized reversal would be at 79.334 between 12-2 PM EDT. 

Immediate potential to the top of the two channels (small purple and larger red) around 80.06.


SPX is completing a rising wedge at the upper (white) channel bound -- harmonic targets for 1.618/.886/.786  patterns between 1463.32-1463.86.


UPDATE:  11:20 AM

Any minute now...


UPDATE:  12:00 PM

Each of this morning's targets was reached.  Should get some back tests, but the next move is down.
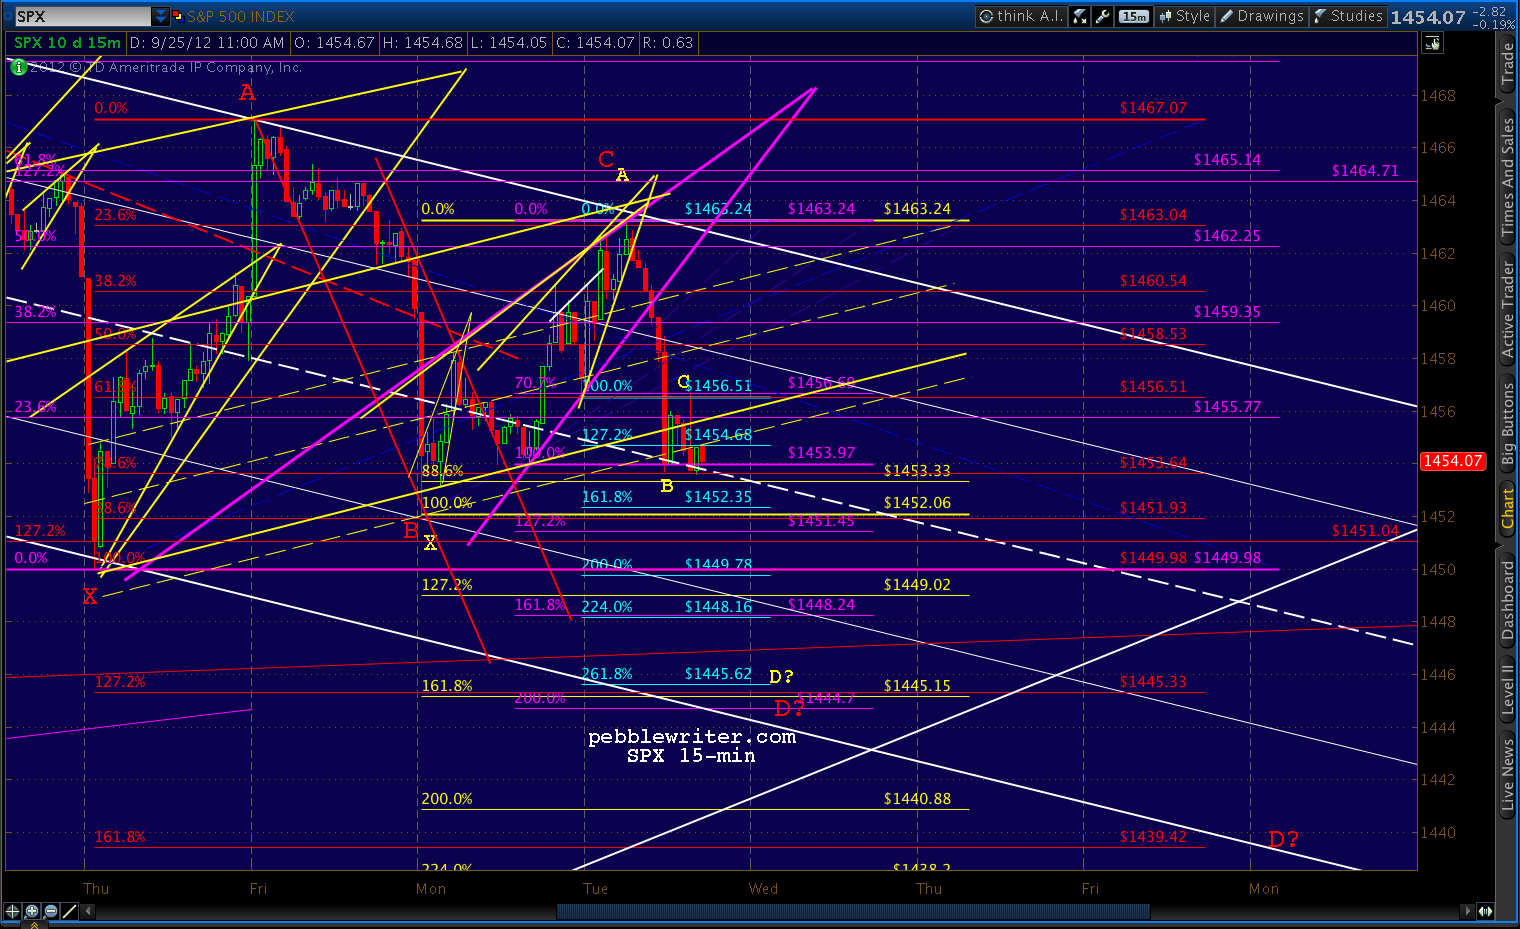
The rising wedge on SPX broke down and it just broke through the support I was worried about -- the lower bound of a larger rising wedge (purple.)


The EURUSD rising wedge broke down, peaking within .0002 of our 1.2971 target.


DX broke out of its falling wedge higher than I anticipated, at 79.375 rather than 79.334.  I have redrawn the channel to reflect the new bottom -- ignoring the after-hours plunge on the 21st.


SPX and DJIA should turn negative on the day very soon.

I hope everyone was able to make a few bucks this morning.  Downside targets coming up in a few minutes...

UPDATE:  1:20 PM

The harmonics are shaping up pretty nicely, with multiple patterns targeting the same area -- my 1444-1446 target from last week.


This is a pretty busy chart.  But, focus on the red and the yellow grids.  The red 1.272 and the yellow 1.618 intersect there today -- with the potential red Crab Pattern (B is at the .886) targeting 1439 by Monday the 1st.

UPDATE:  1:55 PM

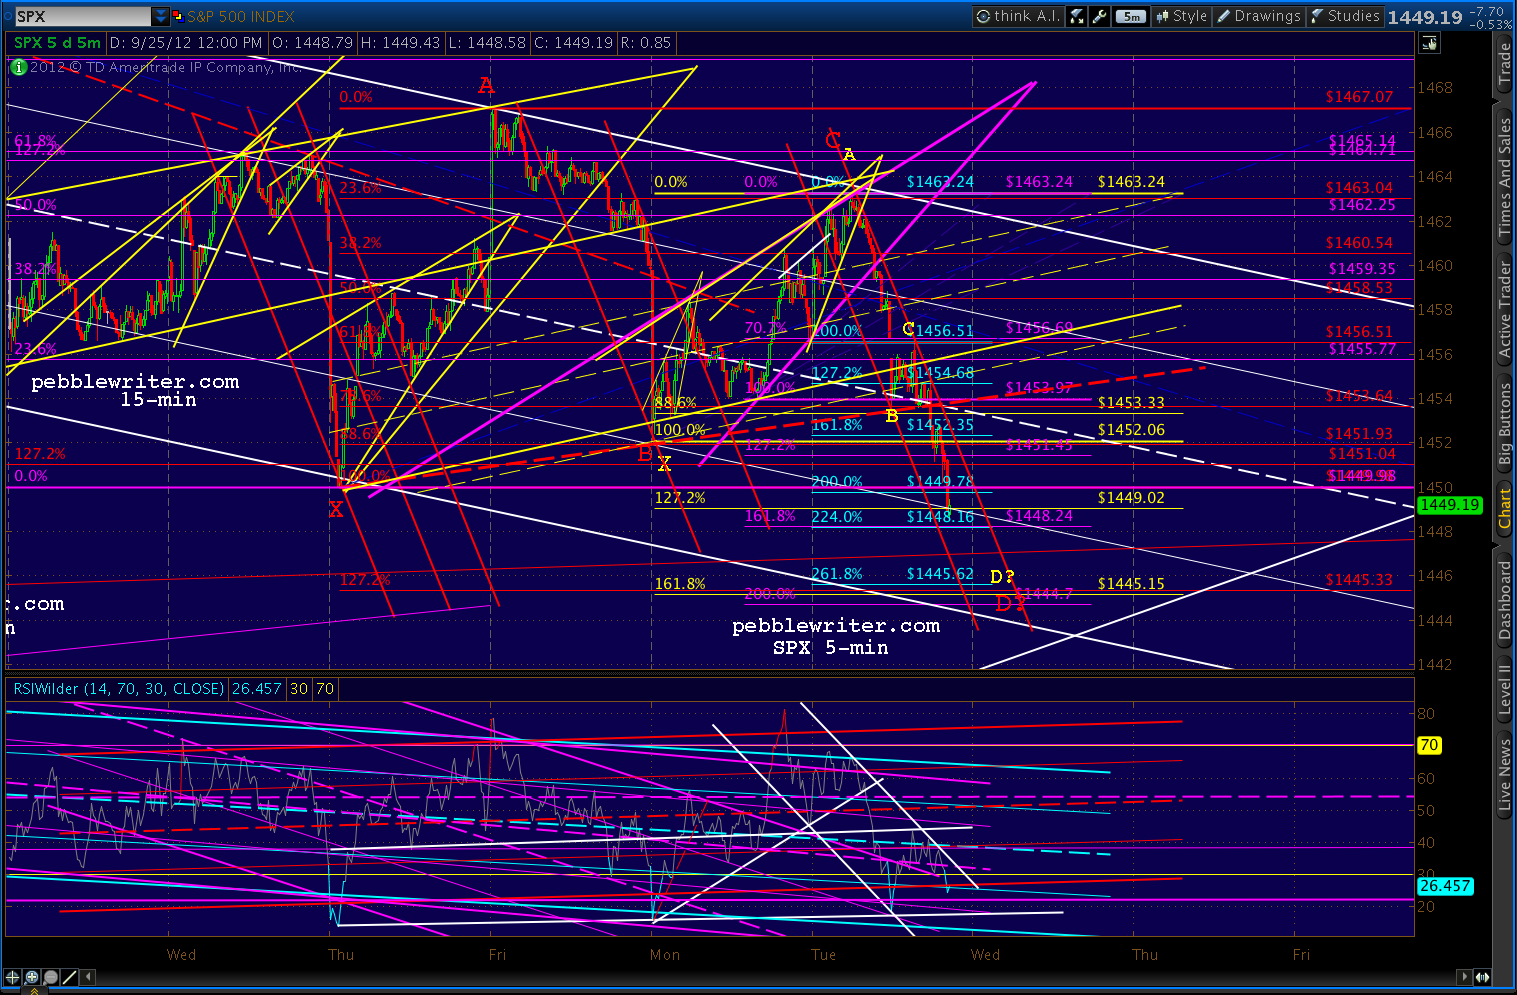
We dropped to the white channel midline and got a bounce there -- back-testing the .618 of the red Crab Pattern (where I had charted the yellow Crab's Point C.)  We also back-tested one of our broken yellow channel lines.


If we can punch through the white channel midline currently at 1553.82 we can call the back-test over and get on with the downside.  We should next run into support around 1452 -- the previous low -- but have the potential to get as low as 1448-1449 by the end of the day and still stay within the red channel down and our large white channel.

This is a very narrow channel within which we're falling, and we'll need to turn down again within the next few minutes if we're to keep it that way.  I believe we will.


No idea what the overall wave count is, but the initial move down from 1463 to 1453 looks like a wave 1 to me -- meaning the bigger, faster wave 3 is still ahead of us.

More in a few...

UPDATE:  2:25 PM

Just took out the previous low of 1452.06.  We might get a back-test of the white midline up to 1453.60, but it's not necessary.


Next white channel line is 1449.  But, the previous low (Sep 20) is 1449.98.  Expect at least a bounce there.

UPDATE:  3:00 PM

There's the next white channel line.  The 5-min RSI channel that shows plenty of room for a bounce -- and plenty of room for the 1445 target -- probably with positive divergence -- but we'll take another look when we get there.


It's also the 1.618 of the small purple pattern and the 2.24 of the light blue pattern.  The bottom of the white channel is just below at 1444.37 -- right next to the yellow pattern 1.618 at 1445.15 and the red pattern 1.272 at 1445.33.

While it's possible we'll break beneath the channel bound, I don't really expect it.  If we close in the vicinity of 1445, I'll close out my shorts and sit in cash overnight.

More in a few.

UPDATE:  3:15 PM

Closing shorts here at 1444 and playing an expected bounce.  Stops at 1443.


Friday, September 14, 2012

The World According to Ben

reposted from pebblewriter.com...

The World According to Ben is inflationary.  It is confident.  Its citizens consumers buy stuff today because it might be too expensive tomorrow -- or, just for grins.  It's a world plagued not by irrational fears, but by irrational exuberance.  It's a return to those thrilling days of yesteryear, when nothing bad ever happened, as long as you owned a house (preferably 2-3) and borrowed money to fill that house with plasma televisions.

But, we've been down that road before.  Seems to me it didn't end terribly well.  Fortunes were lost, families were torn apart, lives were ruined when the bubble burst.  Ben would like us to think this time will be different, that the Fed is now watching so closely that such things as bubbles and busts could never happen again.

But, isn't it interesting that CPI just posted the biggest monthly spurt in over 2 years?  And, of course, that was before Benny's helicopter even lifted off.  As Zerohedge put it:
"In other words, the food inflation which is already spreading through the economy courtesy of the record drought, is about to be supported by some brand new Fed-generated inflation. Luckily, as yesterday, nobody uses gas or food."
Here's the chart of the day.   For those unfamiliar with Bat Patterns, learn more HERE.


Not all Bats signal huge reversals.  Since we put in a Point B at just under the .618 retracement, there's the possibility we're constructing a Crab Pattern that ultimately targets the 1.618 extension (2138.)

Point B could also have been the .786 reversal at 1370 in May 2011, which would indicate a Butterfly Pattern targeting the 1.272 (1823) or the 1.618.  On a scale this large, these are obviously patterns that could take years to play out.  And, we never use harmonic patterns in a vacuum; their targets must be supported by other technical analysis.

The last really big Bat Pattern we completed was in January of 2007, when SPX had retraced 88.6% of its 2000 - 2002 plunge from 1552 to 768.


There was a relatively minor pullback of only 98 points; but, it was certainly enough for traders to capitalize on.  Note the pullback to just below the previous Fibonacci level (the .786) was a nicely formed Crab Pattern -- one of our other favorites.


CHARTS:  9:40 AM

The dollar came oh-so-close to hitting our 78.818 target this morning.  Recall that this is the .886 of the larger red Bat Pattern (lot of Bats going around) and should provoke at least a bounce -- maybe much more.

The daily RSI shows how very oversold it is, but that doesn't mean it can't go lower -- simply that it is likely nearing at least an interim bottom.


Meanwhile, SPX is nearing our 1472 target. I will ease some stops into the equation as we approach it, as I'd like to remain long for as long as possible.  This is a 35 point gain since we went long yesterday at 1437 with the Fed's announcement.

continued on pebblewriter.com...

*  *  *  *  *  *  *  *

...for more info on subscribing to pebblewriter.com,  click here...

Tuesday, September 11, 2012

The Contest

Just for grins, let's give away some pebblewriter.com memberships.  Since we're likely to have some fireworks this week, I'm curious as to what folks are expecting.   From now through 6pm EDT on the 11th, submit your best guess as to the closing quote for the SPX on September 13th.

One entry only, please, and verified Disqus ID's only.   Post your entries on Disqus on The Contest post at pebblewriter.com.

Prizes are as follows:
  • closest to the mark:  one year membership
  • 2nd closest:         semi-annual membership
  • 3rd closest:               quarterly membership
First come, first served.  Once a particular number is posted, no one else may chose it.  I'll do my best to police these, but it's up to you to do your homework first.  And, while you're at it, impress us with the logic behind your reasoning.  I have some monthly membership awards to hand out for overwhelming brilliance, creativity or humor.

If you're already a member, you may use your award to extend your current membership or give it away to your favorite charity or a close friend.  All winners are responsible for any taxes, etc. on their winnings, entries are void where prohibited, and Fed governors are not eligible (unless you contact me first for a little "chat.")

If Disqus eats your entry, use the "contact me" form in the menu above and I'll post it for you as soon as I notice it.  Since GoDaddy isn't fully up to speed yet, you could also copy me at pebblescribe at gmail dot com to be on the safe side.

Remember, post entries on Disqus HERE, and good luck to all!


UPDATE:  6:45 PM

Here are the entries I've received, in chronological order, as of the deadline of 6:00 PM EDT.


The median is 1416.59, the mean is 1422.60 with a standard deviation is 35.  Our most bullish entry is from FLASHRIP at 1482, and our most bearish bear is Brett at 1345 -- meaning a whopping 6.2% tumble in the next 48 hours (ouch!)

Looks like 1411 attracted the most attention, with four entries around it;  1442-1449 had five, as did 1399-1404.  Lots of interesting and well-reasoned responses, and many who didn't dare tip off the competition as to the method behind their madness.

Thanks to all who entered.  I know well how intimidating it is to put your thoughts out there for everyone to appreciate/ridicule.  It'll be an interesting next couple of days.

Good luck everyone!

Monday, September 10, 2012

Spit, Bailing Wire and QE3

It's entirely likely the market will remain comatose for the next two days until the German constitutional court decision on the 12th and/or the FOMC announcements/press conference on the 13th.  IMHO, QE3 is very much baked into current prices; though, we should get at least a nice little pop if the central planners deliver as expected.

If not, expect a sizable sell-off unless Bernanke is able to let us down so easy as keep hopes very high ("we are postponing QE until October 12, at which point we will buy every POS bond in sight.") It's really that simple -- which, of course, renders both fundamental and technical analysis meaningless in the short run and turns any long/short decisions made today into a veritable coin toss.


The German court situation is similar.  Draghi's jawboning worked exceptionally well last week, producing a single-day 2.5 cent euro-bump versus the dollar that left it at least short-term overbought.  If, after adjusting their hats, the BVerfG reign (sic) on Draghi's parade, look for the overbought euro to become oversold sehr schnell.

I have no special insight into either event.  Though, as I wrote last week, Dow Jones put out an interesting statistic last week regarding employment data: over the past 28 years, the August NFP stats have missed expectations 3/4 of the time.  For the past 10 years, the average adjustment after the fact is 62K.

Not that I think the Fed harbors any illusions about QE actually addressing the stifling unemployment in this country (yes, I'm cynical), but if they're attempting to at least make it look good...this might play into their decision.  Their vastly greater concern is a stock market running on fumes and unbelievably leveraged banks whose solvency hinges on perpetuating the myth that their trillions in derivatives aren't a bad hair day away from implosion [see: The Wipeout Ratio.]

Then, there's the small matter of the election only eight weeks away from tomorrow.  The Republicans have stepped up Fed-centric rhetoric of late, practically guaranteeing an Eccles Building house cleaning if elected (though I suspect they're only trying to entice Paulies into the tent.)

At the end of the day, the Fed is at least as concerned with self-preservation as any other body politic.  After throwing "We the People"  under the bus for their friends on Wall Street, it's hard to imagine them falling on their swords now for the sake of the economy (did I mention I'm a cynical bastard?)

As I perused the financial press over the weekend (anything to avoid doing my taxes), the euro zone's financial melt-down dominated.  Criticism abounded, with a common theme being how much better America has handled the crisis.  While our friends across the Atlantic face many structural and governance challenges, the real difference between our fates has been the willingness of our politicians to spend $16 trillion more than they've taken in and our central bankers to stymie the natural market response -- i.e., soaring interest rates.

Then, there's the minor fact that the USD is still the world's reserve currency.  As a wise friend of mine likes to say, until we go full barter and I start making your kids shoes in exchange for your extra chicken, it'll remain so -- even after we tumble over the fiscal cliff (we can't really expect them to "fix" that in the months leading up to an election, can we?)

This is where things get really interesting. The stock market's ramp to new highs has taken our collective minds off the calamitous impact that a severe spending decrease and/or tax increase will have on our economy.  As our predicament comes home to roost, the (continuing) recession will finally be obvious to all.  Even if, by some miracle, Bernanke can muster enough spit and bailing wire to keep the markets from crashing, it's not entirely up to him.

George Soros argued earlier today that Germany and the rest of the euro zone are heading for a Depression within the next six months.  Draghi and Merkel's solid Eddie Murphy impression notwithstanding (Keep it together!  Keep it together!  Keep it together!), the weakened and over-leveraged US economy will no doubt follow suit.  Maybe the Fed will go down swinging, throwing good money after bad, and maybe not.  But, it will make a difference only in when and how -- not whether -- the markets will collapse.

In 1923, Dr. W. Frederick Gerhardt, head of Aeronautical Engineering at the University of Michigan reasoned that since wings provide lift, more wings would provide more lift.  He built a beautiful aircraft known as the Cycleplane that featured a total of seven wings.  It even flew a few times.  But, it's best known for the time it was being pushed along the ground and the contraption collapsed under its own weight. 

Which brings us back to QE...  As we've discussed many times in these pages over the past year, the solution for too much debt isn't more debt and higher inflation.   There will be a point of recognition, sometime between now and December 31, when capital markets begin to reflect this very simple math.  And, the economic shock will be too great for even the Fed to mitigate.

When that happens, the rush to the exits will be swift and severe. But, until then, we'll do our best to navigate the twists and turns -- making the best of markets that are showing few signs of rational behavior.

Stay tuned.


UPDATE:  12:00 PM

Taking a little short position here at 1235, with a trailing stop of 1235 if the break of the 60-min RSI TL plays out.  Probably won't go anywhere, but you never know.  Maybe the Soros comments will rattle some folks.


Made an interesting discovery in EURUSD this morning.  The RSI level of 73.108 reached Friday is relatively rare.  It presaged several decent corrections over the years -- the most recent being April 28 - May 3, 2011 when the market topped at 1370.


Eight out of the past 10 instances were followed by SPX drops of 50 points or more -- typically within 2-3 weeks.

UPDATE:  3:20 PM

Adjusting my stop to 1434.


UPDATE:  3:55 PM

Taking profits on the bulk of my shorts at 1439.30; will leave a small flyer position in place.

UPDATE:  EOD

What a crazy day!  As I was writing about the inevitable demise of the economy as we know it, the market started slipping.  Pretty soon we had broken an important supportive TL on the 60-min RSI -- usually a clear sign of at least a little slide in prices.

I paused my pontificating to put out a trade alert, and found out that apparently everyone at GoDaddy went out to lunch at the same time, leaving no one to pedal the generator that keeps millions of sites open.

No sooner had I sent an email version of the post and trade alert re my short at 1435, when I realized the email servers were down, too.  I switched to an old Gmail account and sent it out via email; hopefully, everyone got one.  I was a tad early, as it took a while for investors to believe that a dip was being allowed in the days leading up to Bernanke's press conference (Thursday.)

Fortunately, there was plenty of remaining movement over the next hour or so and we were able to ring up another 6 points to the good.  Any other time, I'd stay full-on short into the close and overnight.  There is a strong case for continued weakness.  But, given the proximity of the German court decision on the ESM and the FOMC meeting, I'm continuing to play it safe.  I kept a smallish position overnight, but took profits on the majority of my shorts.  Unless something changes, I'll resume directional/swing trading again after Bernanke's speech on the 13th.

Regarding the GoDaddy issue:  it continues to go down periodically.  As of a few minutes ago, the mail servers are still down but the others are up.   There's nothing I can do in the short run other than send out email versions of each post and repost to the old pebblewriter.blogspot.com address on Blogger.

*  *  *  *  *  *  *  *

THE CONTEST

Just for grins, lets give away some pebblewriter.com memberships.  Since we're likely to have some fireworks this week, I'm curious as to what folks are expecting.   From now through 6pm EDT on the 11th, submit your best guess as to the closing quote for the SPX on September 13th.  One entry only, please, and verified Disqus ID's only.   Use this link for all entries.

Prizes are as follows:
closest to the mark:  one year membership
2nd closest:         semi-annual membership
3rd closest:               quarterly membership
First come, first served.  Once a particular number is posted, no one else may chose it.  I'll do my best to police these, but it's up to you to do your homework first.  And, while you're at it, impress us with the logic behind your reasoning.  I have some monthly membership awards to hand out for overwhelming brilliance, creativity or humor.

If you're already a member, you may use your award to extend your current membership or give it away to your favorite charity or a close friend.  All winners are responsible for any taxes, etc. on their winnings, and entries are void where prohibited.

If Disqus eats your entry, use the "contact me" form in the menu above and I'll post it for you as soon as I notice it.  Just to be on the safe side, you could also copy me at pebblescribe at gmail dot com.  Who knows when/if GoDaddy will get things going again?

Good luck to all.


p.s.  remember, make all entries here.


Wednesday, September 5, 2012

Old Dogs and Scalping

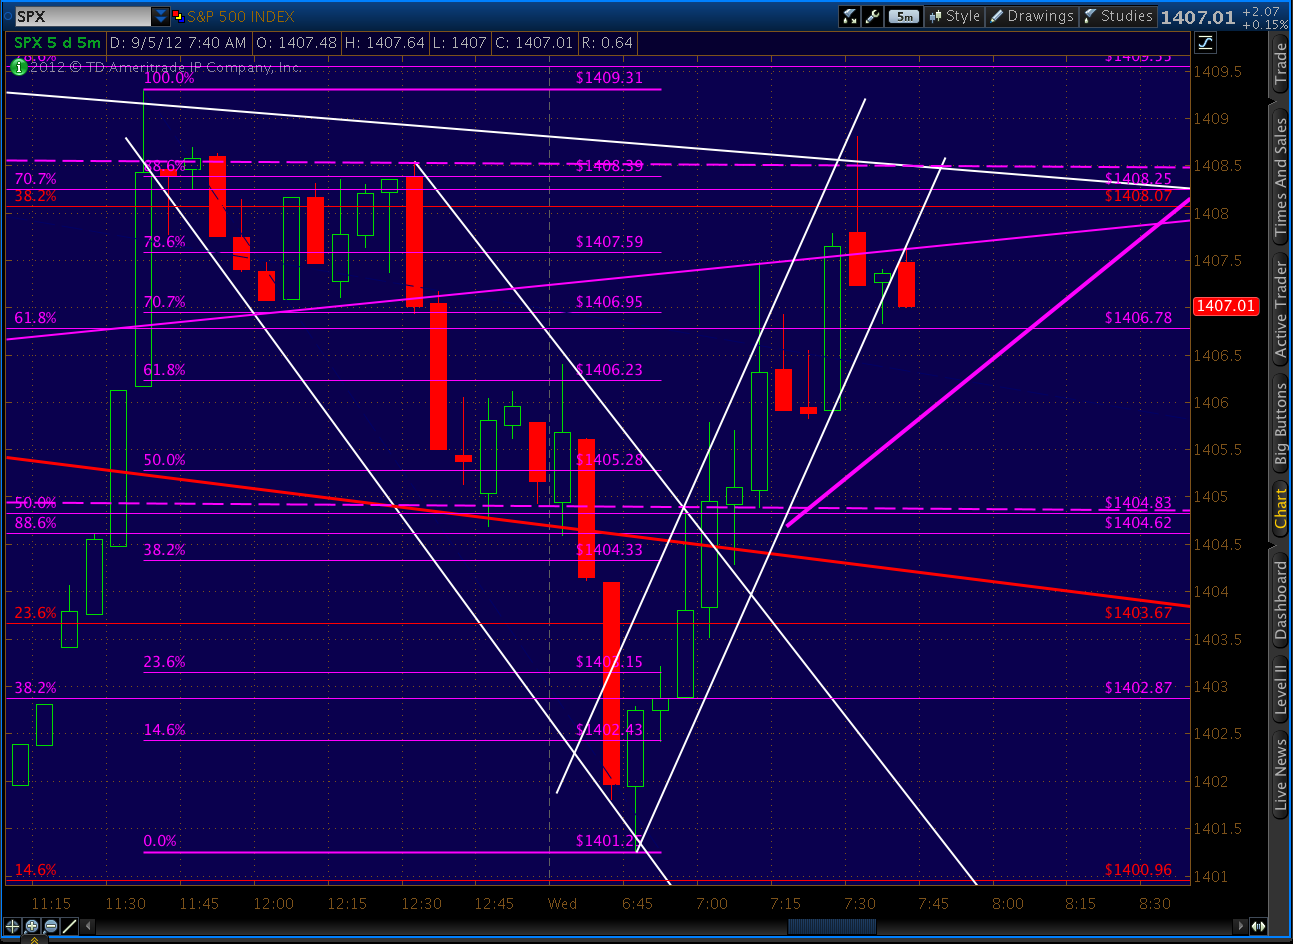
I'm not really a scalper.  Our swing/directional calls have been pretty successful and are a lot less stressful and time consuming.  But, we've had day after frustrating day of watching breakouts and breakdowns fizzle before they could even get started, leaving us with subpar performance for August (+5.4% versus our average of +12.2%.) 

Today marked the 21st day in a row where we traded within 5 points of the fan lines from 2007.  Complaining hasn't seemed to help, so I decided to scalp this schizophrenic market and try to pick up a few points per day -- at least until the Central Planning Sweepstakes winners are announced and things return to normal (hopefully by the 13th.)  

It's good for an old dog like me to get the blood flowing by getting reacquainted with some old tricks.  But, buy and hold types might prefer to brush up on their golf game.  We've averaged 12 trades/month since the new site opened in March.  In the past two days alone we've traded 9 times.  Thankfully, it's been volatile enough to pick up 2.3% in the process.  

Here's what we did today on pebblewriter.com...
 
ORIGINAL POST:  9:30 AM

Emini's are taking on a descending triangle look, and approaching the .618 time point where there should be either a breakout or breakdown.

It's worth playing along on the downside at the opening to see if there's another trip to the lower bound at 1395.  A stop at the upper bound (1406) should provide protection.  I'll take a short position on SPX when it opens.


UPDATE:  9:50 AM

Strange opening, with SPX up while ES was down.  Opened a small short position at 1406, stops at 1408.50.  Lower bound on triangle for SPX is 1396ish.


If the 15-min RSI rebounds at the upcoming TL, I'll switch sides and play the upside.


UPDATE:  10:00 AM


Switching sides here at 1402, with very tight stop at 1401.


I still like the idea of a Butterfly Pattern getting going here.  I'll post a chart in a moment.


UPDATE:  10:10 AM


If/as we approach the upper bound, we'll have to be wary of a reversal that could start a Gartley in the other direction.  The BC leg was roughly .618 of the AB leg.

So far, we've retraced .786 of the BC leg.  The upper bound is roughly at 1408.50 -- which also happens to be the upper Fan Line from 2007.

More in a few.


UPDATE:  10:20 AM

The 5-min RSI has provided a nice road map this morning.  Just broke out of its little corrective channel -- but that rising purple line is one of our major channel lines.  Make or break time for this little rally.


If we hit the upper bound, I'll likely take profits and wait for a breakout to get back in.  Otherwise, cash sounds just fine.

UPDATE:  10:30 AM

Taking profits here at 1408.55, will stay in cash unless break 1409.55 or little channel up breaks down.

UPDATE:  10:45 AM

Channel broke down, but RSI picture isn't so clear.  Will stay in cash for now.


More in a few.


UPDATE:  10:50 AM

5 min RSI broke back through support.  Will we get a tag on the lower RSI channel line again?  It's the same line for the 15 min, too.  The lower Fan Line is just below at 1404.80.


If that doesn't hold, there's also a TL at 1403 (white) that might correlate with the RSI channel lower bound.  If that doesn't hold, there's always a yellow channel line at 1399 and the descending triangle lower bound at 1396.50.


It occurs to me that the frequency with which SPX traverses between the upper and lower fan lines (currently at 1408.42 and 1404.80) has provided some tasty trade opportunities.  In the past 20 days, it's ventured into the gap 30 times, 22 of which traveled to the other side and 8 of which failed.

Given the 4 point gap and using reasonable stops, that would have translated into a nice little trading system:  22 x 4 = 88, 8 x -2 = -16, net = 72 pts.

Probably not useful going forward, as we should break out of this tight range once the Central Bank Sweepstakes winners are announced.  But, for now, the an lines are definitely exerting a lot of influence.

UPDATE:  11:15 AM

Speak of the devil.  Just had a little reversal at the lower fan line.  I'll play the odds and go long if we break above 1404.80 -- stop at 1402.80.

UPDATE:  11:20

Changed my mind -- don't like the RSI pattern.  Will wait for a better setup.  Looks like more downside to me.


More in a few.


UPDATE:  11:40 AM

So much for ignoring the trend...  RSI broke up through its FL and SPX appears headed for the 1408.40 side of the gap (also the triangle upper bound.)  As before, if it breaks convincingly through 1409.55, I'll consider it a breakout of the triangle and tag along on the upside.  If not, happy here in cash after making lunch money for the day -- or might take another run at a reversal.


UPDATE:  1:30 PM

On a positive note, my intuition was right.  SPX failed to make it across the gap and instead is approaching that white TL (1405-ish) again.  If it breaks through, should be a good short.   Chart in a minute.

UPDATE:  1:55 PM

Yikes!  Now, that was a break through.  If 1401.25 is broken, immediate target is 1400.  I've added some channels (yellow, dashed) that seem to be working pretty well in the short run.  We just bounced off 1401.38, will likely back test the presumed channel line in red -- also a yellow channel line.  This is really bouncing around; I'll set a loose stop at 1405 -- as we might go back and back test the broken TL (white.)


UPDATE:  2:35 PM

I'll give it another point or so to see if it's stopped by the TL back test.


UPDATE:  3:44 PM

Going ahead and closing out the short here at 1403 for a whopping 2 point gain.  We'll probably get a bounce off the RSI TL, and I like the idea of being in cash again overnight.