PEBBLEWRITER.COM IS LIVE!


*************** PEBBLEWRITER.COM IS LIVE! TO SIGN UP, CLICK HERE ***************


Friday, June 29, 2012

Forecast Revision

Well, we got the rebound we were expecting... although yesterday was a little unnerving.  As I posted at 10:30 AM, with SPX down 16 points at 1315:
We had a similar dip the day before Q1 ended, too.  March 29 opened at 1405, dipped to 1391, and closed at 1403.  Money managers like to end quarters on an up note whenever possible.  This feels like a fake out.
Although I pay all due attention to "feelings" it was the channel lines and harmonic patterns that gave me confidence I needed.  Sure enough, by late in the day we had rebounded to within 2 points of the opening, just like on March 29.  More importantly, we were right back on track with our forecast (the solid yellow line.)


Likewise, the dollar caught up to our forecast (solid yellow line) in one fell swoop.  I was getting a little nervous, watching the growing divergence over the past few days.  The previous H&S was in danger of being busted; and, although we kept one foot on the long-term channel line, we were moving further and further away from the presumed right shoulder target.  No more.


The pattern over the past 10 sessions suggests we'll top out this morning at 1357.28.  That's a Bat pattern retracement from the June 19 1363 high.  I'm also altering our forecast going forward...

Continued on pebblewriter.com.

* * * * * * * * 

Did you happen to catch today's rise?  Avoid selling at yesterday's low? [see: H&S Warning]   How about getting long back on June 1 [Why I'm Buying]?   Is the volatility killing your portfolio?  Instead of throwing in the towel, learn how to anticipate potential turning points in the markets and use volatility to your advantage.

The new website is off to a great start.  Investors who simply bought SPX when we called bottoms and sold short when we called tops would have earned 38% since pebblewriter.com's inception a little over three months ago.

Live webinars for members start next week.  Love to have you join us!

Thursday, June 28, 2012

H&S Warning

It's a real crapfest on the headlines front:  JPMChase faces trading losses of $9 billion instead of $2 billion; the rumor about Germany backstopping euro credit was false; Obamacare is alive and well; banks are actually manipulating LIBOR for their own benefit; Q1 GDP was left unchanged at a pitiful 1.9%...

Quick, which one of those wasn't entirely predictable?  Exactly.


Even so, the market just fell out of our channel.   I can live with an intra-day departure as long as the little H&S pattern doesn't play out (1309ish.)  Keep an eye on this guy.


We had a similar dip the day before Q1 ended, too.  March 29 opened at 1405, dipped to 1391, and closed at 1403.  Money managers like to end quarters on an up note whenever possible.  This feels like a fake out.

BTW, JPM's trading losses are probably much bigger than $9 billion, too.  If you haven't read it yet, this might be a good time to peruse The Wipeout Ratio.  JPM has $78 trillion in derivatives.  Even $9 billion is a pittance --  0.011% of the total.  I have to think they experience $9 billion swings every time Jamie Dimon gets the runs in his silk boxers.


UPDATE:  2:20 PM

While we're at it, the 1309 SPX level looks like it's probably linked to 83.182 on DX.  As we discussed above, 1309 is the area where a H&S pattern completes on SPX.  83.182 on the dollar is the area where: (1) a Gartley completes, and (2) the previous H&S pattern starts to be compromised.


A lasting push beyond 83.182 (or below 1309 on SPX) would potentially change the picture.  Stay tuned.


UPDATE:  4:30 PM

We got the rebound we were expecting.  SPX never dipped below 1313.29, leaving a nice long shadow on the daily candle and closing well within our channel again.  Just like March 29 (mentioned above), we lost a net 2 pts on the day.


DX got up to 83.07, and closed at 82.91 -- leaving a spinning top on the day without exceeding the previous presumed shoulder that should see DX sell off substantially over the coming days as stocks move up.

The yellow line marks the forecast I last updated on June 10 [see: Currents, See?].  Check in later for tonight's post on the dollar.  I'll have a complete discussion and updated forecast.


* * * * * * * * 


NOTE TO INVESTORS: 

These are the actual posts pebblewriter.com members received during today's session.  

While many investors were wondering when they should pull the plug, pebblewriter members had an actual number based on a forecast made over a week ago and updated first thing this morning.  And, while many other investors sold at the lows, pebblewriter members either covered their earlier shorts or simply held on to their longs for the rebound.

I don't always get it right.  But, our calls have been pretty decent.  Investors who simply bought SPX when I called a bottom and sold short when I called a top would be up over 36% since the site's inception about three months ago (details here.)

We're down to the last 6 charter annual memberships.  Charter members have their rates locked in for the life of the site.   No increases, ever.   Join with a friend and you can both knock another $200 off.  If you're not ready for the full monty, pick up a monthly membership for the cost of a night out. 

I look forward to seeing you at pebblewriter.com.


Wednesday, June 27, 2012

Membership Stuff

The new website is off to a terrific start. I’m happy to report that we were up 34.87% versus a negative 4.15% for the S&P 500 over our first three months (details here.)  I’m told that if we were a hedge fund, this would have placed us in the top 3%.


I’m also excited to see that our membership is growing at a respectable clip.  We now have members in almost every corner of the globe (Где ты, Россия?)

This is cool for two reasons.  First, I love to travel.  And, if we can get 10-20 folks together in your neck of the woods, I’ll be there.  Second, a more robust membership means I can afford to spend more time posting.

While we’re on the topic of memberships… as of this moment, we still have 9 charter annual memberships left.  These $700 memberships are guaranteed to never go up in price. If you’re currently in a monthly, quarterly or semi-annual membership and would like to save some serious money not only today but in 2013, 2014, etc., grab one while they last — and before prices go up in July.

An annual membership saves you $500 (42%) versus a monthly membership.  I’m also extending the offer to rebate your latest dues payment until these last 9 charter memberships are gone.  And, remember, two can join for only $500 each.  Larger groups are even less.   So, find some friends and save.

And, as always, current members get three free months tacked onto their membership whenever they refer a new annual member.  Got four friends who invest?  Get a free year. 

On another note, I’ve had enthusiastic feedback regarding live webinars for members.  Everyone has different levels of experience, and it seems like it'll be helpful for those who are still getting up to speed and/or those new to harmonics.  We'll schedule the first one for sometime next week.

Thanks for your support.

 * * * * * * * *


Tuesday, June 26, 2012

Harmonics Scenarios

Periodically, I take time to chart the various harmonic scenarios for both the upside and downside cases.

It helps pass the time while sitting and staring at the computer monitor, watching our forecast play out (so far, so good.)

It's also helpful in generating a set of potential outcomes for the market over both the near and longer-term.

Downside Scenarios:

Remember, all harmonic patterns begin with a significant reversal which we call Point X.  Over the past year, we can see three obvious Point X's, each of which generates its own set of Fibonacci retracements when paired with the recent 1422 high.  These grids, in turn, are of great help in developing a forecast.


Monday, June 25, 2012

pebblewriting...

~reposted from pebblewriter.com

I had dinner with one of our members the other day and got what I think is some great advice: explain how one might best use pebblewriter.com.

General Orientation

First, I believe in market timing.  While certainly not definitive proof, our performance over the past three months makes a good argument.  A hypothetical, unleveraged portfolio that simply bought SPX when we identified bottoms and sold short when we identified tops would be up nearly 35% since the new site was launched on March 22 [see: performance.]

So, I focus on trying to determine where the markets might be headed over the next few days or weeks.  Active traders can take advantage of anticipated swings, while buy and hold types can implement defensive measures and/or tailor their asset mix accordingly.

I don't suggest specific trades.  Everyone has different investment objectives, risk tolerance and cash flow needs.  Some day traders, for instance, are comfortable with futures or options and watch their investments like a hawk.  Others simply want to protect their trust fund or 401(k) from the next crash.  Most are somewhere in between.

My posts can be somewhat dense.  They often take an hour or more to write, and 10-20 minutes to read.  And, they're additive -- meaning I don't re-explain the big picture with every post.  If you're new to PW or have been away on vacation for a week or two, it helps to go back and catch up on the past couple of weeks.

In general, I try to avoid posts like "the monthly cycles guarantee the market's heading to 1390."  The internet is rife with these prognostications, and they're mostly worthless.  If it did go to 1390, how would we know whether it was a well thought-out forecast or someone's lucky PO box number?

I try to explain the reasoning behind my forecasts.  This makes it easier for folks to compare my forecast with others they might run across. You never know when someone else has a better handle on things at the moment.   And, I guarantee you we won't earn 35% every quarter.

I also try to convey the degree of my certainty.   When I'm really torn between two directions, or see the risk as being unusually high, I try to remember to say so.  This happens frequently, and often as not is the result of market makers trying to wring the last cent out of bulls before a downturn (and bears before an upturn.)

It will help to understand some of the terminology I use -- especially the harmonic terms with which many investors are unfamiliar.  They are explained under the "learn" tab.  I'll post more chart patterns and definitions with examples over time, but the markets have been so challenging lately I'm working overtime just to keep up.

Process

I usually begin a forecast by observing major trend lines and channels (parallel trend lines.)  What do they say about the long-term trends?  There are often relevant channels that slope both up and down. Smaller degree channels often run counter to the direction of larger degree channels.  And, it's not unusual to have channels within channels within channels. The dollar is a great example.
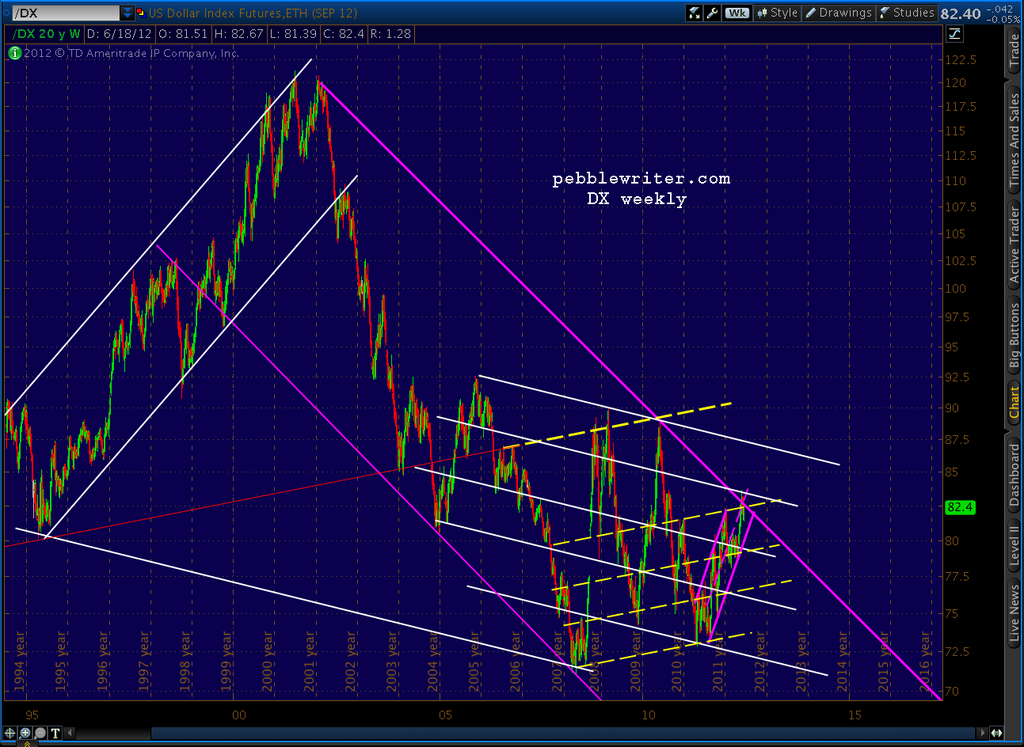


In general, prices moving in a channel tend to stay in that channel unless acted upon by some other chart pattern or trend line.  It's not hard to see how the smaller channels conflict with the larger purple pattern.  Something's gotta give, and the consequences can spell danger or opportunity depending on whether someone's properly positioned.  Larger/longer channels usually win, so a break from one is a big deal.

Once I have a sense of what the channels indicate, I look at the harmonic and other chart patterns.  Like channels, harmonic patterns can be nested inside one another and often conflict.  They can also evolve, such as when a Gartley completes at the .786 Fib level, but goes on to form a larger Butterfly pattern, or a Butterfly completes within the XA leg of a larger Crab pattern.   Here's a great example from the Butterfly pattern page.
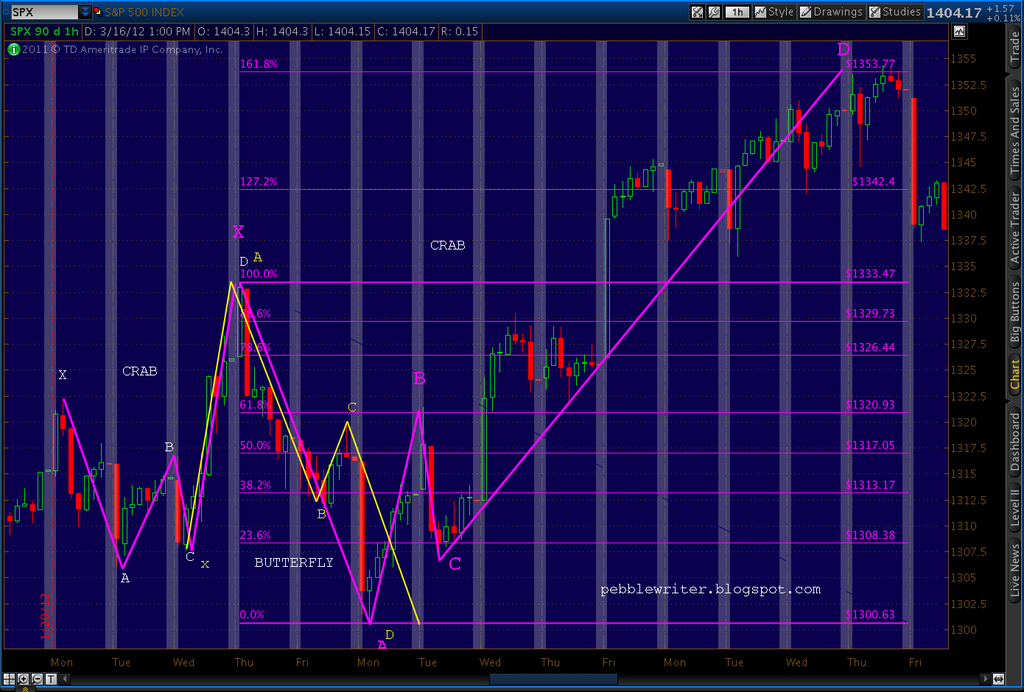


It's hard to keep track of all the various patterns.  But, I've found it extremely important to watch for both the patterns that track your expectations and those that conflict.  If nothing else, it helps to know when the upside/downside case is helped or hurt by that day's price action.

The same can be said for chart patterns such as Head & Shoulder patterns or Wedges. It's not unusual, for instance, for a Rising Wedge to set up in the right shoulder of a H&S pattern such as recently happened in the S&P 500.
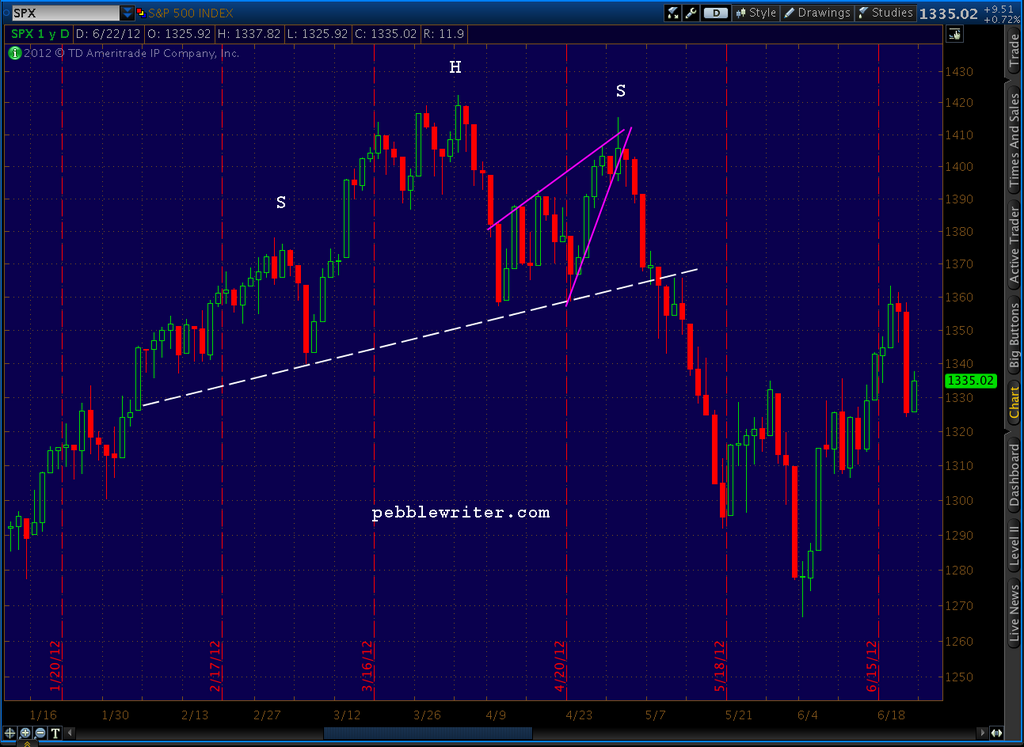


I also like to look for correlations between patterns in different assets.  If I see a huge run-up coming in equities and the US dollar at the same time, something's probably wrong with one or the other forecast.  The less certain I am about a particular chart, the more I'll look elsewhere for confirmation.  Other indices such as COMP, RUT, NYA and e-minis have often provided hints when SPX was tough to figure.

Once I have a price target in mind, I try to work out the timing.   Factors such as Fibonacci time ratios, options expiration, Fed meetings and elections often play a role in the timing of price movements.  Contrary to what I was taught in business school, the markets rarely follow a "random walk."

Once I have a set of forecasts that agree with one another, I'll ask myself whether they make sense given what's going on in the world (financial and otherwise.)  What's the financial press saying (hint: usually wrong)?  Are there potential downgradings in the works?  What about seasonal or cyclical factors?

I rarely look at other analysts' opinions.  But, when I do, it is always after determining my own forecast.  I'm loath to develop a bias based on a theory I don't understand that well.  After a spectacular first eight months last year, I gave way too much back over the next six months when I bought into the prevailing Elliott Wave P-2 script.

I'm often told that my style resembles that of one analyst or another.  And, I'm frequently asked whether I agree with a particular person.  It's not that I'm smarter than anyone else, but I really try to avoid such questions.  They require a level of familiarity with someone else's technique that I might not have.  And, they can be a real distraction.

Having said that, if a member comes across a really compelling conflicting forecast, I'm certainly happy to entertain it.  Just make sure the question includes an explanation of the other guys' reasoning. I just don't have time to become an expert on the effects of solar flares and rising hemlines.

Implementation

Markets generally move in concert (or opposite one another.)  So, when the S&P 500 crashes, you can usually expect to see the NYA tag along.  For this reason, almost all of my daily posting is done around the SPX.  So, members have to do a little extrapolation if they own something slightly different.  Otherwise, I try to stay current on the US dollar (DX), the euro (EURUSD) and VIX.  In my opinion, the three of them can explain what's going on at least 90% of the time.

If one wanted to track along with what I'm thinking, it would be a pretty simple matter to buy an ETF such as SPY at the bottoms and sell it short at the tops.  The only caveat would be to closely monitor the site, because I sometimes opine on short-term swings that can really add up.  Members are notified of new posts by email and updates within posts by text (if you sign up for it.)

I don't always post when things are right on track.  For instance, if my top scenario is that the market will turn at 1326, don't expect a new post announcing that we've hit 1326 and the market should now start going up as I said two days ago.  I might post if I have something new to add, but more than likely I'm busy putting in trades like everyone else.

Likewise, if you find yourself wondering why I haven't yet posted when one of my forecasts starts stinking up the joint, odds are I'm studying it intently and/or preparing a new post.  I can't watch every market every moment of every day, and I'll occasionally miss some stuff while shuttling a daughter to school or basketball game.  But, I do my best to stay connected and will let folks know if I'm going to be out of pocket for very long.

Even really clever forecasts can be rendered useless by unanticipated events or my sheer stupidity, so I'm a big believer in always using stops.  Sometimes, I remember to mention them, but the lack of a mention doesn't mean they're not warranted.  My recommendation -- always use them.

I hope to start charting more non-US markets and currency pairs soon.  And, I'm often a little behind on indices like NDX, RUT and COMP and currencies like the AUDUSD and JPYUSD.   Hopefully this will improve as the dust settles a bit more.

Summary

I'll update this piece periodically as time permits.  Please pass along any suggestions.  I read everything that comes my way, even if I don't have time to respond right away.  And, as always, thanks for being a member of pebblewriter.  I'll continue to do my best to be worthy of that honor.

~pebblewriter


*******

...reposted from pebblewriter.com...

Thursday, June 21, 2012

The Answer is No

I have no inside information, no best friend in the Fed, no hotline to Cramer.  I'm as surprised as anyone that we keep closing within pennies of our forecast.

I mean, I believe in harmonics and chart patterns and technical analysis -- augmented by a little common sense.  And, I (usually) know when to bail on a losing position.  But, this is just plain creepy.


Today marked our 90th day, and we're up well over 30% on a cash basis (I'll post the actual results tomorrow) based on forecast highs and lows that I've posted.  Today was icing on the cake, as we landed within inches of our 1326.19 target.

Thanks to all of you who've joined over the past three months.  I appreciate the faith you've shown in joining up, and will continue to do my best to offer the best information I can.
As always, the big question after a day like today is "what's next?"

Fed Up Yet?

 As expected, the Fed threatened much but did little - extending Twist through the end of the year.  Stocks and commodities didn't much like it; the dollar is up nicely.


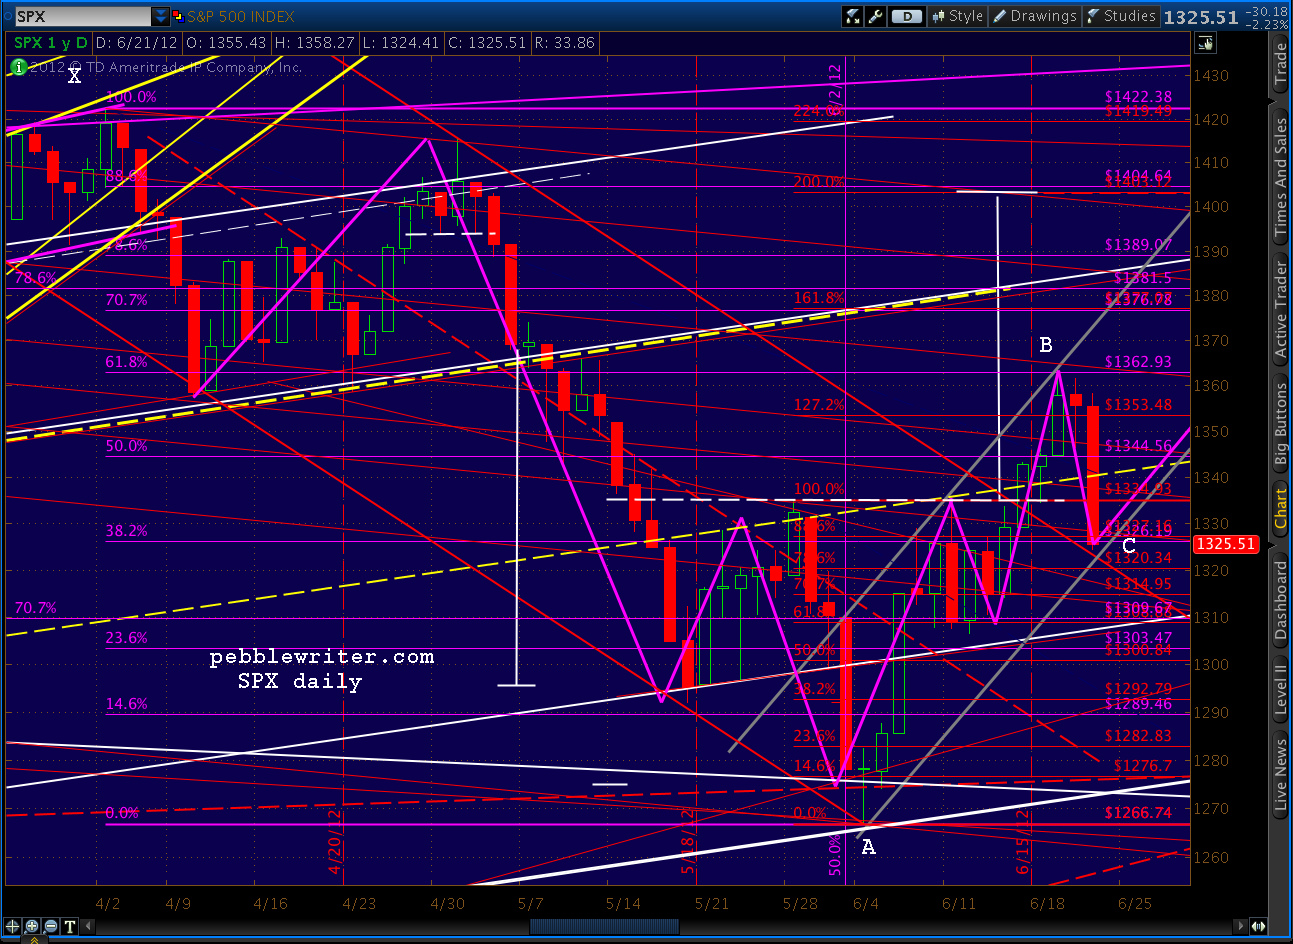
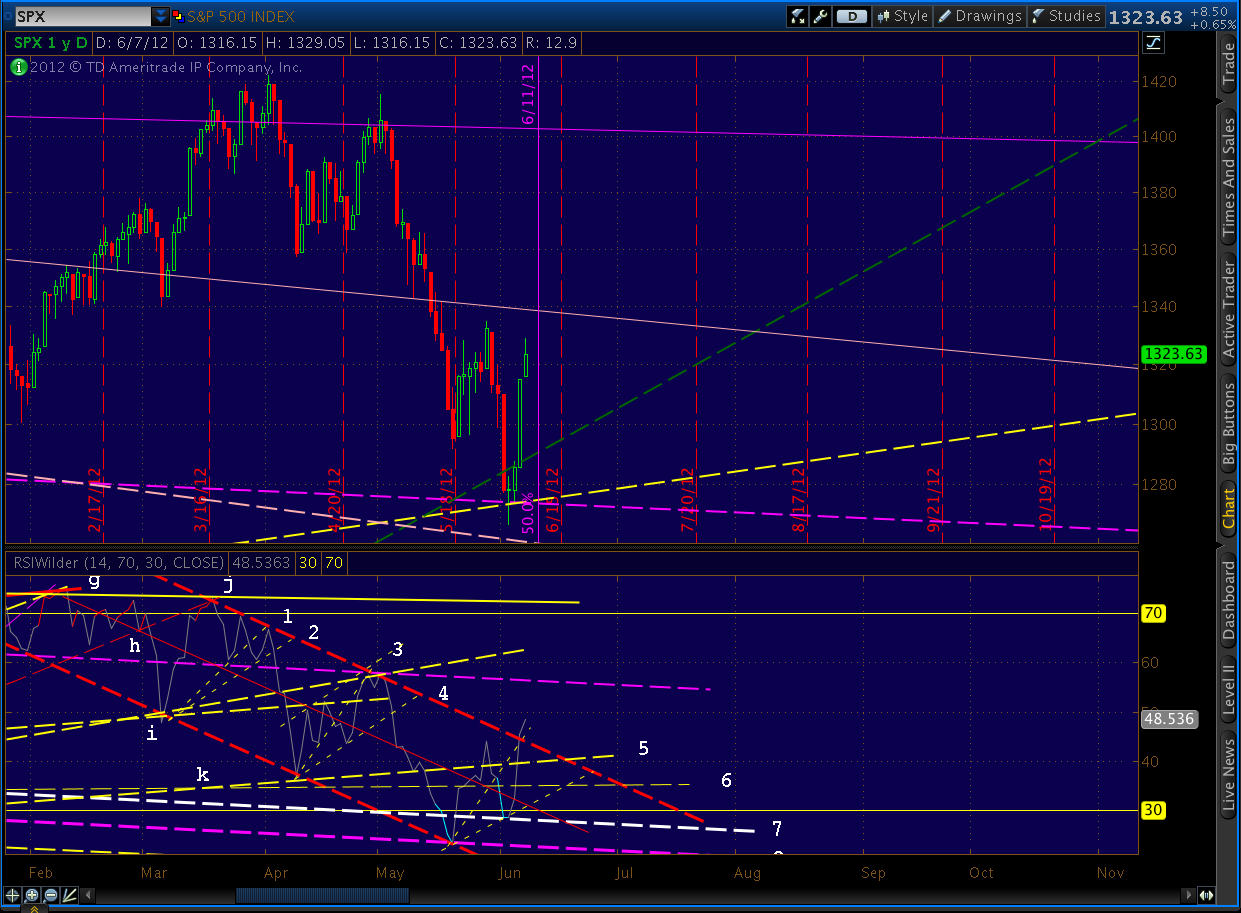
If the sell-off holds or accelerates at all, it will confirm the Point B we placed at 1363.46 yesterday -- the Fib .618 retracement of the 1422-1266 drop. It might also confirm my suspicion that the daily RSI pop out of the channel was an aberration rather than a broadening of the channel, as seen in the following chart.  I keep coming back to this RSI chart below because of its import.

...continued on pebblewriter.com...

Stopped Out


~reposted from pebblewriter.com:

I got stopped out of my shorts in the first few minutes this morning.  Apparently we're going to test the .618 retracement instead of the .500 before any serious back test occurs.  There's one .618 at 1358.56 (from 1415) and another at 1362.93 (from 1422.)  I'll take a fresh look at re-shorting there.


...continued on pebblewriter.com...

Monday, June 18, 2012

The VIX is In

Earlier today, I opined as to how SPX wasn’t done back testing its IH&S because — among other reasons — VIX hadn’t even reached, let alone reacted off our target of 18.31 (the solid red line.)

Never mind the “reached” part.  VIX nailed our June 12 forecast right at the close.  I don’t know about you, but I get all tingly inside when a 22% move comes in right on target like that.


We’ve hit three bulls eyes in a row with VIX — including the interim top on April 10 [see: Bottom Fishing], calling the June 4 high of 27.12 back on April 18  [see: VIX at a Crossroads]  and, now this.  The fourth will be a little trickier.


Now available on pebblewriter.com:   Join as an annual member and take your pick of: (1) a second annual membership for half-off, or (2) a free quarterly membership.  Perfect for that friend, colleague or client who's always bugging you for stocks tips.

And, new members who join by June 21 and upgrade to an annual membership within the first 30 days can apply the cost of their membership to the annual price.

Notice:  There are less than 20 charter memberships left.  If you'd like to grandfather the cost of an annual membership for the life of the site, sign up today. 

Update on Gold: June 18, 2012

~reposted from pebblewriter.com:

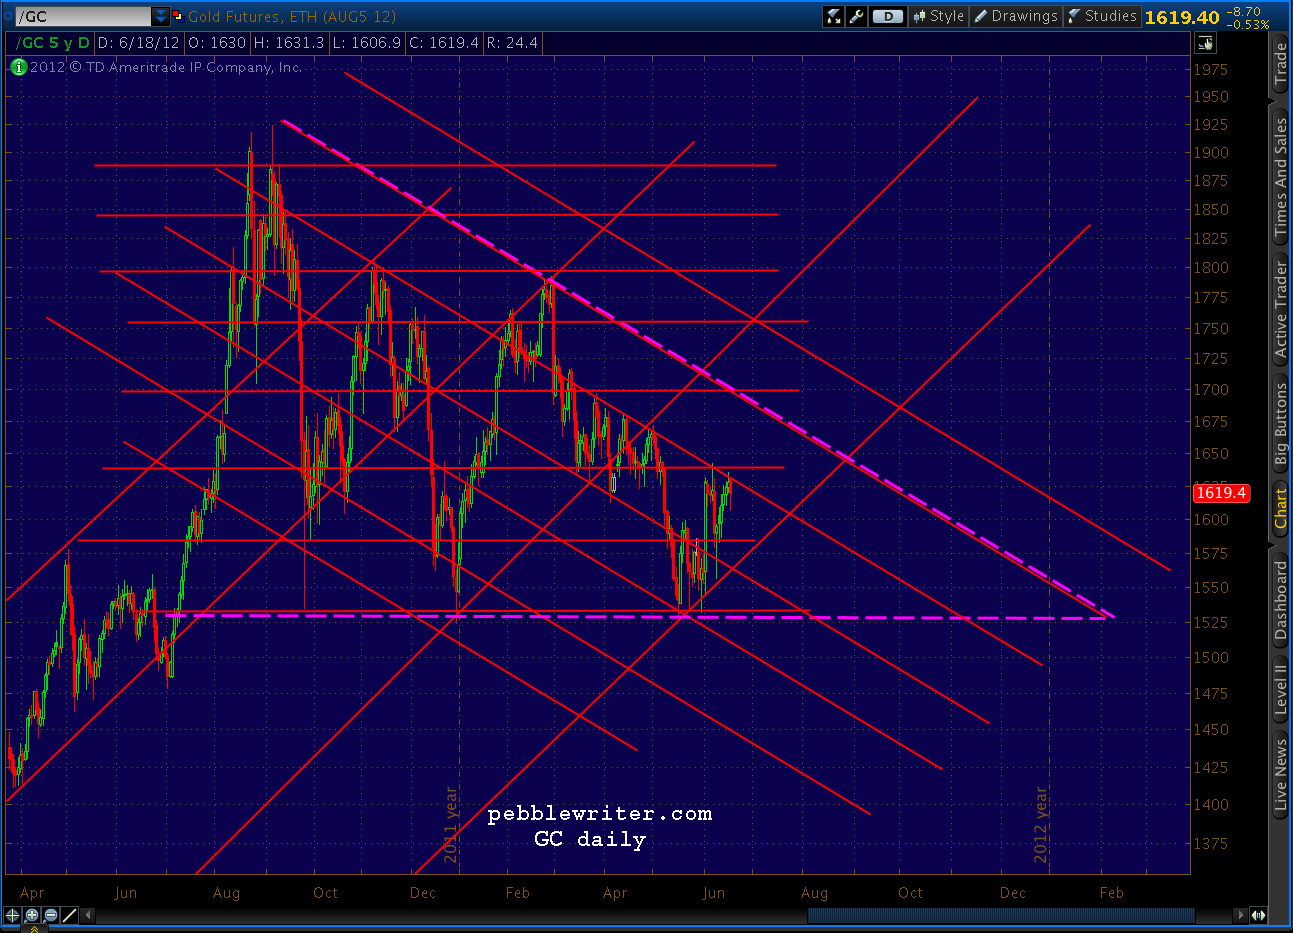
GC soared over $1200/oz since losing 30% in sympathy to the global markets meltdown of 2008.  Most of that rise took place in an acceleration channel.


Over the past year, however, the most prominent pattern has been the descending triangle shown in the following chart (purple, dashed.)

According to Bulkowski, these patterns can break in either direction, but break downward 64% of the time.  Whichever way they break, it typically occurs 64% of the way to the apex.  Also, if prices rise into the pattern (obviously the case, here), the breakout is upward 73% of the time.

Note how the upper bound of the triangle is echoed in parallel trend lines below it.  There's a pretty good chance that parallel TLs will come into play in any breakout, too.


The pattern looks about 19 months from July 6, 2011 to Feb 2013, so 64% would be 12.2 months;  we'll call it mid-July and drop a couple of placeholders into the chart below that fit the time frame as well as the major TLs.


Now available on pebblewriter.com...  join as an annual member and take your pick of: (1) a second annual membership for half-off, or (2) a free quarterly membership.  Perfect for that friend, colleague or client who's always bugging you for stocks tips.

And, new members who join by June 21 and upgrade to an annual membership within the first 30 days can apply the cost of their membership to the annual price.

Notice:  There are less than 20 charter memberships left.  If you'd like to grandfather the cost of an annual membership for the life of the site, sign up today. 


Friday, June 15, 2012

Forecasts and Ouija Boards

~reposted from pebblewriter.com

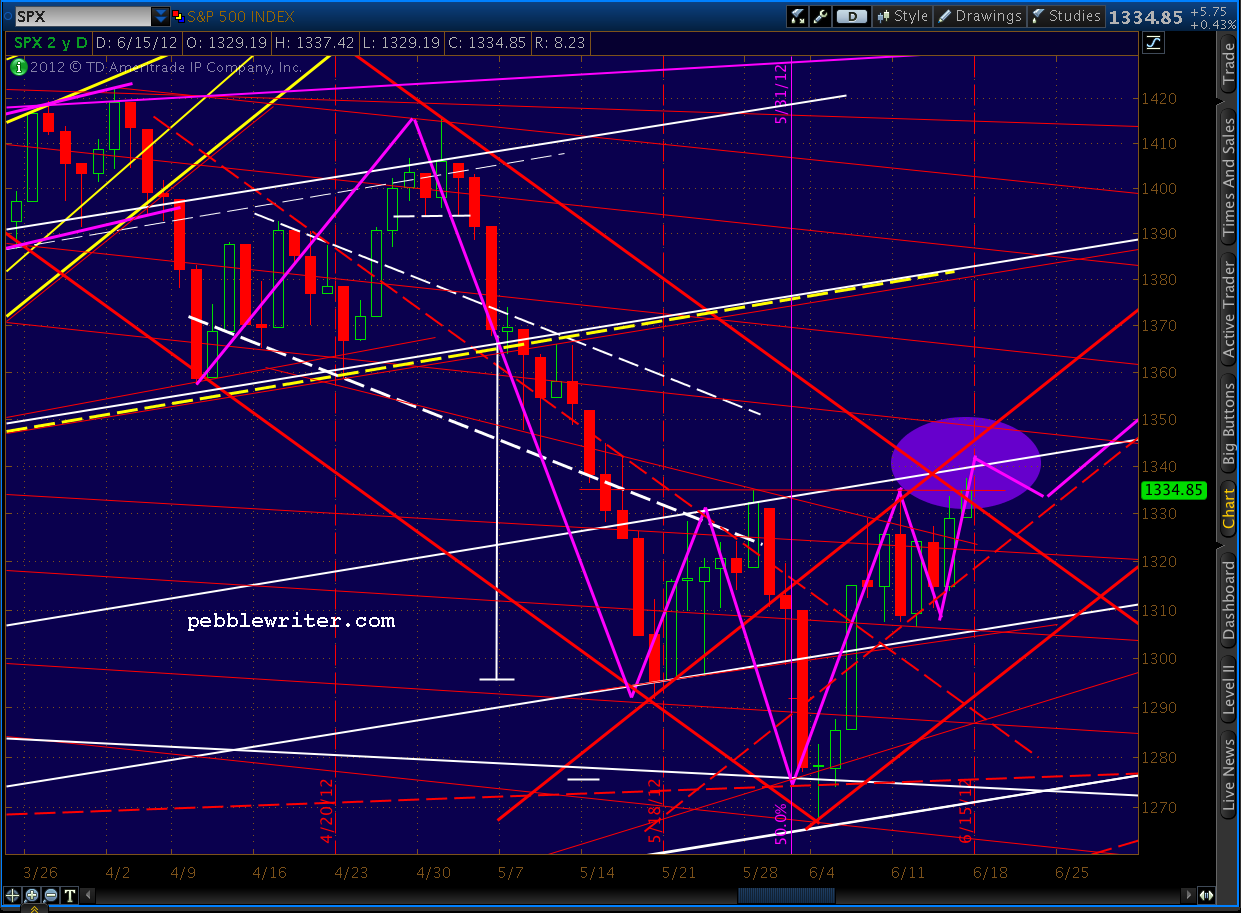
Back on June 1, I drew the following forecast, but was so uncertain about it I didn't post it until June 11 [see: Mixed Signals.]


On the 11th, I adjusted the timing a bit, then basically set it aside.  Other than helping me forecast a dip to 1303-1308 (which occurred a few hours later) I thought it was just a little too "cute."  In other words, it seemed a bit too obvious for it to play out.

Well, here we are -- just a couple of points away.  Despite my best efforts to disown it, the forecast has proven correct... and, right on schedule.


I don't recall making any deals with an otherworldly spirit or otherwise pledging my soul in exchange for eerily accurate forecasts.  No, I think there's something much more sinister  at work here.


...continued on pebblewriter.com...


Tuesday, June 12, 2012

Update on VIX: June 12, 2012

~reposted from pebblewriter.com

With all the volatility these past few days, VIX has put on a spectacular show -- gaining 3.69 yesterday alone (18.6%).  The weeks ahead promise to be just as exciting, but not for the reasons most expect.

As discussed back on June 2 [see: Channeling VIX] the "fear index" was on track to complete its Crab Pattern (in purple below) and Inverse Head & Shoulder pattern targets.  These targets of 27.13 and 28.20 respectively were originally set back on April 18 [see: VIX at a Crossroads]  when VIX was at 18.70.


VIX topped out at a nearly perfect 27.73 on June 4th and has been sliding ever since -- with yesterday being the notable exception.

Now, as many investors are scratching their heads, we'll plot out what appears to be a very clear path forward.

...continued on pebblewriter.com...

Monday, June 11, 2012

The Big Picture: June 11, 2012

~reposted from pebblewriter.com


This morning's decision to fade the futures' ramp was a good one [see: Mixed Signals.]
"There's a channel line just overhead at 1337.30 or so that should limit the current rally.  Given the way the futures behaved overnight in equities, the dollar and the euro, I'm going to fade this ramped up opening and see if it settles back down."
The market not only reversed within minutes of the open, but it got all the way back down to our target range of 1303.47-1308.88, putting in a low of 1307.73 and closing at 1308.93.  Mind you, I hadn't expected it to happen only six hours later, but I'll take it thank-you-very-much.

Although we got to the right trade in time, it was the result of a great deal of brain-racking and teeth-gnashing.  Had I bothered to look at the emini's, the decision would have taken all of five seconds.


All-together, SPX reversed over 28 points.  But, that was dwarfed by the e-minis reversal from +19 points to -23 points -- a daily range of 42.25 points.  This was the single biggest red candle since 2011's crash.

As noted in last night's update on the dollar [The Dollar: Currents, See?]:
"I suspect the euphoria over the Spanish bailout will be relatively short-lived.   Putting the rest of the eurozone in harm’s way seems like a better way to get them downgraded than it does Spain upgraded."
Sure enough, there was plenty of talk about downgrades today -- as doomers got the upper hand for a change.  The argument -- a good one -- is that there simply isn't enough firepower in the ES, ESFS and IMF to bolster the creditworthiness of all the countries currently circling the drain -- let alone those that aren't yet in the headlines (Italy and France are on deck.)

In the end, it will be up to Germany, the US and China to decide how much to contribute -- a matter for a future post.

Returning to the markets, there are several critical take-aways from the ES chart above.


...continued on pebblewriter.com...


*********

If you want these updates as they occur instead of at the end of the day, consider joining the new and improved pebblewriter.com.

Memberships start as low as $100, which can be applied to an annual membership within the first 30 days.  Or save big with an annual membership right off the bat.  There are still a few charter annual memberships left (your membership rate is grandfathered for the life of the site.)


Mixed Signals


~reposted from pebblewriter.com

ORIGINAL POST:  9:30 AM

It concerns me that SPX has broken out of  its RSI channel, but nearly every other index has not.  It's entirely possible SPX is merely showing leadership and the rest will tag along, but I rather suspect that SPX is getting ahead of itself.

There's a channel line just overhead at 1337.30 or so that should limit the current rally.  Given the way the futures behaved over night, in equities, the dollar and the euro, I'm going to fade this ramped up opening and see if it settles back down.


 ***********


And from the 1:30 UPDATE, with SPX at 1322:
"I think it'll be choppier than that, testing as low as 1303.47-1308.88 over the next few days leading into OPEX."
SPX closed today at 1308.93 after hitting an intra-day low of 1307.73. 


 ***********


If you want these updates as they occur instead of the end of the day, consider joining the new and improved pebblewriter.com.

Memberships start as low as $100, which can be applied to an annual membership within the first 30 days.  Or save big with an annual membership right off the bat.  There are still a few charter annual memberships left (your membership rate is grandfathered for the life of the site.)


Friday, June 8, 2012

Harmony

Harmony and me...we're pretty good company.  From the moment I first heard about Fibonacci, I was hooked.  A numerical sequence that produces mysterious and magical ratios that show up in everything from the design of pine cones and nautilus shells to the layout of pyramids of Giza and dimensions of the Parthenon?  Sign me up.

When I heard these ratios could be applied to investing, it was music to this math geek's ears.  Most of my early efforts were focused on prices, but I've spent the past few months studying the application of Fibonacci ratios to time levels, as well.

Fibonacci time ratios are a trickier than price ratios.  It's pretty simple to eyeball a stock's move from 10 to 20 and calculate a .618 retracement of the 10 points.  Just make sure the starting and end points are significant, and check to make sure you're considering all the alternatives, and Bob's your uncle.  Okay, so it's a little more work than that, but not terribly complex.

Time series, on the other hand, deal with periods that can extend well beyond the standard computer monitor.  It can be really, really tricky to find start and end points that provide a good fit for a set of ratios,  not to mention a reliable long-term stream of market data.

I've tried hundreds of combinations over the past few months, trying to find a set that fit the actual market results well, i.e. it captured the major moves with the primary Fibonacci ratios.  And, I've found one that's very interesting in that it fits the two market crashes in the past 10 years.


October 8, 1998 represented the bottom of a 22% decline -- the first 20%+ decline the market had seen since Black Friday in October of 1987.  It's been largely forgotten since the arrival of its two more dramatic siblings in 2002 and 2009.

Setting October 8 as the starting point, the October 10, 2002 bottom falls about a week from the .146 Fib level, and the March 6, 2009 bottom falls only a few days away from the .382 level.

And, as you might have noticed, the last Fib level of .500 occurred a week ago on June 1.  Like the .236 level, it hasn't been (so far) accompanied by a 50% drop in the markets.  Does that mean we're out of the woods?

************
For the rest of the article and more cool charts than you can shake a stick at, head on over to:


Note: due to popular demand, monthly memberships are now available.  Convert to an annual membership within the first 30 days, and I'll rebate your first month's dues.  For more info, click here.


Thursday, June 7, 2012

Moment of Truth

~reposted from pebblewriter.com

As Ben Bernanke scolds Congress for how pitiful a job they've done on fiscal policy, SPX has staged an important break out.


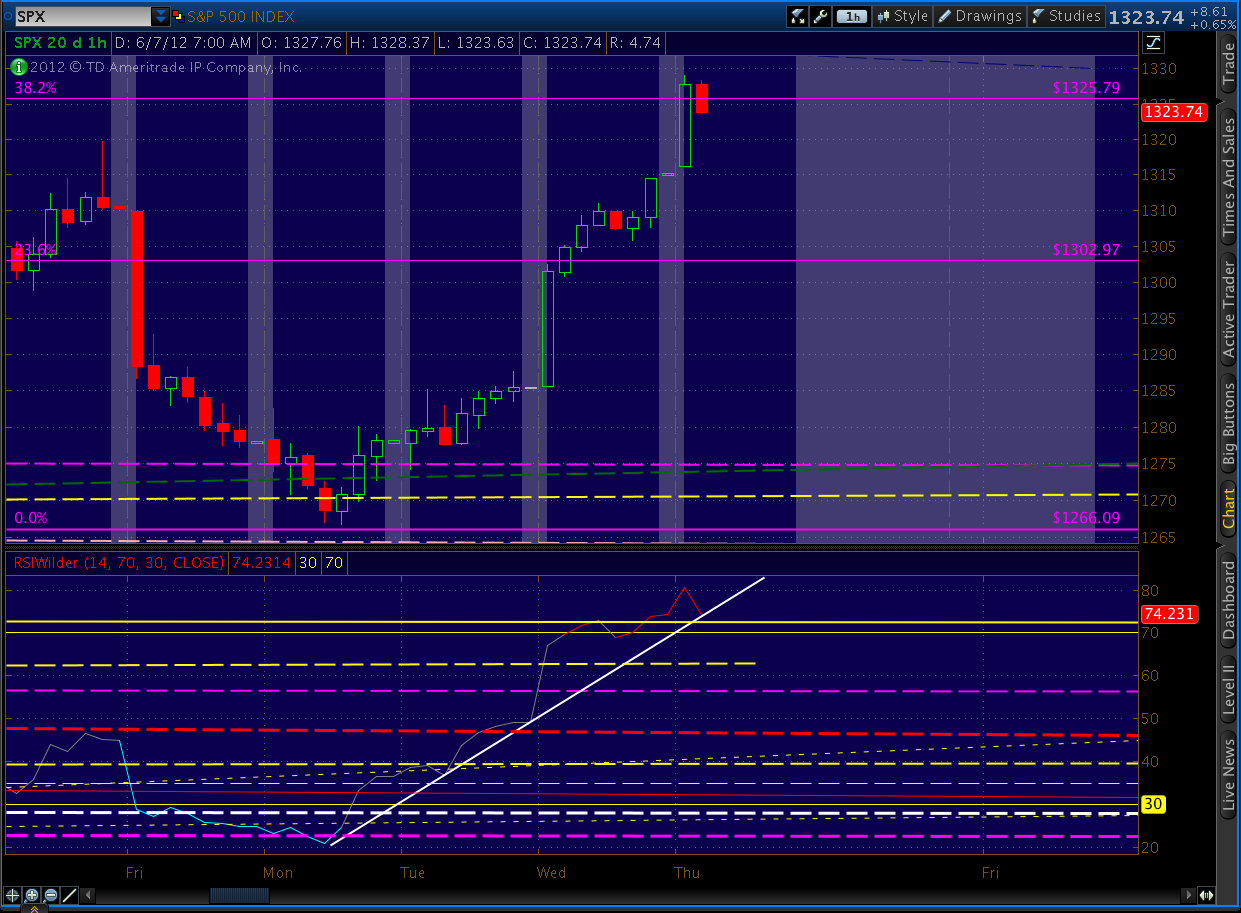
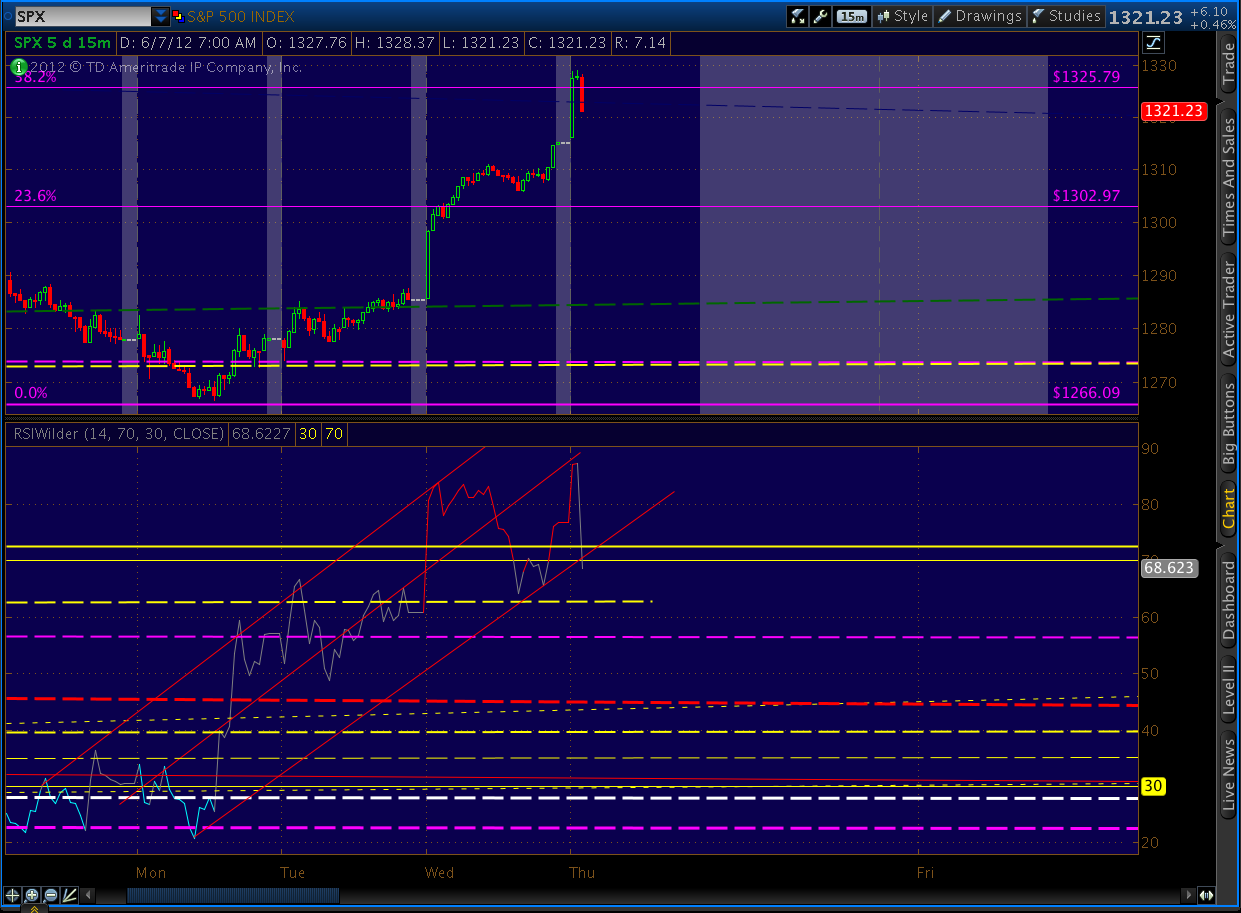
Daily RSI broke out of the channel that goes back to January.  It has done a phenomenal job of providing guidance, and a clean break out is unlikely to occur without at least a back test.  If fact, don't be surprised if RSI closes back within the channel, given that we've just reached the .382 Fib level.


Of course, it's ALL up for grabs in the event Bernanke actually tips his hand -- beyond "we have lots of options" and "all options are on the table."  Let's see if we can make some sense of the path forward.

A break of the shorter-term RSI channels/TLs will signal at least a tradeable pullback -- a logical place for traders to take short term profits and/or play the pause.  Longer term investors and traders alike would do well to keep their stops at levels at which they can sleep at night.  But, in general, a drop below 1300 would signal trouble for the upside.


I took profits this morning around 1325 based on the 15-minute chart and will watch for any pullback to run out of steam before jumping back in -- but will likely wait no later than 1328.  My top case is a pullback to 1303.47 before heading higher, but it's entirely possible we won't make it that low before bouncing back.


BTW, if you're watching BB on CNBS but are tired of the constant commercial breaks, CSPAN has a wonderful, commercial-free broadcast streaming here.

UPDATE:  12:00 PM

Not much new in the Bernanke testimony.  I did enjoy his exchange with Jim DeMint of South Carolina.  DeMint opined that since the Fed has purchased about 75% of new debt issued by the federal government, we've had much lower interest rates than would otherwise be the case -- currently around 2%.

DeMint mangled the question, but Bernanke's answer came very close to the truth that the politicians seem to be ignoring.
"I would question whether or not low interest rates are, in some way, enabling fiscal deficits. The deficit over the past few years has been over a trillion dollars a year, as you know, about 9% of GDP.  If we were to raise interest rates by a full percentage point, and ignoring the fact that most debt is of longer duration and would not reprice, that would still only raise the annual deficit by something a little over $100 billion....The deficits are so large, particularly going out the next few years, irrespective of the level of interest rates, I would think that Congress would have plenty of motivation to try and address that.  And, whether interest rates are currently 1 1/2% for ten years or 2 1/2% just doesn't make that much difference."
DeMint was trying to say that if interest rates were not suppressed by the Fed's actions, treasury yields would be much higher.  And, then, we'd really be up a creek.

Bernanke's answer was that interest costs were the least of our problems when we're adding over a trillion dollars per year to the outstanding balance.

They're both right, and they're both wrong.

DeMint's math is correct; higher rates would be a problem.  Because, the $100 billion annual interest we now pay would soar to $400 billion if rates returned to long-term averages.  An annual expense of $400 billion starts to crowd out such line items as medicare, social security and the national defense.

But, his grasp of markets is not so hot.  Sure, it helps to have a committed buyer with unlimited funds when you're peddling debt of any kind.  But, it helps even more to have a dearth of acceptable  alternatives.  You and I can bury money in the back yard, but that's not really an option when you're a bank, insurance company or pension plan with tens or hundreds of billions to invest.

Bernanke is quite right in that the size of our budget deficit is so huge that $100 billion isn't going to make us or break us.  Of course, $200 billion is a little worse.  And, $500 billion is worse yet.  And, so forth and so on.  As any frog lounging in a pot of boiling water will tell you, there will come a moment of truth.

UPDATE:  3:45 PM

The sell call at 1325 proved timely, and we scored a quick 39-pt gain since our last buy signal.


As suggested in this morning's first post, SPX pulled back to the point where RSI is back within the daily channel -- a very significant development.


The question now is "what's next?"  For timely analysis as it happens, log on to pebblewriter.com

Not a member yet?  No worries.   Due to popular demand, monthly memberships are now available.  Convert to an annual membership within the first 30 days, and we'll rebate your first month's dues.  For more info, click here.

Wednesday, June 6, 2012

So Crazy It Might Just Work

~reposted from pebblewriter.com  (June 5, 2012)

As a member correctly pointed out in his comment on XLF Update, a ramp in XLF would mean some big returns for important components such as BAC, C, JPM, etc.  This is very true.  Though it pains me to say it, I think banks are ready for a bounce.

I sold all my remaining JPM, GS and MS puts Tuesday.  I first jumped on the downside March 27 when JPM was 46 [see: End of the Line], GS was 127 and MS was 20 [ Lots More Where That Came From.]

I played the downturn with options, but even straight-up short positions would have made some decent returns over the past nine weeks:
JPM:        46 - 32 = 31%
GS:        127 - 92 = 28%
MS:    20 - 12.50 = 38%

But, all good things must come to an end, and I think the tide is turning for financials.  Don't get me wrong... I still think they're dead meat in the longer term.  I just think we're looking at a sizable bounce here and now if -- and let me be clear, it's a very important IF -- the rumors are true and Kumbaya Banking and Quantitative Whatever are back.

If not, this entire exercise isn't worth the bytes it's written with.  The financials, along with just about everything else Bloomberg quotes, will roll over and die.

OK, with that huge caveat out of the way -- and before you laugh me out of cyberspace -- check out the charts at the new pebblewriter.com. 
  

...pebblewriter.com...

Note: due to popular demand, monthly memberships are now available.  Convert to an annual membership within the first 30 days, and I'll rebate your first month's dues.  For more info, click here.

Tuesday, June 5, 2012

XLF Update: June 5, 2012

~reposted from pebblewriter.com

Financials play a pivotal role in the markets.  They led the way as they enabled the previous run-ups and bubbles, and they led the way down when the house of cards was revealed for what it was.  The survival of nearly all markets is hanging by a QE thread, so we'll take a fresh look at XLF to see what the charts are saying.

We'll start with the weekly chart going back to inception in December 1998 -- lot of water under the bridge with this ETF.


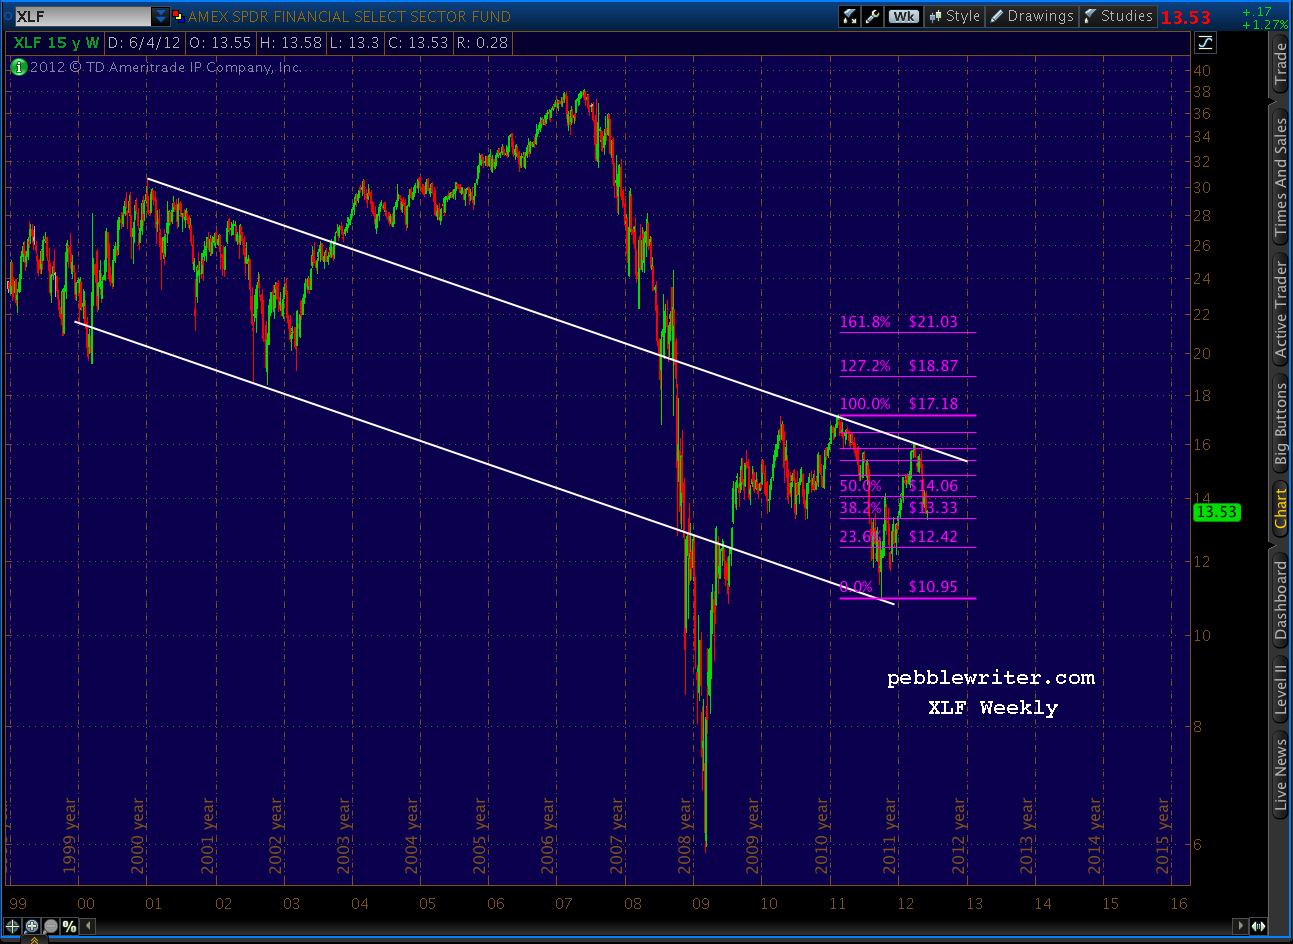
Fortunately, for us analyst types, it's been very amenable to chart patterns and Fibonacci analysis.  Consider this chart, that helped me call a top in banking stocks in late March [see: End of the Line and Lots More Where That Came From.]  Note the well-defined channel and the Gartley Pattern reaction at the .786 Fibonacci level.


I've put together a series of charts that, I think tell a pretty compelling story regarding XLF's future.  For more, go to pebblewriter.com.

***************

Note: due to popular demand, monthly memberships to pebblewriter.com are now available.  Sign up for an annual membership within the first 30 days, and I'll rebate your first month's dues.  For more info, click here.

Monday, June 4, 2012

Oil's Balancing Act

~reposted from pebblewriter.com

Like many stock indices and currencies, Crude Light (CL) is at a critical stage.  It reached 114.83 after breaking out of a diamond pattern in April 2011, only to back test the diamond six months later at 74.95.  It then retraced .886 of that plunge, setting a lower high of 110.55 in February before plummeting once again as low as this morning's 81.21 (the .886 is just below at 79.01.)


At current prices, CL is supported by fan lines from both 2009 and 1998.  A break could send it tumbling to $50 or lower.  On the other hand, QE is clearly on the table -- with all its asset-inflating implications.

In short, CL now balances on a precipice, where a move in either direction is likely to be huge.  On pebblewriter.com, we examine why -- and which course is more likely.

...continued on pebblewriter.com...

Saturday, June 2, 2012

Channeling VIX

~reposted from pebblewriter.com

VIX has very nearly reached the channel mid-line, Inverse H&S and Crab pattern targets I posted back on April 18  [see: VIX at a Crossroads], though we're 2 days behind schedule.


Our IHS target was 28.10 and the Crab pattern target was 27.12, expected to occur on May 30.)  Friday's high was a very close 26.71.  It's close enough to be considered complete, but a little follow through Monday morning would tie things up in a nice neat bow.


Interestingly, Friday's high also nails the .382 retrace of the drop from last August's high of 48 to the recent 13.66 low.   The implications are potentially huge.

...continued on pebblewriter.com...

Friday, June 1, 2012

A Walk on the Arithmetic Side

~reposted from pebblewriter.com

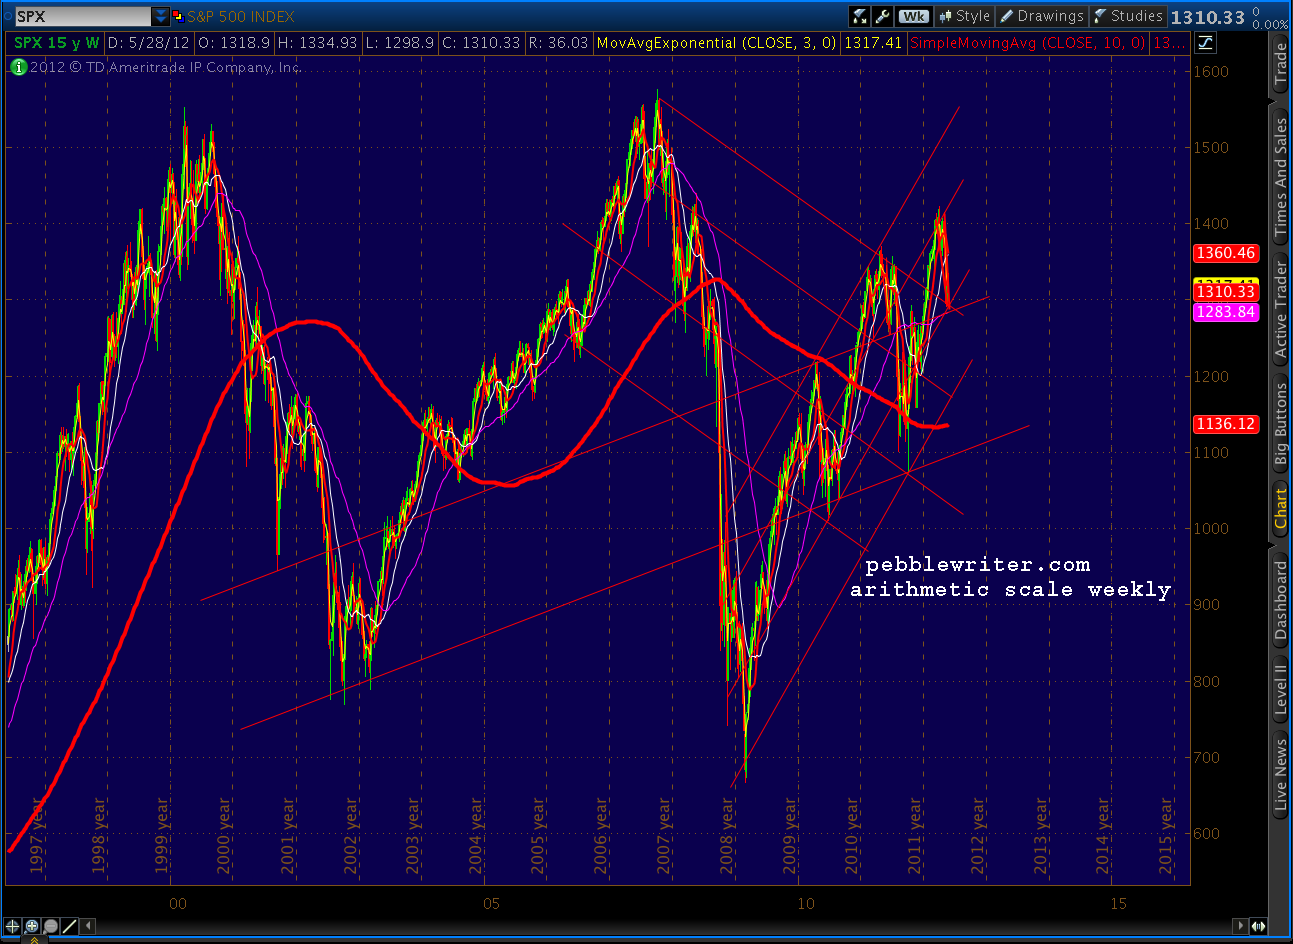
I normally construct charts in log scale.  In general, I regard it as a more legitimate way of viewing time and price relationships.  But, I try to check in on the arithmetic picture from time to time.

Here are a few arithmetic charts to consider...


It's safe to say that the arithmetic charts agree with the log charts I've been constructing -- that the next move is higher (absent much worse news out of the euro zone, of course).  If I'm wrong, I think the downside is in the 1275 area.

I just spent an hour perusing some of my favorite sites, and almost every one of them is extremely bearish at the moment.  I don't know folks, I could be way out of line here...feeling pretty lonely in calling the bottom here again.

As I was discussing with a reader this afternoon, there have been a lot of these situations lately -- where I seem to be the odd man out.  So far, it's worked out pretty well.  But, I can't escape the feeling it'll catch up with me sooner or later.  Maybe it's all the black swans circling us, their dorsal fins a sobering reminder of the cost of being wrong.

I know I'm repeating myself, but please use stops.  Things are much too hinkey to hang your hat on my or any other forecast without downside protection.

...continued on pebblewriter.com...

now offering monthly memberships