PEBBLEWRITER.COM IS LIVE!


*************** PEBBLEWRITER.COM IS LIVE! TO SIGN UP, CLICK HERE ***************


Monday, December 31, 2012

Playing the Cliffhanger

reposted from pebblewriter.com ~

We remain short from SPX 1447 on Dec 18.

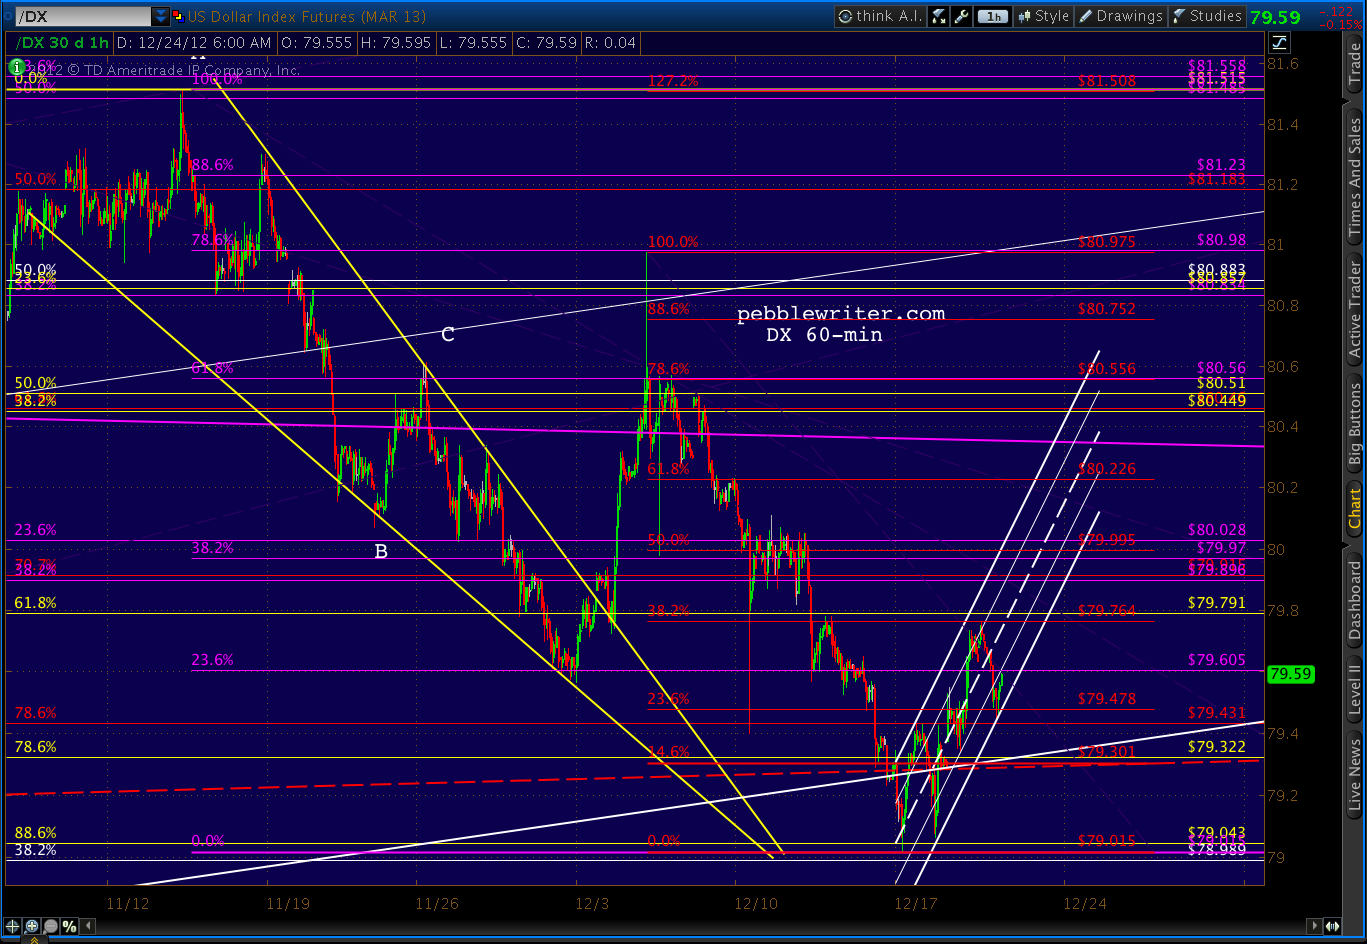
The dollar is either finding support at a channel midline (purple) or about to find it at the bottom of a channel (white), depending on which channel ultimately holds.


DX RSI shows great channel support either way.


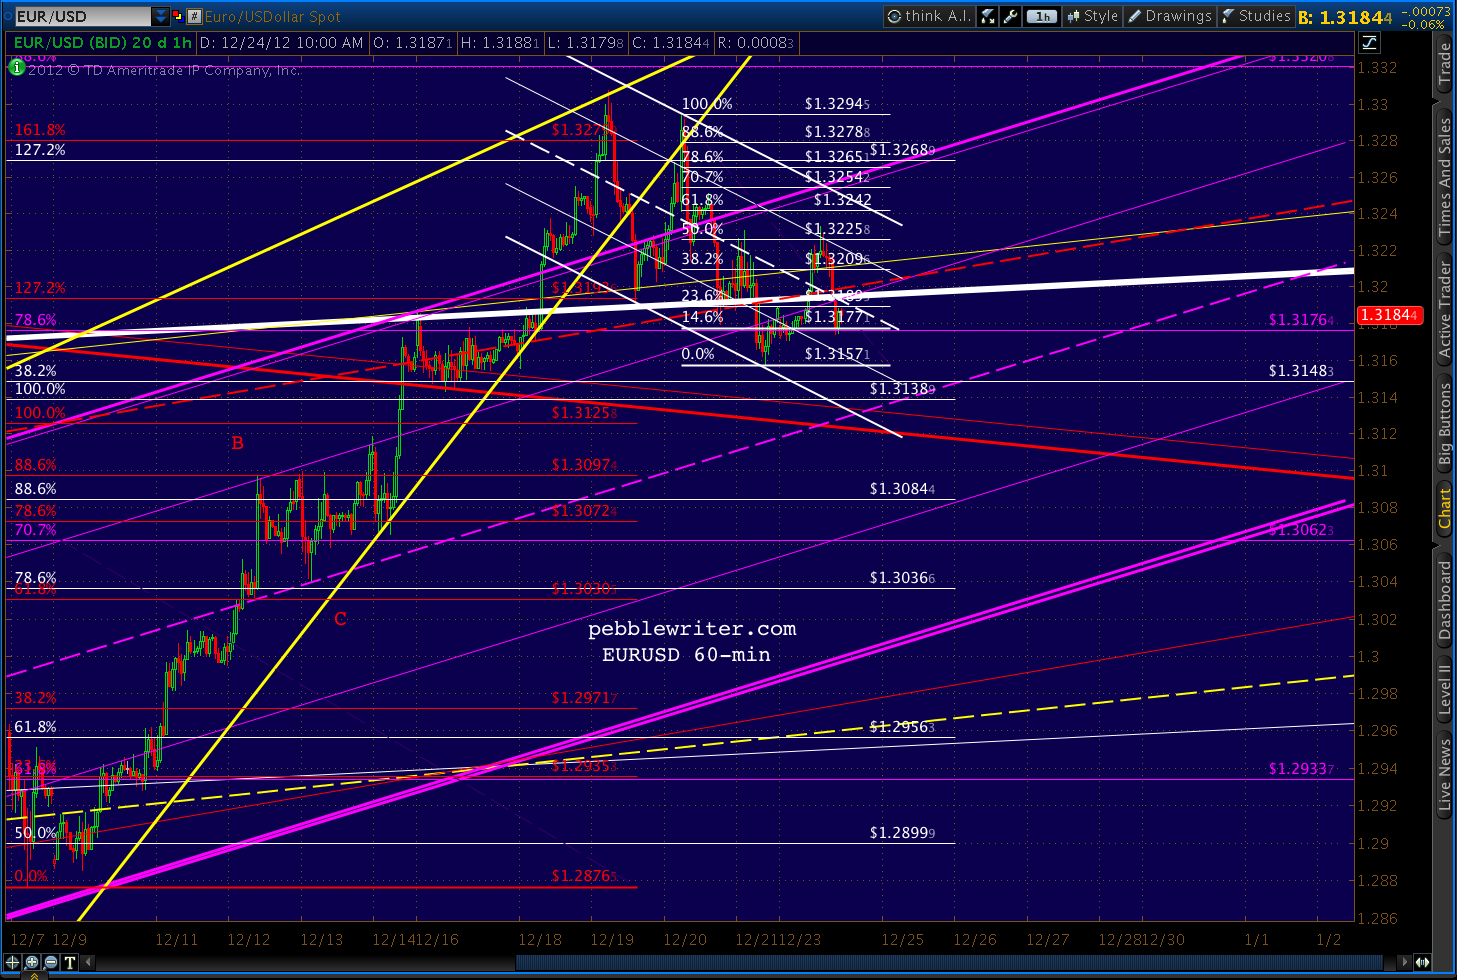
The EURUSD is still hanging in there, backtesting the red channel midline again in the midst of the major white channel back test that's been going on since Dec 18, and post the rising wedge break of Dec 19.


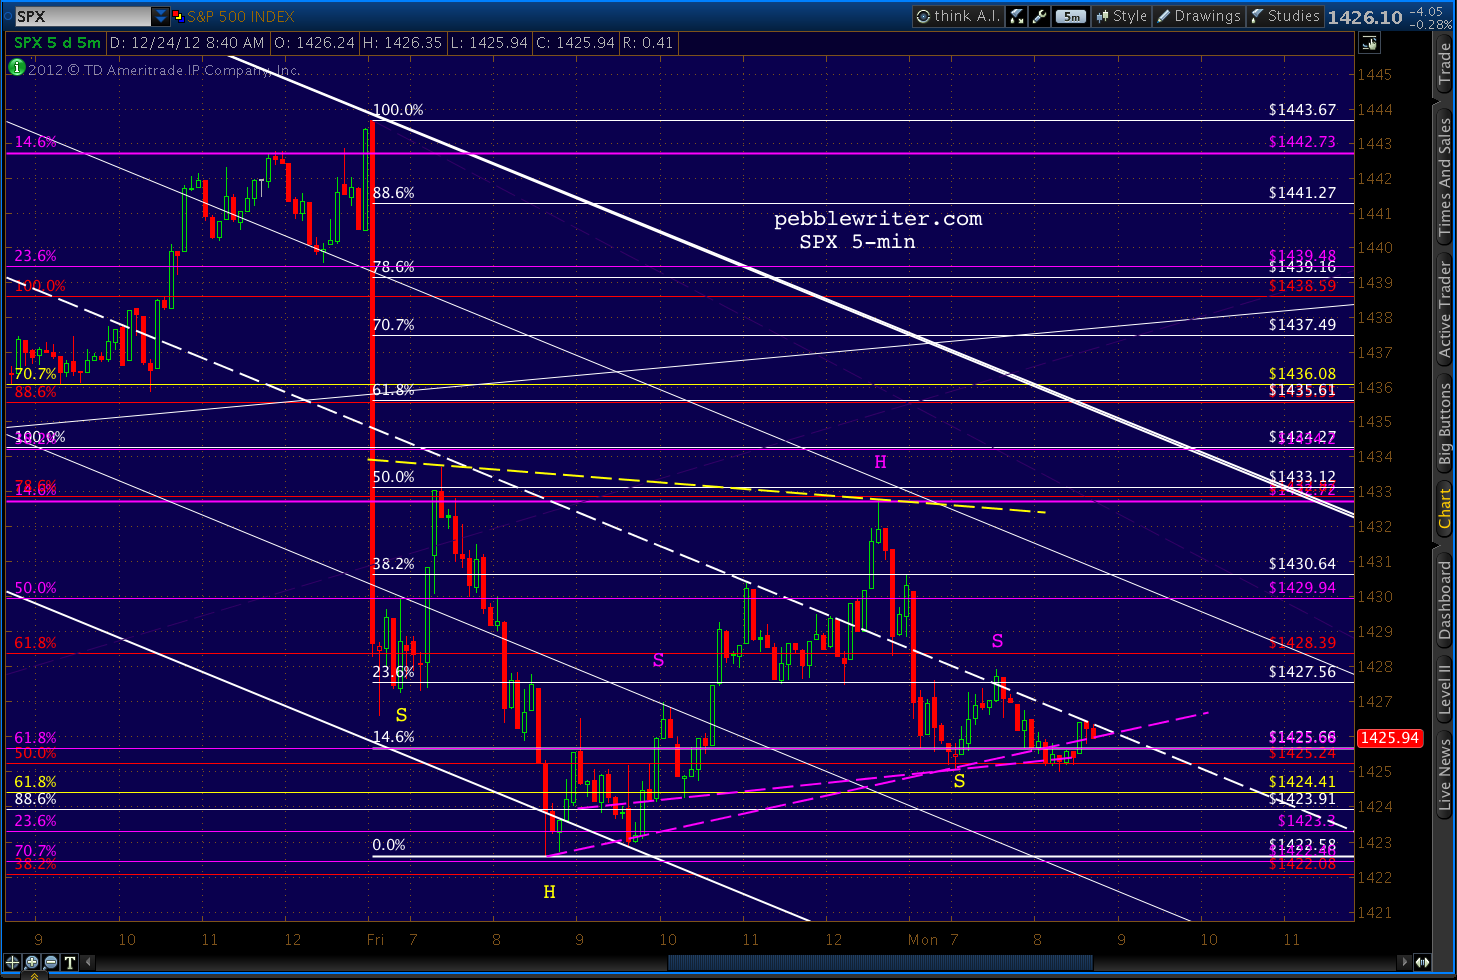
As Reeodd mentioned on Disqus Friday, the H&S pattern that completed (see the 2:50 entry) would look better formed if the right shoulder were a little higher.  This is definitely true, though the past six months has seen many very lopsided H&S patterns play out perfectly.

Bottom line, the pattern completed -- but it didn't close beneath the neckline.  We saw a bounce right at the close that allowed it to remain just above.


 I don't usually count these patterns as "in play" until a close below the neckline.  But, in this case, I think that rule is mostly academic.

The reality is that the market will move today in accordance with the news out of Capitol Hill, which might be in keeping with normally reliable chart patterns -- or not.

I have no inside knowledge of the goings on in Washington.  But my view has always been that Congress, while recognizing the need for Fiscal Cliff-type changes, cannot ever be expected to commit political suicide by actually voting for them.

Old guys in strongly partisan districts might be the exception, and we're seeing olive branches extended (even aisle-crossing) by some.  But, young turks whose anti-establishment vitriol got them elected are unlikely to fall in line -- as happened with Plan B last week.

And, if that sounds like I'm hedging my bets, it should (metaphorically, anyway.)  Betting on the outcome of the political process is a crap shoot, pure and simple.  I express an opinion because that's what members expect.  It should, in no way, be considered as fact until after midnight tonight.

Our forecast still calls for much lower prices in the next 9 sessions.  Thus, I remain short. But, anyone uncomfortable with the very real risk of a short position imploding as the result of a last minute political stick-save should really be on the sidelines until all the dust settles.

continued on pebblewriter.com...

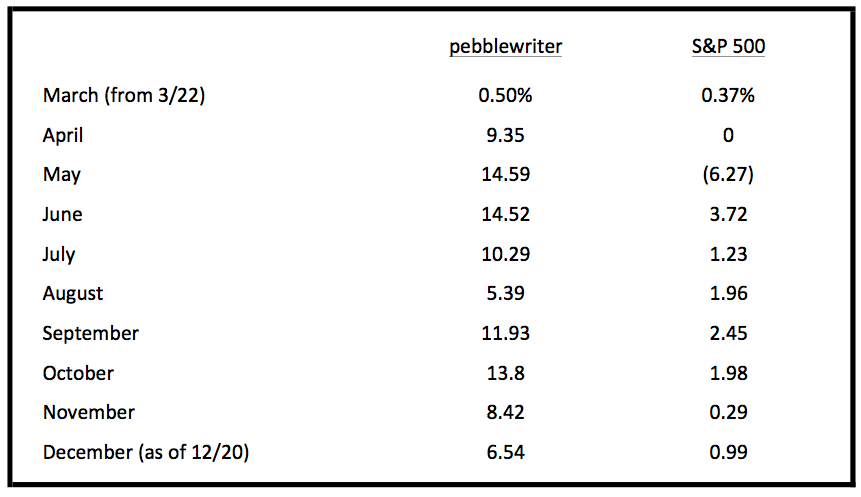
Attention Prospective Members:  Membership rates are slated to increase on January 1, 2013.  I have been following a practice of charging about $10 for every percentage point of return.  Our results for the first nine months of the new site (since inception March 22) total a little over 95% [DETAILS HERE], so the new rates will be:
  • Quarterly:              $375
  • Semi-Annual:         $550
  • Annual:                  $950
If we're fortunate enough to continue averaging a little over 10% per month, annual memberships would be $1,200+ in March.  Wouldn't it be great if you could lock in your rate now?  You're in luck!
I announced a few days ago that the first fifteen to sign up for an annual membership at the current rate of $800 would be granted Charter Member status.  

Charter Member rates are locked in for the life of the site, so you'll never pay more -- no matter where annual rates end up.  And, Charter Members will also be eligible for discounts on other services currently in the works. 

The response has been pretty strong; and, I'd hate to exclude anyone stuck on a plane or a ski slope.  Okay... it might also have something to do with a busy weekend with the family (yesterday was my 17th wedding anniversary) and the fact that I haven't had time to put together a new Sign-Up page.


Regardless, consider the offer extended just a little longer (but, don't push your luck!)


Friday, December 28, 2012

Winding Down

Today's post concludes a week of publicly available intra-day posts, my little gift to those considering a pebblewriter membership.

Seems like everyone's talking about the fiscal cliff.  I'd like to take a moment and talk about another important issue: the Fee-scal Cliff.

As announced on Monday, subscription prices will increase on January 1.  In keeping with our practice of paying for performance, the annual rate will be about $10 for each percentage point of return since the new site’s inception on Mar 22, 2012.


We’re up about 95% over those first nine months [SEE DETAILS HERE] so the new rates will be as follows:
  • Annual:  $950
  • Semi-Annual: $550
  • Quarterly:  $375
The first fifteen to sign up for an annual membership at the current rate of $800, however, will be granted Charter Member status.  Charter Member rates are locked in for the life of the site, so you’ll never pay more — no matter where annual rates end up.

If we are fortunate enough to continue averaging a little over 10% per month, annual memberships would be $1,200+ in March.  So, locking in current prices is a no-brainer.

Sign up HERE.

*  *  *  *  *  *  *  * 

Time is running out for the Heroes of The Hill.  Market corrections don't require that everyone turn bearish -- just the handful in the middle whose selling turns the tide.   Those investors who have been wondering, waiting hopefully for a fiscal cliff deal to emerge from Washington... might at least a few of them decide to rein in their equity exposure today?

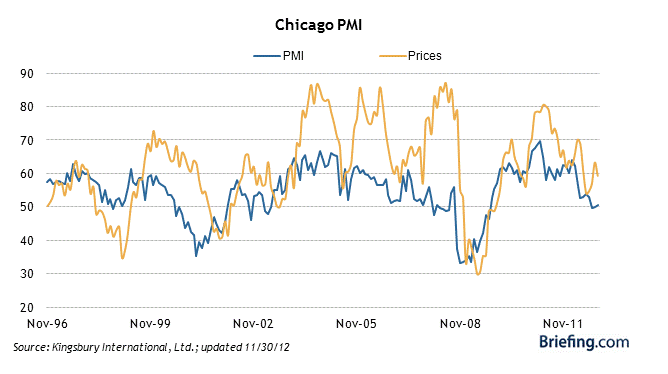
Watch this morning for the Chicago PMI -- due out at 9:45 EST.  Last month, it turned up slightly, but was considered bearish due to the decline in new orders.  From Briefing.com:


Briefing.com puts out great graphs, such as this one on the relationship between pricing and the PMI itself.  Not a terribly bullish looking chart.
 
UPDATE:  9:44 AM

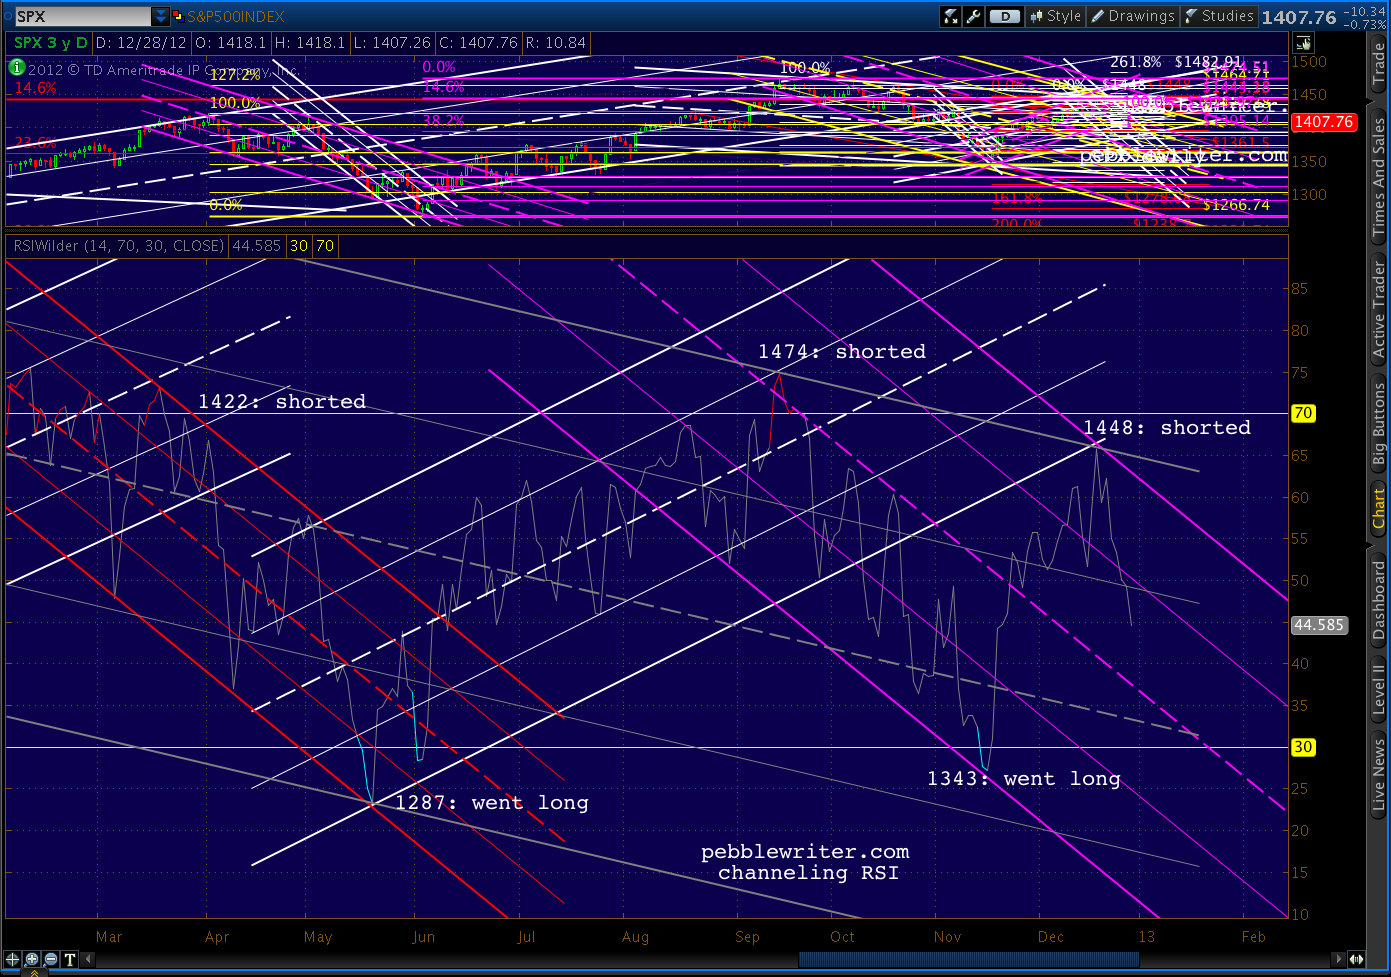
We remain short from 1447 on Dec 18.  RSI has a long ways to go before finding any channel support...


Why am I always talking about RSI? It might be the fact that it's helped me call almost every major turn the past couple of years.  As regular readers know, I employ a deceptively simple-looking practice of channeling RSI values in different time frames.

Combined with Harmonics and other chart patterns, it has been very effective in forecasting.  Consider the past six months alone...


April 2 -- Shorted:  SPX completed a Butterfly Pattern at a channel top at 1421.05.  It was also the third lower RSI value in a row on higher prices (negative divergence) after RSI tagged a channel midline.  See: All the Pretty Butterflies.

June 1 -- Went Long:  SPX reached the bottom of an RSI channel, back-tested a falling wedge and found harmonic support -- all at the price levels forecast by an analog that had been going gangbusters since April 9.  See: Why I'm Buying.

September 14 -- Shorted:  SPX had completed a Bat Pattern that dated back to October 2007, tagged RSI and price channel lines.  VIX and DX RSI channels also indicated impending reversals. See: The World According to Ben.

November 16 -- Went Long:  SPX had reached three important harmonic targets, reached a H&S Pattern target, tagged RSI and price channel bottoms -- all at a price level forecast on October 31.  See: CIW Nov 16.

December 18 -- Shorted:  Prices overshot our forecast target by 6 days and 10 points, completing a Gartley Pattern set up by the 1474 - 1343 drop. But, in the process, daily RSI completed a perfect back-test of the recently broken channel that had governed the rally since June.  See: CIW Dec 18.

Together, these major moves accounted for returns of about 40% since the new site's inception on March 22.  The other 55% came from interim swings ranging from an hour to a few weeks [see: Results.]  But, all of them were influenced by RSI channels.

I don't know of any analysts who use them.  A Google search for the term "RSI channel" shows a whopping 3 hits in the past month -- two of them from this site.  Have folks tried them and failed, or are they just too complicated?

Though they're almost always obvious in the rear-view mirror, RSI channels can be very difficult to use in forecasting.  Charts drawn in different time frames can suggest very different results.  They're tough to use in choppy, directionless markets.  And, divergence is always a challenge.

In short, RSI channels aren't for everybody.  It helps if you enjoy staring at charts for hours at a time, and can pick out patterns in a jumble of seemingly random lines.  It also helps to understand higher math, as RSI is essentially a derivative of price movements (magnitude and velocity of price changes.)

If you're thinking about using RSI channels, you might want to start with an aptitude test -- available here.  Or, just tune in each day and I'll let you know what I think.  After a year of practice and a few thousand charts, I view them as an indispensable secret weapon.

UPDATE:  12:20 PM

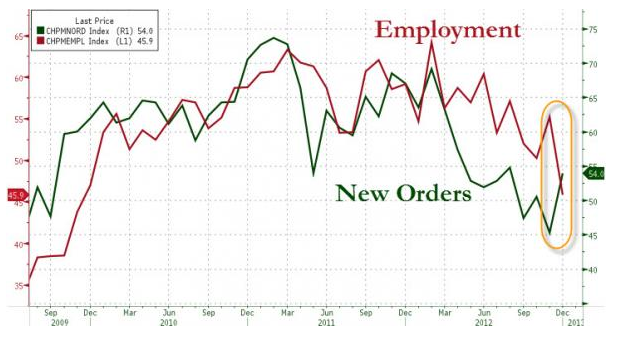
Chicago PMI [download here] actually increased from 50.4 to 51.6 this month -- though it would still have been below 50 if not for the always handy "seasonal adjustment."

The increase again conceals a troubling development: employment and capital spending are both sliding.  New orders rebounded almost to October levels, but CapEx hit a new 28-month low, while employment plunged from 55.2 to 45.9 -- the lowest level in three years.


continued on pebblewriter.com...

Wednesday, December 26, 2012

Charts I'm Watching: December 26, 2012

I hope everyone had a lovely Christmas.  Intra-day posts will be open to the public this week, my little gift to those considering a pebblewriter membership.   Sorry, but our forecast will still be available to members only.

As announced on Monday, subscription prices will increase on January 1.  In keeping with our practice of paying for performance, the annual rate will be about $10 for each percentage point of return since the new site's inception on Mar 22, 2012.

We're up about 95% over those first nine months [SEE DETAILS HERE] so the new rates will be as follows:


    The first fifteen to sign up for an annual membership at the current rate of $800, however, will be granted Charter Member status.  Charter Member rates are locked in for the life of the site, so you'll never pay more -- no matter where annual rates end up.

    If we are fortunate enough to continue averaging a little over 10% per month, annual memberships would be $1,200+ in March.  So, locking in current prices is a no-brainer.
    Sign up HERE.

    *  *  *  *  *  *  *  * 

    We remain short from 1447 on Dec 18.   Per the 1:10 post in the members section:
    SPX just tagged the .786 mentioned above, pushing just beyond 1446.44.  I’m closing my intra-day longs (again) here at 1447 and will see what kind of reaction we get here.  Charts in a few.
    But, I'll repeat my warning from Monday: bulls will be looking for opportunities to shift momentum, and it could be especially easy with low volume and the inattention that comes with a holiday week like this.

    Keep an eye on the dollar index and the little H&S patterns on SPX this morning.  Some strength is to be expected early in the session, but there is the risk of a small breakout.


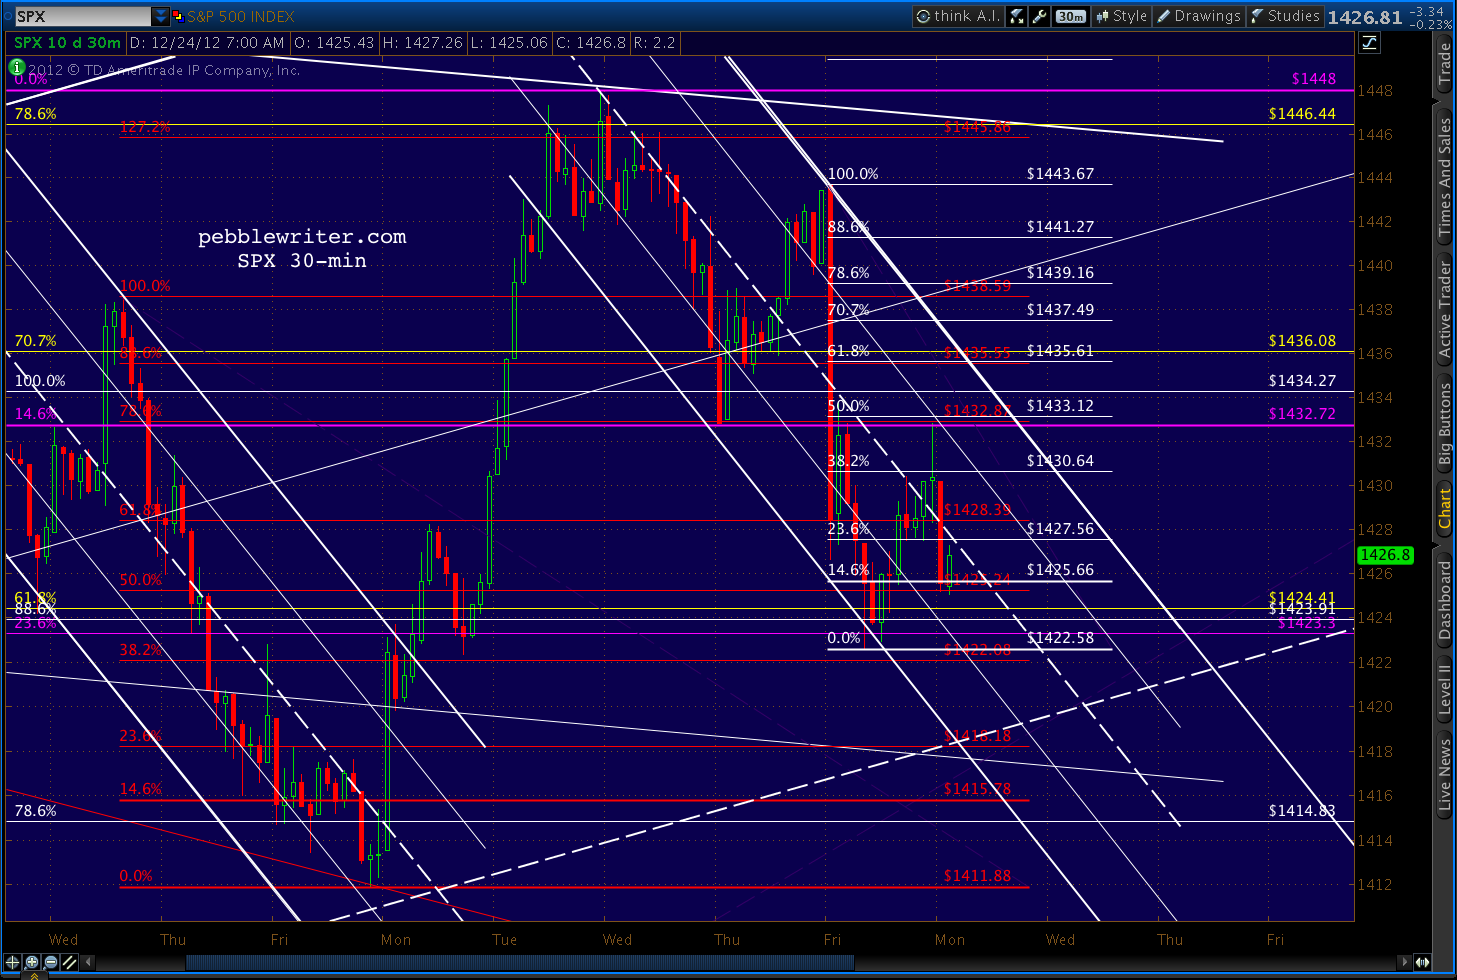
    As we discussed Monday, the key SPX level to watch is 1432, which would take prices out of the proposed falling channel as well as complete the lopsided little IH&S that targets a Bat Pattern completion at 1441.  I'd put the odds at 50:50.


    SPX's bearish H&S pattern has picked up a new neckiline -- the bottom of the purple channel above.  The neckline is rising, but it currently completes around 1425.

    The EURUSD is coming up on its .618 at 1.3250 -- also the top of a well-formed channel.  The rally should fail at that point, with the key level to watch afterwards being the recent bottom at 1.3157.  Charts later.

    UPDATE:  10:50 AM

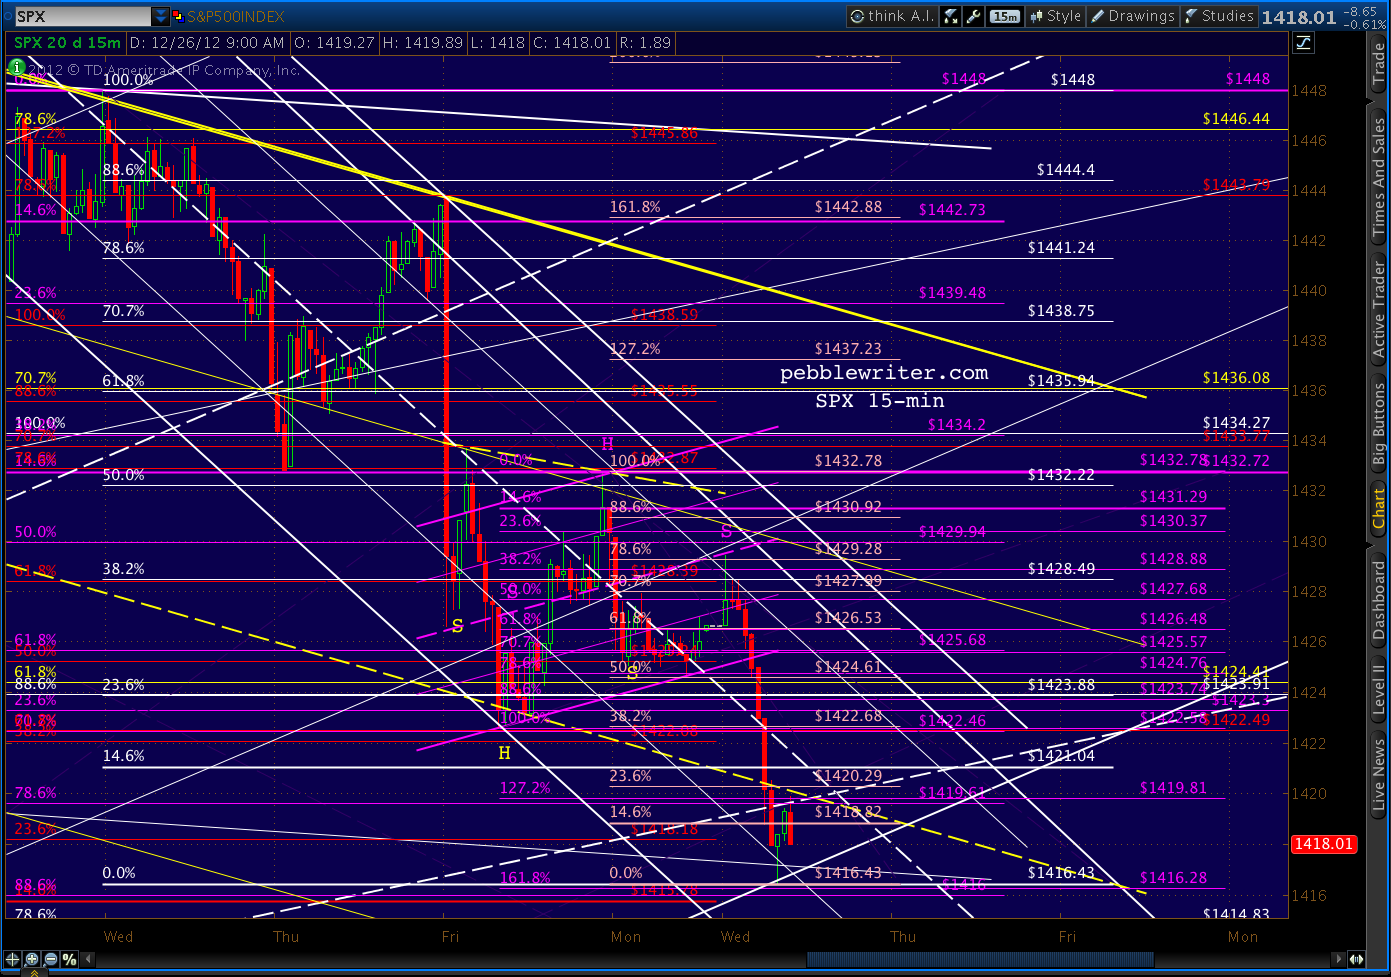
    SPX just broke below the neckline of the bearish H&S pattern (in purple below.)  If the pattern plays out, it targets about 1416 -- which intersects with a little Crab Pattern at the purple 1.618 at 1416.28.  The key level for bulls to hold is 1422.58.


    A drop to 1416 would very likely see a decent bounce, as it also represents a Bat Pattern completion at the Fib .886 of the 1411 - 1448 rally between Dec 14 and Dec 18.

    The slightly less likely target is the 1.272/.786 intersection at 1419.61-1419.81.  Either level marks an important channel midline, which -- combined with the harmonic pattern completions -- could elicit a strong bounce.

    A drop through 1411 means much more immediate downside.

    UPDATE:  12:00 PM

     We reached our primary target, reversing at 1416.43.  If SPX can break back through the white channel midline at around 1422, the top case is a bounce to the .618 just formed at 1426.53 (also a white channel line) or the .786 at 1429.28 (the top of the white channel.)

    This is a short-term trade only, and is likely to complete by Friday.  As always, stops are strongly recommended -- so, 1415ish should do the trick.


    Any breakout from the channel has upside potential to 1436.

    UPDATE:  12:30 PM

    DX tested the bottom of the little white channel I posted earlier, then zipped right back to its midline with the equities sell-off to 1416.43.


    It has now tested the upper bound of the yellow channel twice in the past two sessions, and must either commit to the rapidly rising white channel  -- breaking out of the yellow -- or  consolidating further.

    A break out of the SPX white channel would likely equate to a breakdown of DX's white channel.  If stocks get a rebound to 1436 as discussed above, look for the dollar to flesh out the proposed purple channel to around the .618 at 79.319.

    Tuesday, December 25, 2012

    Market Update

    ~reposted from pebblewriter.com
    Strange things have happened around holidays this past year.  Though this is a short day (equity markets close at 1pm EST) it’s best to remain vigilant.  Equity futures have recovered most of their overnight losses, and TPTB would love nothing more than to undo the gains we’ve racked up (since shorting on the 18th) while no one’s looking.

    Keep an eye on the dollar's proposed channel for any signs of weakness…


    …as well as the EURUSD, which is trying to stage a comeback.  A move through 1.3232 would signal 1.3265 — 1.3238.


    UPDATE:  10:15 AM

    As to SPX, any push beyond 1432.78 carries the risk of a Bat completion up at 1441.27.  Though, there would no doubt be a reaction at the .618 of 1435 first.


    Since the 1432.78 high on Dec 21 stopped just shy of the 1432.82 low the day before, it might mark the completion of a Wave 4 in the first subwave of whatever degree wave down we’re currently in.  Thus, the bulls might attempt to throw this most obvious bearish wave count into disarray by overlapping 1432.82.

    It would then be easier to characterize the 1448-1422 slide as a normal A-B-C corrective wave rather than a bearish impulsive wave.  Regular readers know that I don’t use Elliott Wave for predictive purposes, but it’s good to be aware of what Wavers might be thinking — since breaking through key EW levels will likely get them moving one direction or the other.

    Our bearish case would benefit most by a reversal right here at the midline of the proposed white channel.

    More later.

    UPDATE:  11:45 AM

    SPX just completed a small H&S pattern (below, in purple.)  If it plays out, it will negate a potential IH&S pattern (in yellow).  If the purple pattern plays out, it targets 1417 or so, which is around the bottom of the little white channel that’s tracking pretty well so far.


    If the yellow pattern completes with a return to the dashed yellow line at Friday’s 1432 high, it would target somewhere in the vicinity of the .886 retracement of the 1443-1422 drop at 1441.
    A low-volume, holiday-shortened feel-good day like today would be the perfect time to execute a ramp job.  As discussed above, keep your guard up.

    UPDATE:  1:00 PM

    Things remain on track here at the end of the holiday-shortened equity trading day.  Any fireworks will have to wait until Wednesday.


    BTW, I updated the RESULTS PAGE this weekend for those who follow such things.  Friday marked the end of the third quarter since the new site went live on Mar 22.  After Dec 31, reports will be based upon calendar quarters.


    Since inception last March, we’re up about 95% as compared to 3.7% for SPX (without dividends.)  I don’t have figures for the same time period for hedge funds, but according to HSBC’s Dec 13 Hedge Fund Weekly [available on Zerohedge.com] the average ytd performance for all equity hedge funds was 5.15%.  The top-performing fund (BTG Pactual’s Distressed Mortgage Fund) returned 39.91%.

    For more, click HERE.


    Sunday, December 2, 2012

    Zwieg Thrust Bust

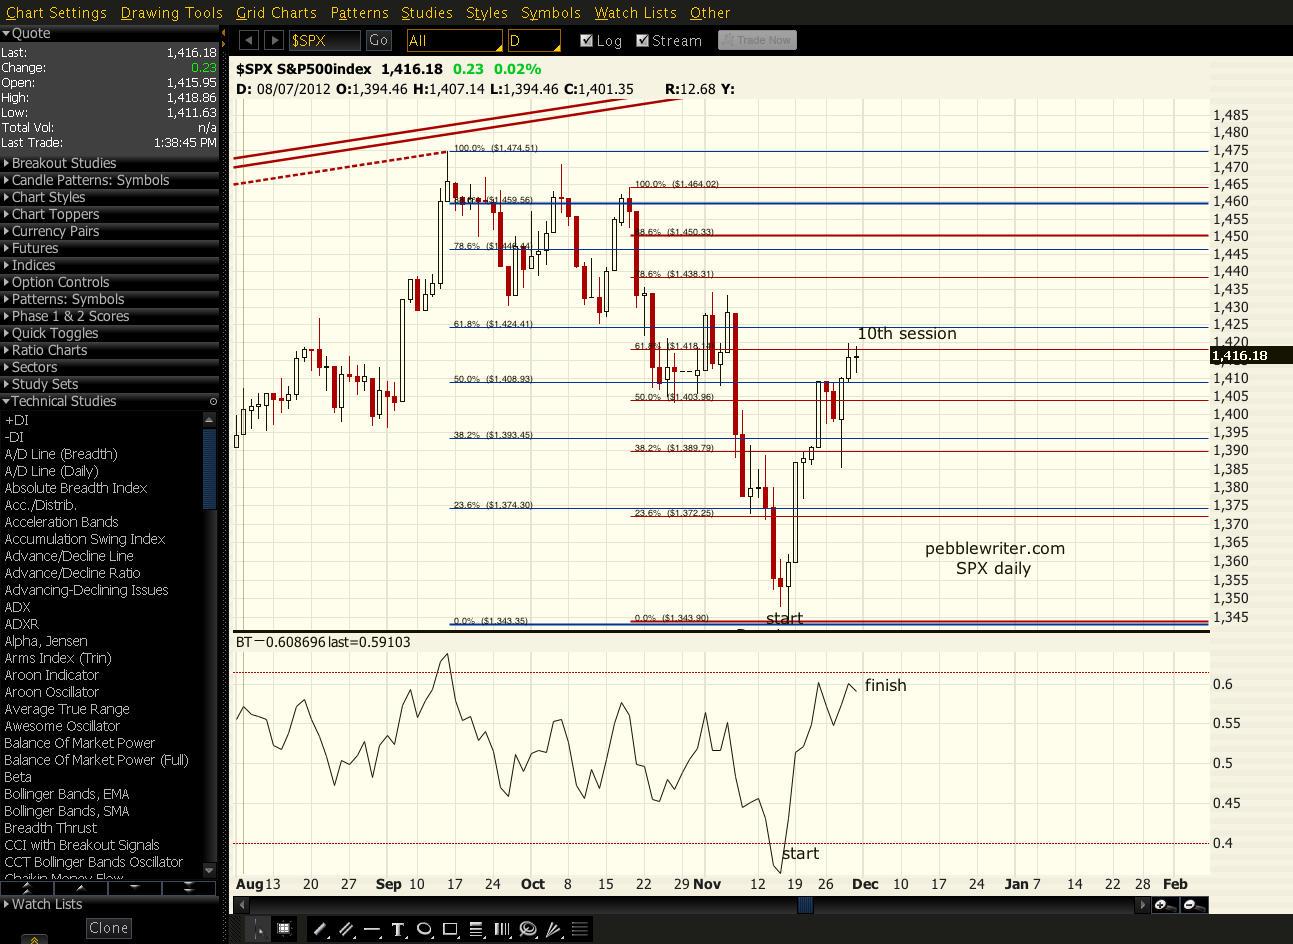
    Came close Friday, but didn't happen.  A ZBT requires a move from .40 to .60 in 10 sessions or less.  Here's a successful signal from Sep 2011:


    And, here's where we ended up Friday -- the 10th session from the .40 cross:


    Ditto for NYSE & DJIA too, BTW.