PEBBLEWRITER.COM IS LIVE!


*************** PEBBLEWRITER.COM IS LIVE! TO SIGN UP, CLICK HERE ***************


Friday, November 30, 2012

Stay Groovy

"It was an expression used by small recon units and sniper teams in hostile terrain in Vietnam. They would tell one another to stay groovy when the danger level was so insanely high they popped amphetamines to stay awake and ready to rock twenty-four/ seven, because anything less would get them all killed. Stay groovy; take your pill. Stay groovy; safety off, finger on. Stay groovy; welcome to hell."
 The Watchman, Robert Crais


Those who have been following this blog or its predecessor for any length of time know I'm a big fan of analogs.  I was asked just yesterday why I thought they worked, and found myself fumbling for an answer.

Like harmonics, I know that they do, because they've enabled us to make some nice calls that were accurate as to price and time such as the big downturn in April and the subsequent 1474 top in September.


The big Kahuna, of course, was the July/August plunge in 2011 that mirrored that of Dec 07-Jan 08.  It's just plain scary how well that turned out.


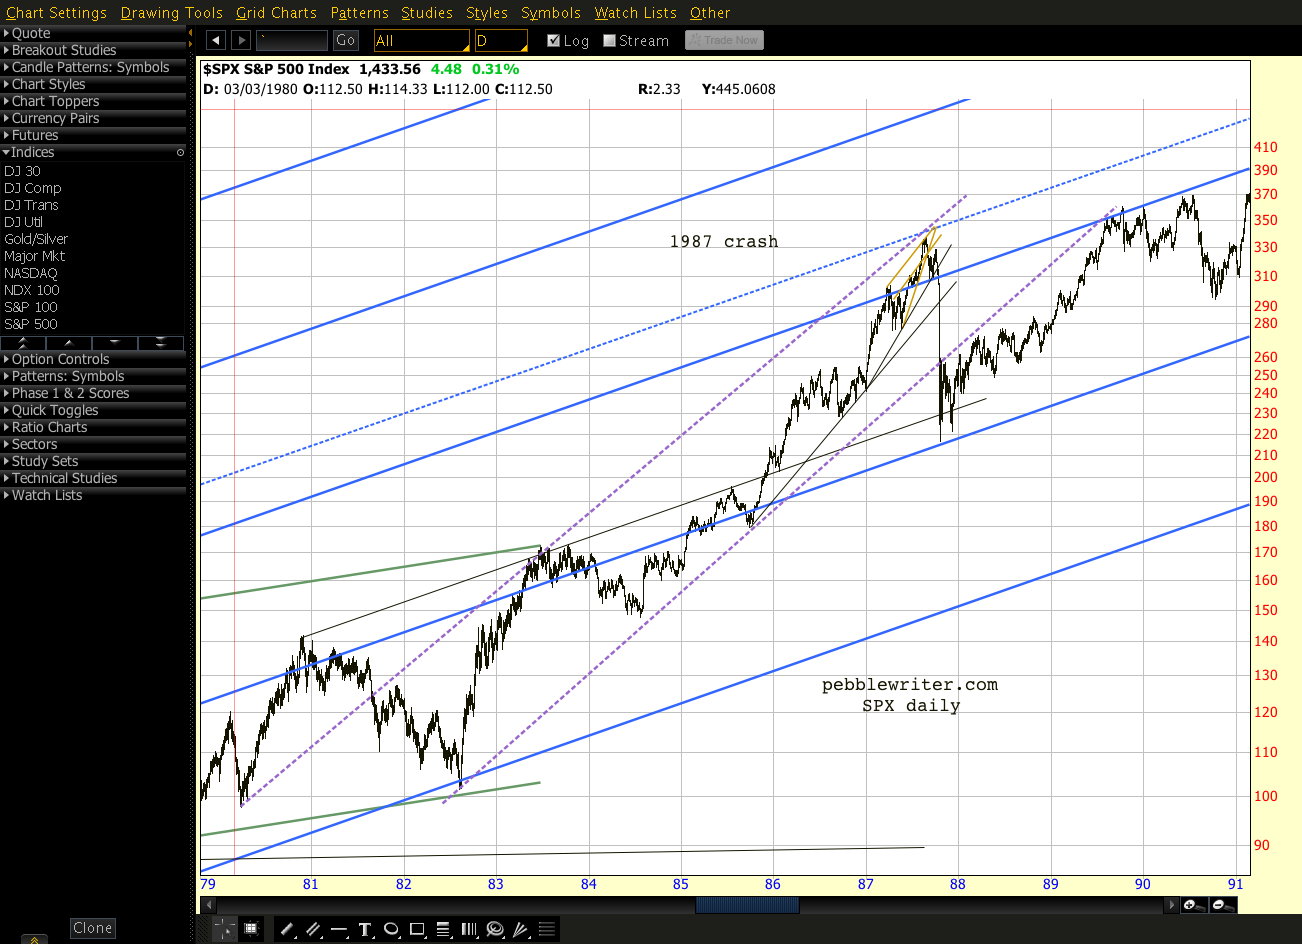
I think analogs work mostly because of channels and harmonics.  In the simplest terms, channels keep prices pointed in a general direction for a noticeable period of time.  They can last for decades...


a few years...


...or a few days.


Regardless, I've found that most significant moves occur within or interact with channels.  Very often, as in the above chart, they're channels within channels.  Even big channels that seem to generate their own atmosphere are usually aligned with other big channels.


So, it's not terribly surprising when moves that bring the market to the brink of disaster or reach ridiculously overbought levels engender reactions of "Hey!  Just like last time!"

Harmonics, likewise, are usually related.  The easiest example is the 2007-2009 plunge from 1576 to 666 which, when followed by a reversal at its .618 Fib level, signaled both a Gartley Pattern reversal at its .786 retracement (the May 2011 high) and a Bat Pattern reversal at its .886 (Sep 2012 1474 high.)


Combining the two, and tossing in some other chart patterns and traditional technical analysis, it's easy to see why the market has done what it has most of the time.  If markets move in somewhat predictable and repeatable ways, then analogs can be viewed as a predictable aggregation of those predictable moves.

Of course, its not always as simple as that sounds.  Even great analogs usually present alternatives. Over the past couple of months, the one we're following now has hit our primary target at times and our secondary targets other times.


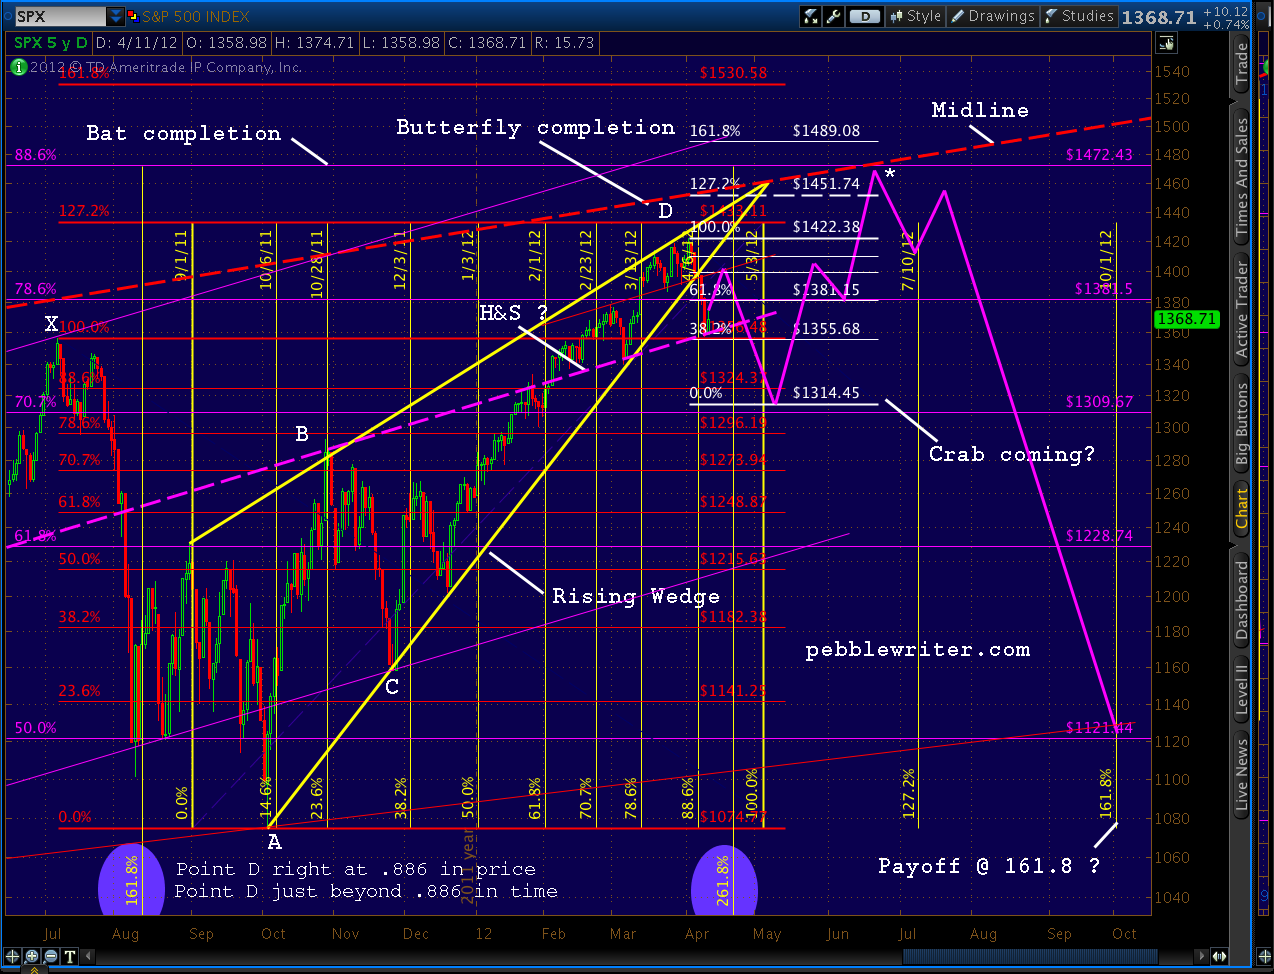
And, some can be tough to get a handle on.  The one from this past April [see: New Analog I'm Watching] that very capably guided us from 1422 to 1266 and back up to 1474 (the top chart above) worked beautifully from a price standpoint, but was way off in terms of timing (since licked, I think.)


And, last, there's a truism that's the bane of every analyst who charts analogs:
Every analog works forever...until it doesn't.
Even as we're counting down the last few points to the 10% downturn we charted all those months ago, a well-timed Bernanke comment or Hilsenrath article (is there really a difference?) could nudge the markets just enough to complete a Zweig Breadth Thrust event that ushers in a new high.

If that happens, never mind.  End of the road.  It's been a nice ride for the past nine months, but it's time to change partners.  If it doesn't, however, and we reverse in the next 10-15 points, it's just about time for the song.

Thursday, November 29, 2012

What's Next

Long-time readers know I'm a huge fan of analogs.  They enabled us to catch the July-Aug 2011, April 2012 and September 2012 downturns to the very day  [see: Pebblewriter: Analogs]

To coin a phrase, analogs been berry, berry good to me.  Here's the latest reason why:


Our SPX Forecast from Oct 31 
[pebblewriter.com:  A New Old Analog]...


SPX price action through Nov 29, overlaid


The picture going forward has changed somewhat.  For full details, and to be in the know next time we post one, consider joining pebblewriter.com.

The current membership promotion expires this Saturday.  Make a $100 or greater contribution to the Hurricane Sandy relief effort and get 25% ($200) off the price of an annual membership.

Beat the price increase coming next week, and do well by doing good!  Details HERE.

Thursday, November 8, 2012

Harmonics Are Your Friend

reposted from pebblewriter.com...

It seems longer than seven weeks since we led with this chart on Sep 14 [see: The World According to Ben.]   QE3, the ECB's latest stick save and the German Constitutional Court's pro-ESM decision had all just been announced.  According to just about everyone, stocks were about to explode higher.


To me, it was a long-awaited shorting opportunity.
Meanwhile, SPX is nearing our 1472 target. I will ease some stops into the equation as we approach it, as I'd like to remain long for as long as possible.  This is a 35 point gain since we went long yesterday at 1437 with the Fed's announcement.
And, less than an hour later...
Going ahead and pull the plug on my longs here at 1474.  The 5-min, 15-min and 60-min charts are all showing negative divergence.  I'll place stops at 1475 or so, trailing lower as need be, just in case it makes another run higher.
It wasn't rocket science -- just a big Bat Pattern that had finally completed.  Those who simply hung on to that short position scored 86 points for a nice 5.8% gain.  For buy and hold types, it's been a great trade that is nearing an end.

For us swing traders, it's been a wild ride with (much) higher returns [Results] from anticipating the swings that had most analysts scratching their heads.  Yet, most of the swings were signaled by Harmonic Patterns, chart patterns and -- most recently -- an analog we've been following.

We were able, for instance, to short again just ahead of yesterday's plunge -- earning me some sympathetic private messages from well-meaning friends ["Are you sure, man?  This one seems kinda out there, especially without any election results yet."  B.B.]

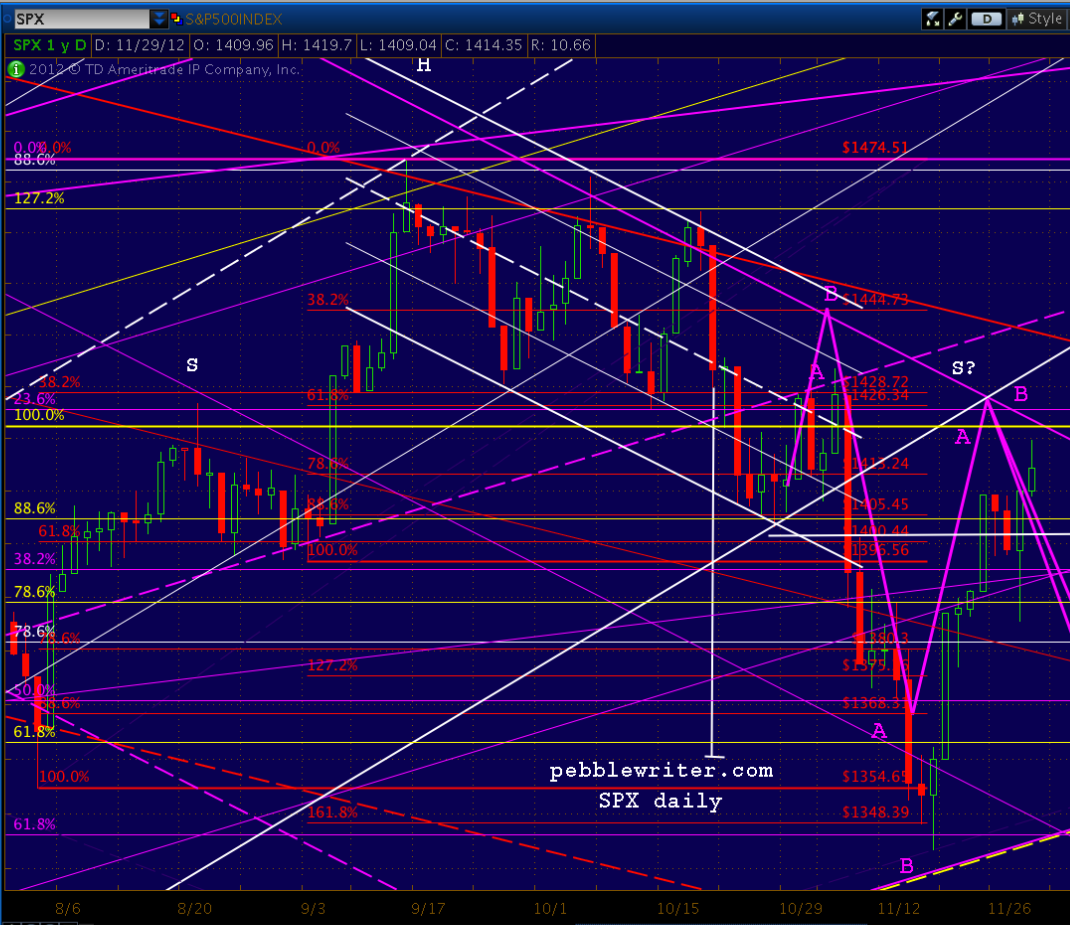
What now?  Here's the same chart as above -- seven weeks later.  We're coming up on the next Fib level lower -- the .786 retracement of the 1576 to 666 crash.  And, it just so happens that we're nearing the SMA 200 at 1380.80.


Not shown on this chart, there's also a Crab Pattern completion at 1384.13, not to mention the .786 of the 1354 to 1474 run at 1380.30.  So, as the rest of the investing world is jumping on the bearish bandwagon, harmonics are signaling another important and unexpected turn.

continued on pebblewriter.com...


*  *  *  *  *  *  *  *

Did you know that generosity could benefit your investment returns? 

For anyone donating at least $100 to the Red Cross hurricane relief efforts, I'll knock $200 off an $800 annual subscription to pebblewriter.com.  Kind of a no-brainer, really...

  1. Go to the Red Cross Website HERE
  2. Contribute $100 or (preferably much) more.
  3. Wait about 30 seconds for them to email you a receipt.
  4. Forward a copy of the receipt to me at michael at pebblewriter dot com
  5. I'll email you a PayPal invoice for $600.
  6. Save 25% while enjoying of the best investment blogs going.

Of course, you could always sign up for a monthly membership for $105 (auto-renew), but this way you get a whole year's worth of great info for about half the price -- all while doing good for some very needy folks.   This offer is good until further notice.

Thanks.


Wednesday, November 7, 2012

End of the Ride


While there is plenty to be worried about, you’d never know it from the way the markets have performed.  The S&P 500 has rallied 121% since March 2009 and sits only 50 points away from its recent high which, itself, was only 100 points from an all-time high.

All it took was $16 trillion of deficit spending, a few trillion in quantitative easing, some serious arm-twisting overseas, and a Plunge Protection Team that paid very careful attention to chart patterns.

Some economists (and central bankers) maintain that these steps were necessary in order to free the economy from the worst recession since the Great Depression.  I maintain they were taken primarily to keep global banks from failing.  Ending the Great Recession is the hoped-for side effect.

In my opinion, the books of the world’s largest banks are being cooked (with central bankers’ blessings) to such an extent as to make their balance sheets and income statements a farce.  They are being allowed to carry distressed and dead assets at book value, and to report their trillions in derivatives as a matched book without providing any details to investors.

Why do I harp about government, Fed and bank balance sheets?  Because, in the end, they must be dealt with.  The enormous sums are somewhat manageable with historically low interest rates, a co-dependent regulatory environment and a complicit mainstream media.

But, eventually, the scales will tip.  The truth will out.  Simple arithmetic will once again be accepted and the severity of our situation acknowledged.   The key to higher stock prices isn’t whether everything is getting better.  The key is how much longer TPTB can catapult the propaganda.


While I enjoy making money in the markets as much as anyone, I am saddened by the circumstances that make the analog we're following [see: A New Old Analog] possible, if not inevitable.